


Abstract
Immunoglobulin A nephropathy (IgAN) is characterized by predominant IgA deposition in the glomerular mesangium. Previous studies have proved that renal-deposited IgA in IgAN came from circulating IgA1-containing complexes (CICs).
To explore the composition of CICs in IgAN, we isolated CICs from IgAN patients and healthy controls and then quantitatively analyzed them by mass spectrometry. Meanwhile, the isolated CICs were used to treat human mesangial cells to monitor mesangial cell injury. Using the protein content and injury effects, the key constituent in CICs was identified. Then the circulating levels of identified key constituent–IgA complex were detected in an independent population by an in-house-developed enzyme-linked immunosorbent assay.
By comparing the proteins of CICs between IgAN patients and controls, we found that 14 proteins showed significantly different levels. Among them, α1-microglobulin content in CICs was associated with not only in vitro mesangial cell proliferation and monocyte chemoattractant protein 1 secretion, but also in vivo estimated glomerular filtration rate (eGFR) levels and tubulointerstitial lesions in IgAN patients. Moreover, we found α1-microglobulin was prone to bind aberrant glycosylated IgA1. Additionally, elevated circulating IgA-α1-microglobulin complex levels were detected in an independent IgAN population and IgA-α1-microglobulin complex levels were correlated with hypertension, eGFR levels and Oxford T- scores in these IgAN patients.
Our results suggest that the IgA-α1-microglobulin complex is an important constituent in CICs and that circulating IgA-α1-microglobulin complex detection might serve as a potential noninvasive biomarker detection method for IgAN.
What is already known about this subject?
Mounting evidence demonstrates that the pivotal factor in the pathogenesis of IgA nephropathy (IgAN) is circulating IgA1-containing complexes (CICs), which contain galactose-deficient IgA1, IgG antibodies and some unidentified proteins. We searched PubMed for studies on systematic CIC analysis by using the terms ‘IgA nephropathy’, ‘circulating immune complex’ and ‘mass spectrometry’. To date, only three studies were identified, but none of them demonstrated the components of CICs.
What this study adds?
Using quantitative mass spectrometry–based screening, we systematically analyzed the proteins in CICs and identified IgA-α1-microglobulin complex as a key constituent in CICs, which was higher in IgAN patients and positively correlated with mesangial cell activation and manifestations of IgAN. In patients with IgAN, we developed a simple enzyme-linked immunosorbent assay for IgA-α1-microglobulin complex and observed an elevated circulating IgA-α1-microglobulin level in an independent IgAN population.
What impact this may have on practice or policy?
These findings suggest IgA-α1-microglobulin complex as a key constituent in CICs and a potential noninvasive biomarker in IgAN.
INTRODUCTION
IgA nephropathy (IgAN), which is characterized by either dominant or codominant IgA deposition in the glomerular mesangium [1–3], is the most common primary glomerulonephritis worldwide [4], and 20–40% of patients progressed to end-stage renal disease within two decades after diagnosis [5–7]. Currently the widely accepted mechanism of IgAN pathogenesis is the multihit hypothesis, in which polymeric galactose-deficient IgA1 (Gd-IgA1), as well as IgG or IgA antibodies that react with Gd-IgA1, forms circulating IgA1-containing complexes (CICs) and then the CICs deposit in the mesangium, triggering complement system activation and inflammatory reaction [8, 9] that leads to glomerular injury. Therefore, understanding the formation process and the constituents of CICs is of critical importance for developing novel therapeutic strategies for IgAN.
As the main constituents of CICs, Gd-IgA1 and antiglycan IgG/IgA antibodies have been investigated throughout the years [10, 11]. In addition to Gd-IgA1 and antiglycan antibodies, numerous other proteins have also been reported to be present in CICs. Cederholm et al. [12] first found that CICs contain IgA and fibronectin. Moreover, Jennette et al. [13] observed that patients with IgAN had higher levels of serum IgA–fibronectin aggregates than normal controls. Nakamura et al. [14] revealed that CICs also contain IgM, IgG and C3. In recent years, several studies have suggested that soluble CD89 binds Gd-IgA1 and thus forms CICs in IgAN [15–17]. To explore the biological effect of CIC constituents, such as Gd-IgA1 and antiglycan antibodies, we performed experiments and found that the IgG–Gd-IgA1 complex showed less injury effect on mesangial cells than CICs purified from patients with IgAN [18, 19]. These findings suggested that in addition to Gd-IgA1 and antiglycan antibodies, other constituents in CICs also participate in IgAN development and progression.
To systematically analyze the CIC constituents, in this study we first applied quantitative mass spectrometry (MS) analysis on CICs and then coupled these data with the biological effect of CICs on mesangial cells to identify the important constituents. Finally, we detected levels of the key constituents in the circulation in an independent IgAN cohort.
MATERIALS AND METHODS
Study population
In this study, a total of 243 patients with biopsy-proven primary IgAN and 68 age-, sex- and geographically matched unrelated healthy controls (HCs) were recruited. Patients with systemic disease or secondary factors of IgAN were excluded. Patients who received corticosteroids or immunosuppressive therapies were also excluded.
Our study population contained two independent groups, the discovery IgAN cohort (35 IgAN and 17 HC subjects) and an independent IgAN cohort (208 IgAN and 51 HC subjects). The discovery IgAN cohort was used to identify differentiating constituents of CICs between patients with IgAN and controls. Then the identified target constituent was detected in the independent IgAN cohort. Figure 1 shows the flow chart of experiments and analyses applied in our study.
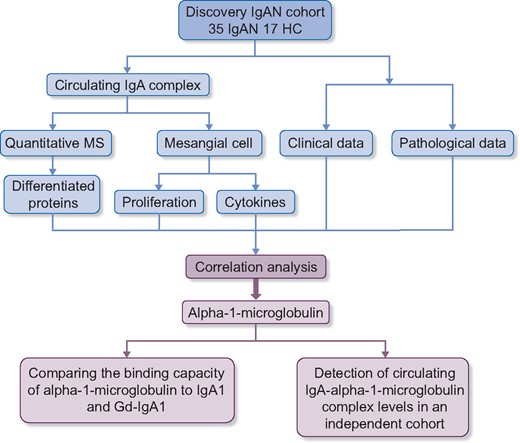
Flow chart of this study. In our study, a discovery IgAN cohort was used for identifying the key constituents in CICs. The differentiating proteins in CICs between IgAN patients and HCs were identified by the TMT method. Additionally, these CICs were used in vitro to treat cultured mesangial cells and the levels of inflammatory cytokines and proliferation were measured. A correlation analysis revealed that only one differentiated protein, α1-microglobulin, correlated not only with proliferation and cytokine secretion in cultured mesangial cells but also with severe tubulointerstitial lesions and decreased eGFR in vivo. Then the binding capacities of α1-microglobulin were compared with IgA1 and Gd-IgA1. Finally, IgA-α1-microglobulin complex levels in an independent IgAN cohort were detected by ELISA.
The study was conducted according to the principles of the Declaration of Helsinki and approved by the medical ethics committee of Peking University First Hospital.
Clinical and pathological data collection
Clinical manifestations at the time of renal biopsy were collected from medical records. The estimated glomerular filtration rate (eGFR) of patients with IgAN was calculated by the Chronic Kidney Disease Epidemiology Collaboration creatinine equation [20]. For pathological data, the Oxford classification, including mesangial hypercellularity (M), endocapillary hypercellularity (E), segmental sclerosis (S), interstitial fibrosis/tubular atrophy (T) lesions and crescents (C), was adopted to evaluate histological lesions for those with more than eight glomeruli in biopsy specimens [21, 22].
Isolation of IgA1-containing complexes and monomeric IgA1
For recruited individuals, ethylenediaminetetraacetic acid anticoagulated plasma was collected on the day of renal biopsy (IgAN patients) or recruitment in this study (HCs). For IgA1-containing complexes and monomeric IgA1, the isolation procedure was performed as previously reported [18, 19]. In brief, IgA1 was first purified from plasma by jacalin (Thermo Fisher Scientific, Waltham, MA, USA) affinity chromatography and then separated by Sephacryl S-300 gel filtration chromatography (GE Healthcare, Chicago, IL, USA) to obtain IgA1-containing complexes as well as monomeric IgA1. The isolated proteins were buffer exchanged to phosphate-buffered saline (PBS), concentrated by 30-kDa centrifugal filter units (Millipore, Burlington, MA, USA) and stored at −70°C.
Mesangial cell culture experiments
Primary human renal mesangial cells were purchased from ScienCell (Carlsbad, CA, USA) and cultured according to the manufacturer’s protocols. After serum starvation for 18 h, CICs (100 μg/mL) derived from patients with IgAN and controls were used separately to treat mesangial cells. For proliferation detection, an AQueous One Solution Cell Proliferation Assay (Promega, Madison, WI, USA) was used after 3 h of incubation. For inflammatory factor detection, mesangial cells were treated with CICs for 48 h before the culture supernatants were collected and examined by commercial monocyte chemoattractant protein 1 (MCP-1) and interleukin-6 (IL-6) enzyme-linked immunosorbent assay (ELISA) kits (R&D Systems, Minneapolis, MN, USA) according to the manufacturer’s protocols.
MS analysis of CICs
An in-solution trypsin digestion procedure for the isolated proteins (100 μg/sample) was performed with minor modifications [23]. Briefly, the lysates were reduced with 5 mM dithiothreitol, followed by alkylation with 10 mM iodoacetamide. Then the protein lysates were diluted with urea buffer (8 M urea, 100 mM Tris–HCl, pH 8.5) and digested with trypsin at a ratio of 1:100 overnight. After that, the tryptic digests were acidified with trifluoroacetic acid, desalted by C18 stage tips (3 M) [24], dissolved in tetraethylammonium bromide (100 mM, pH 8.5), quantified by bicinchoninic acidassay (Thermo Fisher Scientific) and labeled by six-plex tandem mass tag (TMT) reagents (Thermo Fisher Scientific) according to the manufacturer’s instructions, as previously described [25]. All six-channel TMT-labeled peptide digests were combined and desalted on C18 extraction disk cartridges (3 M).
Liquid chromatography with tandem MS (MS/MS) analyses were performed on an EASY-nLC1000 UHPLC system (Thermo Fisher Scientific). The TMT-labeled peptides were separated with an in-house-made reversed-phase capillary emitter column. The peptides were eluted with a 180 min gradient of 8–45% buffer B at a flow rate of 200 nL/min. Buffer A was 0.1% formic acid and buffer B was 90% acetonitrile and 0.1% formic acid. MS data were acquired on a Q Exactive mass spectrometer (Thermo Fisher Scientific) controlled by Xcalibur version 2.0 (Thermo Fisher Scientific). The data-dependent top-15 method was used for the MS/MS scans. The precursor spectra were collected in the 300–1700 m/z range at a resolution of 70 000 (at an m/z of 200) with the target value of 1 × 10⁵. The maximum injection time for the full MS scan was set at 50 ms and 150 ms was used for the MS/MS scans. Higher-energy collisional dissociationMS/MS spectra were collected in the Orbitrap at a resolution of 35 000 (at an m/z of 200). The isolation window was set at a width of 1.6 Da and the normalized collision energy (NCE) was set as 28, with 10% stepped NCE. The dynamic exclusion time was set to 60 s. All MS and MS/MS raw files were processed in Proteome Discoverer (Thermo Fisher Scientific) and the analysis strategy is detailed in Supplementary Method 1.
Detection of the binding capacity of Gd-IgA1 to α1-microglobulin
The same amounts of IgA1-sepharose and Gd-IgA1-sepharose (preparation procedures are detailed in Supplementary Method 2) were added to reaction tubes in triplicate and blocked with 1% bovine serum albumin. After washing three times by centrifuging and discarding the supernatant, 0.5, 0.25 or 0.125 mg/mL α1-microglobulin (Fitzgerald, Acton, MA, USA) was added into each reaction tube. After incubation at 37°C overnight, these tubes were washed three times. Then a mouse monoclonal anti-α1-microglobulin antibody (Fitzgerald) was added and incubated at 37°C for 1 h, followed by adding an anti-mouse IgG alkaline phosphatase antibody (Sigma-Aldrich, St. Louis, MO, USA). After washing, the suspended IgA1-sepharose and Gd-IgA1-sepharose were developed with the alkaline phosphatase chromogenic substrate (Sigma-Aldrich) and quenched with 1 M sodium hydroxide. The supernatant was added into a microplate and the absorbance was measured at 405 nm by a plate reader.
Detection of plasma IgA1 and Gd-IgA1 levels
Plasma IgA1 and Gd-IgA1 levels were detected using a sandwich ELISA as previously reported [11]. In brief, the F(ab′)2 fragment of goat anti-human IgA (Jackson ImmunoResearch, West Grove, PA, USA) was coated overnight on plates (Thermo Fisher Scientific). After washing, the coated plates were then blocked for 1 h at 37°C. Duplicates of standards and plasma samples were added and incubated at 37°C for 1 h.
Then, for IgA1 detection, a horseradish peroxidase–labeled mouse anti-human IgA1 monoclonal antibody (Bio-Rad, Hercules, CA, USA) was used as the detection antibody and incubated for 1 h at 37°C. After washing, tetramethylbenzidine peroxidase substrate was added for development and the reaction was finally stopped with 1 M sulfuric acid. The optical density values were read at 450/570 nm. Serially diluted IgA1 (500:7.8125 ng/mL; Abcam, Cambridge, UK) was used as a standard.
For Gd-IgA1 detection, after washing the unbound samples, neuraminidase (PROzyme, Hatward, CA, USA) was added to remove the terminal sialic acid. After washing, biotinylated Helix pomatia lectin (Sigma-Aldrich) was added and incubated for 3 h at 37°C. Then horseradish peroxidase-ExtrAvidin (Sigma-Aldrich) was used as a secondary antibody and incubated for 1 h at 37°C. Finally, the reaction was developed the same as that for IgA1 detection. The standard for Gd-IgA1 detection was a mixture of Gd-IgA1 and commercially available IgA1, as previously described [26].
Detection of plasma IgA-α1-microglobulin complex levels
The IgA-α1-microglobulin complex was measured by an in-house-developed ELISA. First, we prepared biotin-labeled α1-microglobulin and streptavidin-labeled IgA1 as standards. For this preparation we followed the instructions of the biotin and streptavidin conjugation kit (Abcam) to conjugate biotin and streptavidin to α1-microglobulin and IgA1, respectively.
For measurement, the F(ab′)2 fragment of goat anti-human IgA (Jackson ImmunoResearch) was coated in plates (Thermo Fisher Scientific) at 4°C overnight. Then, after blocking and washing, the same amount of streptavidin-labeled IgA1 (1 μg/mL) was added into the standards wells, while 0.01 M PBS was added into the samples wells for 1 h of incubation at 37°C. After washing, standards consisting of serially diluted biotin-labeled α1-microglobulin at concentrations between 250 and 3.91 ng/mL were added to the standards wells, while plasma samples (1:4000 dilution) were added to the samples wells. After 1 h of incubation, unbound standards or plasma samples were washed and a mouse anti-human α1-microglobulin monoclonal antibody (Fitzgerald) was added and incubated for 1 h, followed by incubation with an anti-mouse IgG alkaline phosphatase antibody as a secondary antibody (Sigma-Aldrich). The plates were then developed with the alkaline phosphatase chromogenic substrate (Sigma-Aldrich). The color reaction was read by a microplate reader and the absorbance was measured at 405 nm.
Statistics
Normally distributed quantitative variables were expressed as the means and standard deviations, whereas for those with a nonnormal distribution, medians and interquartile ranges (IQRs) were used. Categorical data were summarized as absolute frequencies and percentages. For continuous variables, an unpaired Student’s t-test (two groups) or analysis of variance (multiple groups) was used if the data had a normal distribution, and if not, a Mann–Whitney U-test (two groups) or Kruskal–Wallis test (multiple groups) was performed. The Benjamini–Hochberg test was applied for the correction of multiple testing. Categorical variables were compared using the chi-squared test. The relationship between the two variables was evaluated using Spearman’s rank correlation test or Pearson’s correlation test as indicated. A two-tailed P-value <0.05 was considered statistically significant. All statistical tests were performed using SPSS version 20.0 (IBM, Armonk, NY, USA) or Stata version 15.1 (StataCorp, College Station, TX, USA).
RESULTS
Baseline demographic, clinical and pathological information
A total of 243 primary IgAN patients were recruited in our study, including the discovery IgAN cohort and the independent IgAN cohort. The main clinical and pathological characteristics of the study population are described in Table 1. At the time of renal biopsy, the average eGFR was 76.2 ± 34.5 mL/min/1.73 m2 and the median proteinuria was 1.23 g/24 h (IQR 0.50–2.61). Except for hypertension, there was no significant difference in both clinical and pathological parameters between the discovery IgAN cohort and independent IgAN cohort, which indicates comparable baseline characteristics.
Baseline characteristics of patients with IgAN
| Characteristics | Total IgAN cohort (N = 243) | Discovery IgAN cohort (n = 35) | Independent IgAN cohort (n = 208) | P-valuea |
|---|---|---|---|---|
| Demographic data | ||||
| Age (years), mean ± SD | 36.6 ± 12.3 | 36.7 ± 13.3 | 36.6 ± 12.1 | 0.963 |
| Female, n (%) | 131 (53.9) | 17 (48.6) | 114 (54.8) | 0.493 |
| Clinical data | ||||
| eGFR (mL/min/1.73 m2), mean ± SD | 76.2 ± 34.5 | 76.3 ± 39.1 | 76.2 ± 33.8 | 0.984 |
| CKD Stages 1/2/3/4–5,bn (%) | 95 (39.1)/60 (24.7)/63 (25.9)/25 (10.3) | 14 (40.0)/7 (20.0)/10 (28.6)/4 (11.4) | 81 (38.9)/53 (25.5)/53 (25.5)/21 (10.1) | 0.911 |
| 24-h UPE (g/day), median (IQR) | 1.23 (0.50, 2.61) | 1.72 (0.62, 2.83) | 1.21 (0.50, 2.55) | 0.331 |
| Hypertension,cn (%) | 96 (39.8) | 8 (22.9) | 88 (42.7) | 0.026 |
| MAPc (mmHg), mean ± SD | 94 ± 12 | 96 ± 12 | 93 ± 12 | 0.144 |
| Oxford classification,dn (%) | ||||
| M1 | 107 (44.6) | 14 (40.0) | 93 (45.4) | 0.555 |
| E1 | 87 (36.2) | 16 (45.7) | 71 (34.6) | 0.208 |
| S1 | 140 (58.3) | 23 (65.7) | 117 (57.1) | 0.338 |
| T1/T2 | 55 (22.9)/31 (12.9) | 9 (25.7)/5 (14.3) | 46 (22.4)/26 (12.7) | 0.856 |
| C1/C2 | 136 (56.7)/27 (11.2) | 20 (57.1)/3 (8.6) | 116 (56.6)/24 (11.7) | 0.850 |
SD, standard deviation; UPE, urine protein excretion; MAP, mean arterial pressure.
The P-value was used to indicate the difference between the discovery IgAN cohort and the independent IgAN cohort. A two-tailed P-value <0.05 was considered statistically significant.
CKD Stages 1–5 denote eGFR ≥90, 60–89, 30–59, 15–29 and <15 mL/min/1.73 m2, respectively, according to the Kidney Disease Outcomes Quality Initiative.
Hypertension was defined as a systolic BP ≥140 mmHg, a diastolic BP ≥90 mmHg or taking antihypertensive medications to prevent hypertension. The BP data of two patients in the independent IgAN cohort were not available.
The Oxford classification was developed by the Working Group of the International IgAN Network and the Renal Pathology Society. Mesangial hypercellularity score (M1 >0.5), the presence of endocapillary proliferation (E1: present), segmental glomerulosclerosis/adhesion (S1: present), severity of tubular atrophy/interstitial fibrosis (T1, 26–50%; T2, >50%) and the presence of a crescent (C1: present in at least one glomerulus; C2: present in >25% of glomeruli). The Oxford score of three patients in the independent IgAN cohort was unavailable because there were fewer than eight glomeruli in the pathology sections.
To explore differentiating constituents of CICs between IgAN patients and HCs
A total of 177 proteins were identified by MS in CICs derived from 50% of our recruited individuals, and 14 of them showed significantly different levels between IgAN patients and HCs after the Benjamini–Hochberg multiple testing correction. Furthermore, all 14 proteins showed higher levels in IgAN patients (PRIDE archive accession number PXD018250; Supplementary data, Table S1).
To explore key differentiating protein constituents with biological injury effects
To identify the most important constituents in CICs, we analyzed the correlation between 14 differentiating protein constituents in CICs and their biological effects on mesangial cells, including mesangial cell proliferation and inflammatory cytokine secretion. Four proteins showed significant correlations with mesangial cell proliferation. Meanwhile, all 14 protein constituents had a significant correlation with the secreted levels of at least one kind of inflammatory cytokine (MCP-1 and/or IL-6). Overall, four proteins—apolipoprotein B-100, C4b-binding protein beta chain, vitamin K–dependent protein S and α1-microglobulin—showed a significant correlation with both proliferation and inflammatory cytokine secretion by mesangial cells (Table 2). We further analyzed the correlation of these constituents with clinical and pathological parameters of patients with IgAN, including eGFR, 24-h urine protein excretion and Oxford classification (M/E/S/T/C). The result indicated that only α1-microglobulin showed a significant correlation with eGFR (r = −0.702, P < 0.001), hypertension (with versus without hypertension: 0.87 ± 0.12 versus 0.76 ± 0.12, P = 0.033) and renal tubulointerstitial lesions (Oxford T1/2 versus Oxford T0: 0.86 ± 0.12 versus 0.73 ± 0.11, P = 0.003; Table 3 and Figure 2).
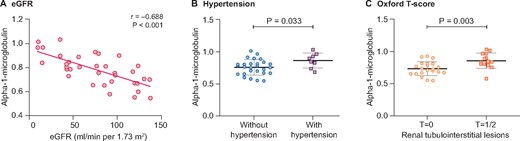
The levels of α1-microglobulin in CICs were correlated with eGFR, hypertension and tubulointerstitial lesions in patients with IgAN. (A) In patients with IgAN, the levels of α1-microglobulin in CICs, quantified by TMT labeling via MS, showed a significantly negative correlation with eGFR (r = −0.702, P < 0.001). (B) Moreover, IgAN patients with hypertension had higher levels of α1-microglobulin in CICs than patients with normal BP (0.87 ± 0.12 versus 0.76 ± 0.12, P = 0.033). (C) In addition, patients classified as Oxford T1/2 presented higher levels of α1-microglobulin in CICs compared with those with an Oxford T0 score (0.86 ± 0.12 versus 0.73 ± 0.11, P = 0.003).
Differentiating proteins in CICs that are associated with levels of proliferation and inflammatory cytokines in the mesangial cell model
| Protein | Proliferation | MCP-1 | IL-6 | |||
|---|---|---|---|---|---|---|
| r | P-value | r | P-value | r | P-value | |
| Fibrinogen α chain | 0.240 | 0.086 | 0.405 | 0.003 | −0.026 | 0.854 |
| Apolipoprotein B-100 | 0.420 | 0.002 | 0.600 | <0.001 | 0.301 | 0.030 |
| α1-microglobulin | 0.278 | 0.046 | 0.483 | <0.001 | 0.232 | 0.098 |
| Coagulation factor V | 0.246 | 0.078 | 0.539 | <0.001 | 0.321 | 0.020 |
| C4b-binding protein α chain | 0.207 | 0.141 | 0.576 | <0.001 | 0.196 | 0.164 |
| Angiotensinogen | 0.253 | 0.071 | 0.581 | <0.001 | 0.412 | 0.002 |
| Complement component C9 | 0.252 | 0.072 | 0.307 | 0.027 | 0.224 | 0.110 |
| Transthyretin | 0.214 | 0.127 | 0.349 | 0.011 | 0.281 | 0.043 |
| Heparin cofactor 2 | 0.104 | 0.461 | 0.496 | <0.001 | 0.291 | 0.036 |
| C4b-binding protein β chain | 0.358 | 0.009 | 0.514 | <0.001 | 0.124 | 0.380 |
| Carboxypeptidase N subunit 2 | 0.247 | 0.077 | 0.435 | 0.001 | 0.270 | 0.053 |
| Vitamin K–dependent protein S | 0.308 | 0.026 | 0.335 | 0.015 | 0.122 | 0.388 |
| Polymeric immunoglobulin receptor | 0.154 | 0.275 | 0.468 | <0.001 | 0.269 | 0.053 |
| Complement C5 | 0.224 | 0.111 | 0.314 | 0.023 | 0.033 | 0.819 |
The correlation analysis between differentiating proteins in CICs and clinicopathologic parameters
| α1-microglobulin | Apolipoprotein B-100 | C4b-binding protein β chain | Vitamin K–dependent protein S | |||||
|---|---|---|---|---|---|---|---|---|
| Clinical parametersa | r | P-value | r | P-value | r | P-value | r | P-value |
| eGFR | −0.702 | <0.001 | −0.302 | 0.078 | 0.049 | 0.778 | −0.261 | 0.130 |
| 24-h UPE | 0.309 | 0.071 | 0.073 | 0.675 | 0.115 | 0.511 | 0.101 | 0.565 |
| Hypertension | Relative abundancec | P-value | Relative abundance | P-value | Relative abundance | P-value | Relative abundance | P-value |
| Without hypertension | 0.76 ± 0.12 | 0.033 | 0.73 ± 0.15 | 0.426 | 0.60 ± 0.10 | 0.968 | 0.59 (0.57–0.63) | 0.409 |
| With hypertension | 0.87 ± 0.12 | 0.68 ± 0.16 | 0.60 ± 0.10 | 0.65 (0.57–0.72) | ||||
| Oxford classificationb | Relative abundance | P-value | Relative abundance | P-value | Relative abundance | P-value | Relative abundance | P-value |
| M | ||||||||
| M0 | 0.80 ± 0.14 | 0.235 | 0.73 ± 0.15 | 0.364 | 0.58 ± 0.08 | 0.229 | 0.60 (0.58–0.67) | 0.381 |
| M1 | 0.75 ± 0.11 | 0.69 ± 0.15 | 0.63 ± 0.13 | 0.58 (0.50–0.71) | ||||
| E | ||||||||
| E0 | 0.80 ± 0.14 | 0.519 | 0.68 ± 0.17 | 0.157 | 0.61 ± 0.12 | 0.567 | 0.60 (0.57–0.70) | 0.817 |
| E1 | 0.77 ± 0.11 | 0.75 ± 0.11 | 0.59 ± 0.08 | 0.59 (0.53–0.70) | ||||
| S | ||||||||
| S0 | 0.82 ± 0.10 | 0.228 | 0.73 ± 0.13 | 0.625 | 0.57 ± 0.08 | 0.231 | 0.59 (0.57–0.63) | 0.835 |
| S1 | 0.76 ± 0.14 | 0.71 ± 0.16 | 0.62 ± 0.11 | 0.60 (0.52–0.70) | ||||
| T | ||||||||
| T0 | 0.73 ± 0.11 | 0.003 | 0.68 ± 0.15 | 0.122 | 0.59 ± 0.11 | 0.511 | 0.59 (0.54–0.62) | 0.074 |
| T1/2 | 0.86 ± 0.12 | 0.76 ± 0.14 | 0.61 ± 0.08 | 0.66 (0.57–0.72) | ||||
| C | ||||||||
| C0 | 0.78 ± 0.14 | 0.853 | 0.66 ± 0.17 | 0.092 | 0.61 ± 0.15 | 0.569 | 0.59 (0.56–0.69) | 0.465 |
| C1/2 | 0.79 ± 0.12 | 0.75 ± 0.13 | 0.59 ± 0.07 | 0.62 (0.57–0.70) | ||||
Except for the correlation analyses between eGFR and three differentiating proteins (α1-microglobulin, apolipoprotein B-100 and C4b-binding protein β chain) were calculated based on Pearson’s correlation test, all the other correlation analyses between clinical parameters and differentiating proteins were calculated based on Spearman’s rank correlation test.
Oxford classification: mesangial hypercellularity score (M1 >0.5), the presence of endocapillary proliferation (E1: present), segmental glomerulosclerosis/adhesion (S1: present), severity of tubular atrophy/interstitial fibrosis (T1, 26–50%; T2, >50%) and presence of a crescent (C1: present in at least one glomerulus; C2: present in >25% of glomeruli).
Relative abundance is expressed as the mean ± standard deviation or the median (IQR).
α1-microglobulin is prone to binding with aberrant glycosylated IgA1
We prepared Gd-IgA1-sepharose (Supplementary data, Figure S1) and investigated its binding capacity with α1-microglobulin with an in vitro experiment. The results showed that α1-microglobulin could bind to both IgA1 and Gd-IgA1 in a dose-dependent manner. Meanwhile, at the same concentrations (either 0.25 or 0.5 mg/mL), Gd-IgA1 presented significantly higher α1-microglobulin-binding capacity than IgA1 (Figure 3).
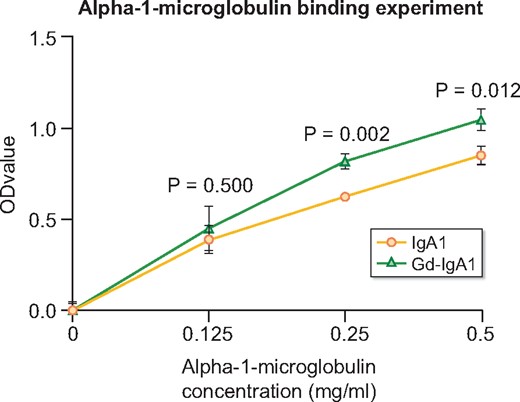
α1-microglobulin was prone to binding to Gd-IgA1. α1-microglobulin bound with both IgA1-sepharose and Gd-IgA1-sepharose in a dose-dependent manner. Compared with IgA1-sepharose, GalNAc-enriched Gd-IgA1-sepharose presented a significantly higher binding capacity with α1-microglobulin (α1-microglobulin = 0.5 mg/mL: 1.05 ± 0.06 versus 0.85 ± 0.05, P = 0.012; α1-microglobulin = 0.25 mg/mL: 0.82 ± 0.04 versus 0.63 ± 0.02, P = 0.002).
Circulating IgA-α1-microglobulin complex levels correlate with IgAN severity
Using our in-house-developed ELISA, we detected circulating IgA-α1-microglobulin complex levels in an IgAN cohort containing 208 patients as well as 51 matched controls. In addition, we also detected two other well-known biomarkers for IgANin these individuals, circulating IgA1 and Gd-IgA1. The assay for the IgA-α1-microglobulin complex was stable, with intra-assay and interassay coefficients of variation of 4.00% and 8.25%, respectively. As previously reported, we found elevated IgA1 and Gd-IgA1 in patients with IgAN (IgA1: 2.95 ± 1.19 versus 2.11 ± 0.87 mg/mL, P < 0.001; Gd-IgA1: 387.46 ± 65.94 versus 316.58 ± 61.22 U/mL, P < 0.001; Figure 4A and B). Moreover, compared with controls, patients with IgAN also had elevated levels of circulating IgA-α1-microglobulin complexes (IgA-α1-microglobulin complex: 123.00 ± 23.20 versus 88.74 ± 25.84 μg/mL, P < 0.001; Figure 4C). Furthermore, we found that circulating IgA-α1-microglobulin complex levels were significantly correlated with circulating Gd-IgA1 levels (r = 0.151, P = 0.029) but not with IgA1 levels (r = 0.081, P = 0.242).
![Elevated circulating IgA-α1-microglobulin complex, IgA1 and Gd-IgA1 levels in patients with IgAN. Circulating IgA-α1-microglobulin complex, IgA1 and Gd-IgA1 levels were elevated in patients with IgAN compared with those in HCs [(A) IgA1: 2.95 ± 1.19 versus 2.11 ± 0.87 mg/mL, P < 0.001; (B) Gd-IgA1: 387.46 ± 65.94 versus 316.58 ± 61.22 U/mL, P < 0.001; (C) IgA-α1-microglobulin: 123.00 ± 23.20 versus 88.74 ± 25.84 μg/mL, P < 0.001].](https://oup.silverchair-cdn.com/oup/backfile/Content_public/Journal/ndt/36/5/10.1093_ndt_gfaa352/1/m_gfaa352f4.jpeg?Expires=1750421224&Signature=B7fMw38llc4oi1X08VhPrQnMR8pYtG7yf~7sV8gR710EUi5aYFgjre3zzN~h8j4JMerHYZcVJ66nJTJFCJt1PMohCKT4YZvVigeua7e7QOIDviA-yvZp3CIkMTYR2lJbfzXiXR8Mn2dXdtRjv9hFXevoZZcbr3JwnCVcYl58qFBIKGXByerqjpqTfgbO4uN~5EnvCY1TNNxG-CF-gInwzhmwN4lbjhNSJGf3lIZ4Whd2vNd5jXnA7xVD4pRysCo01OFvUSwLbe6S-nnt~~AeNXWG0uefPf0FCegbifPKWEyVsn9~lfi1IMXgKlnPfXD2aobmy8v0e801gmOKN~tE0Q__&Key-Pair-Id=APKAIE5G5CRDK6RD3PGA)
Elevated circulating IgA-α1-microglobulin complex, IgA1 and Gd-IgA1 levels in patients with IgAN. Circulating IgA-α1-microglobulin complex, IgA1 and Gd-IgA1 levels were elevated in patients with IgAN compared with those in HCs [(A) IgA1: 2.95 ± 1.19 versus 2.11 ± 0.87 mg/mL, P < 0.001; (B) Gd-IgA1: 387.46 ± 65.94 versus 316.58 ± 61.22 U/mL, P < 0.001; (C) IgA-α1-microglobulin: 123.00 ± 23.20 versus 88.74 ± 25.84 μg/mL, P < 0.001].
To investigate the underlying mechanisms of the IgA-α1-microglobulin complex in IgAN, we performed receiver operating characteristics (ROC) curve analysis and calculated the area under the curve (AUC) of the IgA-α1-microglobulin complex, IgA1 and Gd-IgA1. Among the three biomarkers, the IgA-α1-microglobulin complex had the highest AUC of 0.862, which was significantly higher than that for IgA1 (0.732, P < 0.001). Gd-IgA1 showed a trend of a lower AUC than for the IgA-α1-microglobulin complex, although statistical significance was not reached (0.803, P = 0.076; Figure 5).
![ROC curve for three biomarkers—IgA1, Gd-IgA1 and IgA-α1-microglobulin complex—for the diagnosis of IgAN. (A) For the diagnosis of IgAN, the AUC for the IgA-α1-microglobulin complex was significantly higher than that for IgA1 {0.862 [95% confidence interval (CI) 0.807–0.917] versus 0.732 [95% CI 0.652–0.811]; P < 0.001}. (B) In addition, the AUC for the IgA-α1-microglobulin complex showed a higher tendency than that for Gd-IgA1, although statistical significance was not reached [0.862 (95% CI 0.807–0.917) versus 0.803 (95% CI 0.739–0.867); P = 0.076].](https://oup.silverchair-cdn.com/oup/backfile/Content_public/Journal/ndt/36/5/10.1093_ndt_gfaa352/1/m_gfaa352f5.jpeg?Expires=1750421224&Signature=B-W-5nZWFdGSOqROQhdeNj~4a~qdRrIHjG-VwxdLD7QXUH4z4lqwCZBDGhcMgf94CGmEw7p3URmq0jsC3BoSgYRcETL15YB9S0CxqcUQz3v-p2kfQV2gVNZ99yXJSxeC7q9ll88I~jcHkx3JGCCAbmuHFV-E1mprTJhThA-lxjQXrexynljYv3bfDfl7uXIBGUCYrQ7Wz7RmH~pxKZqFhMm9-bQwwkSWnVZ1F8eMESedc6DdbwOxv3jrUZU9XcPwf9yc0yMxtAr6fzYqQU1UbNZqDtZAB-z9gDdkd5kJ6l7FrfKL1w6TYImutCrZTqwF7XtL00lc0dbidK-qOsN6HA__&Key-Pair-Id=APKAIE5G5CRDK6RD3PGA)
ROC curve for three biomarkers—IgA1, Gd-IgA1 and IgA-α1-microglobulin complex—for the diagnosis of IgAN. (A) For the diagnosis of IgAN, the AUC for the IgA-α1-microglobulin complex was significantly higher than that for IgA1 {0.862 [95% confidence interval (CI) 0.807–0.917] versus 0.732 [95% CI 0.652–0.811]; P < 0.001}. (B) In addition, the AUC for the IgA-α1-microglobulin complex showed a higher tendency than that for Gd-IgA1, although statistical significance was not reached [0.862 (95% CI 0.807–0.917) versus 0.803 (95% CI 0.739–0.867); P = 0.076].
Next, we further investigated whether circulating IgA-α1-microglobulin complex levels were associated with severe clinical and pathological findings in patients with IgAN. In our recruited patients with IgAN, circulating IgA-α1-microglobulin complex levels were associated with hypertension, eGFR and Oxford T scores. IgAN patients with hypertension had significantly higher circulating IgA-α1-microglobulin complex levels than those without hypertension (127.94 ± 20.49 versus 118.94 ± 24.35 μg/mL, P = 0.006). In our patients with IgAN, the eGFR levels showed a significantly negative correlation with circulating IgA-α1-microglobulin complex levels (r = −0.282, P < 0.001). Moreover, IgAN patients classified as Oxford T1/2 presented higher circulating IgA-α1-microglobulin complex levels than those with an Oxford T0 score (129.37 ± 22.62 versus 119.42 ± 23.01 μg/mL, P = 0.003). Neither Gd-IgA1 nor IgA1 had a similar correlation with these clinical and pathological findings. For other clinical and pathological findings, including proteinuria and Oxford M/E/S/C scores, as well as the intensity of IgA and C3 deposits in glomeruli, we did not find their correlation with circulating IgA-α1-microglobulin complex, IgA1 and Gd-IgA1 levels (Table 4), except for IgAN patients with Oxford M0 presenting with higher Gd-IgA1 levels than those with Oxford M1 (P = 0.033).
Correlation analyses between circulating IgA-α1-microglobulin complex, IgA1, Gd-IgA1 levels and clinical and pathological findings
| IgA-α1-microglobulin complex | IgA1 | Gd-IgA1 | ||||
|---|---|---|---|---|---|---|
| Parameters | Concentration (μg/mL), mean ± SD | P-value | Concentration (mg/mL), mean ± SD | P-value | Concentration (U/mL). mean ± SD | P-value |
| Clinical data | ||||||
| Proteinuria stages (g/day) | ||||||
| ≤1 | 123.38 ± 23.06 | 0.657 | 3.01 ± 1.17 | 0.427 | 391.91 ± 74.92 | 0.131 |
| >1–≤3.5 | 121.53 ± 21.29 | – | 2.98 ± 1.19 | – | 391.00 ± 54.31 | – |
| >3.5 | 125.79 ± 28.29 | – | 2.70 ± 1.21 | – | 366.28 ± 65.58 | – |
| CKD stagesa | – | |||||
| Stage 1 | 117.16 ± 21.80 | <0.001 | 2.97 ± 1.45 | 0.706 | 392.18 ± 57.92 | 0.853 |
| Stage 2 | 121.05 ± 21.64 | – | 2.91 ± 1.04 | – | 386.56 ± 83.82 | – |
| Stage 3 | 129.52 ± 18.36 | – | 3.02 ± 0.97 | – | 384.86 ± 46.80 | – |
| Stage 4 | 141.76 ± 30.63 | – | 3.01 ± 0.88 | – | 386.81 ± 86.87 | – |
| Stage 5 | 114.36 ± 38.58 | – | 2.29 ± 0.81 | – | 356.37 ± 87.91 | – |
| Hypertensionb | ||||||
| Without hypertension | 118.94 ± 24.35 | 0.006 | 2.89 ± 1.11 | 0.415 | 384.25 ± 65.22 | 0.477 |
| With hypertension | 127.94 ± 20.49 | – | 3.03 ± 1.28 | – | 390.89 ± 67.47 | – |
| Pathological data | ||||||
| IgA deposition | ||||||
| 1+ | 144.08 ± 24.86 | 0.318 | 3.02 ± 1.13 | 0.350 | 431.49 ± 88.57 | 0.427 |
| 2+ | 123.74 ± 24.32 | – | 3.08 ± 1.09 | – | 396.86 ± 63.28 | – |
| 3+ | 122.19 ± 21.40 | – | 2.86 ± 1.04 | – | 384.36 ± 68.11 | – |
| 4+ | 123.59 ± 32.03 | – | 3.39 ± 2.03 | – | 386.47 ± 47.40 | – |
| C3 deposition | ||||||
| 0 | 132.31 ± 20.17 | 0.567 | 3.02 ± 1.27 | 0.915 | 404.76 ± 66.50 | 0.667 |
| 1+ | 121.33 ± 28.01 | – | 2.80 ± 1.17 | – | 406.26 ± 95.04 | – |
| 2+ | 121.39 ± 22.54 | – | 2.97 ± 1.16 | – | 379.44 ± 65.05 | – |
| 3+ | 124.47 ± 22.49 | – | 2.97 ± 1.23 | – | 388.26 ± 53.70 | – |
| Oxford classificationc | ||||||
| M | ||||||
| M0 | 123.19 ± 19.62 | 0.854 | 2.96 ± 1.10 | 0.964 | 395.77 ± 70.46 | 0.033 |
| M1 | 122.59 ± 27.20 | – | 2.96 ± 1.29 | – | 376.09 ± 59.07 | – |
| E | – | |||||
| E0 | 123.35 ± 23.54 | 0.714 | 2.90 ± 1.02 | 0.290 | 388.08 ± 64.89 | 0.715 |
| E1 | 122.09 ± 23.00 | – | 3.08 ± 1.46 | – | 384.52 ± 68.78 | – |
| S | ||||||
| S0 | 123.48 ± 24.94 | 0.766 | 2.96 ± 1.11 | 0.972 | 385.47 ± 68.32 | 0.798 |
| S1 | 122.49 ± 22.11 | – | 2.96 ± 1.25 | – | 387.87 ± 64.68 | – |
| T | ||||||
| T0 | 119.42 ± 23.01 | 0.003 | 2.91 ± 1.28 | 0.407 | 390.98 ± 70.36 | 0.225 |
| T1/2 | 129.37 ± 22.62 | – | 3.05 ± 1.00 | – | 379.21 ± 57.13 | – |
| C | ||||||
| C0 | 122.94 ± 19.41 | 0.993 | 3.04 ± 1.39 | 0.490 | 397.10 ± 57.30 | 0.131 |
| C1/2 | 122.91 ± 24.98 | – | 2.92 ± 1.09 | – | 382.08 ± 69.51 | – |
CKD Stages 1–5 denote eGFR ≥90, 60–89, 30–59, 15–29 and <15 mL/min/1.73 m2, respectively, according to the Kidney Disease Outcomes Quality Initiative.
Hypertension was defined as a systolic BP ≥140 mmHg, a diastolic BP ≥90 mmHg or taking antihypertensive medications to prevent hypertension. The BP data of two patients were not available.
Oxford classification: mesangial hypercellularity score (M1 >0.5), the presence of endocapillary proliferation (E1: present), segmental glomerulosclerosis/adhesion (S1: present), severity of tubular atrophy/interstitial fibrosis (T1, 26–50%; T2, >50%) and the presence of a crescent (C1: present in at least one glomerulus; C2: present in >25% of glomeruli). The Oxford score of three patients was unavailable because there were fewer than eight glomeruli in the pathology sections.
DISCUSSION
CICs play important roles in the pathogenesis of IgAN [27]. In this study, using TMT labeling for quantitative analysis of CICs by MS, we identified α1-microglobulin as a key constituent due to its increased levels in CICs derived from IgAN patients as well as its positive correlation with mesangial cell injury parameters. We also proved that α1-microglobulin is prone to binding IgA1 when IgA1 has aberrant O-glycosylation. In an independent IgAN cohort, we observed elevated circulating IgA-α1-microglobulin complex levels and further found its association with severe clinical and pathological findings. Our findings suggest that the IgA-α1-microglobulin complex is an important constituent of CICs and that detection of circulating IgA-α1-microglobulin complex levels is potentially clinically significant in IgAN.
IgAN is a complicated, immune-mediated disease in which CICs are considered the pivotal factor. Previous studies have revealed several important constituents in CICs derived from IgAN patients, including Gd-IgA1, antiglycan antibodies, fibronectin and C3 [10–14]. To identify key constituents of CICs, in this study we used TMT reagents for labeling and MS for simultaneous identification and quantitation. In CICs, we identified 177 proteins, underscoring the complexity of the pivotal factor for IgAN. Among them, 14 proteins showed significantly different levels between IgAN patients and controls. These differentiating proteins include immunoglobulin (polymeric immunoglobulin receptor), complement factors (C4BP, C5, C9 etc.), apolipoprotein (apolipoprotein B), coagulation factors (coagulation factor V, fibrinogen etc.), inflammatory factors (α1-microglobulin, angiotensinogen etc.) and others. These proteins were consistent with the previously reported pathogenesis of IgAN, in which the immune system, complement activation and inflammatory response were involved. It should be noted that previous studies reported the levels of antiglycan IgG antibodies were high in patients with IgAN and were correlated with worse clinical outcomes [28, 29]. However, in this study we failed to find differentiating IgG in CICs between IgAN patients and HCs. It is unclear whether the antiglycan IgG antibody binds with IgA to form CICs before the deposition in glomeruli or the IgA molecules deposit first followed by the binding of antiglycan IgG antibody. Further studies are needed to elucidate the exact mechanism of antiglycan IgG antibody in IgAN.
Since increasing evidence has shown that CICs can induce mesangial cell activation, including proliferation and cytokines excretion [30–32], we used a CIC-challenged mesangial cell model and selected mesangial cell proliferation as well as MCP-1 and IL-6 excretion as indicators to perform protein filtering for key constituents in CICs. After this filtering, four proteins remained. Furthermore, since patients with IgAN present with varied clinical and pathological manifestations, we additionally used these manifestations as the other indicators and performed the next filtering round. Among the remaining four proteins, only α1-microglobulin showed a significant correlation with eGFR, hypertension and Oxford T score.
α1-microglobulin is a 27-kDa yellow-brown lipocalin that is encoded by the AMBP gene and synthesized in the liver [33]. It is a small globular protein with reductase activity that can act as a tissue housekeeping protein by scavenging radicals, cleaning heme and repairing tissues in the physiological state [34]. We found that α1-microglobulin in patients with IgAN and α1-microglobulin in CICs is positively correlated with mesangial cell activation under CIC challenge, which suggests a potential biological injury effect of α1-microglobulin in CICs. Currently the mechanism of how α1-microglobulin in CICs induces mesangial cell activation is still unknown and needs to be investigated in future studies.
In IgAN, one specific feature is poorly glycosylated IgA1 molecules, which are prone to self-aggregation and binding with other proteins to form CICs [35]. Previous studies observed significantly increased levels of Gd-IgA1 in both Caucasian and Asian IgAN patients [10, 11]. Therefore, here we investigated the binding capacity of α1-microglobulin with IgA1 molecules with different glycosylation statuses. In our in vitro experiment, we proved that α1-microglobulin bound to aberrantly glycosylated IgA1 more efficiently than normally glycosylated IgA1, which was in accordance with our finding that CICs derived from IgAN patients had more α1-microglobulin than those from controls. Moreover, in our independent IgAN cohort, the circulating IgA-α1-microglobulin complex levels showed a positive correlation with Gd-IgA1 levels, which also supported our finding that the glycosylation change presented in IgAN patients facilitated IgA1 binding with α1-microglobulin.
Despite our finding of elevated α1-microglobulin in IgAN-derived CICs, it is still time-consuming and costly to perform TMT labeling and MS detection, therefore this approach is almost impossible for everyday clinical practice. Accordingly, we developed an in-house ELISA method for circulating IgA-α1-microglobulin level detection. This detection was less expensive than MS, simple and easy to perform and can be finished within several hours. In addition, we proved that the intra- and interassay coefficients of variation were both ˂10%, which suggested that it is a stable assay.
Thereafter, using the ELISA, we measured the circulating IgA-α1-microglobulin complex levels in an independent cohort and observed significantly higher levels of the complex in patients with IgAN than in HCs. Compared with other previously reported biomarkers for IgAN, the performance of the IgA-α1-microglobulin complex seemed to be better. Compared with that of IgA1, the AUC from ROC curve analysis of the IgA-α1-microglobulin complex was significantly higher. Although Gd-IgA1 showed a comparable value of the AUC with that of the IgA-α1-microglobulin complex, only the circulating IgA-α1-microglobulin complex levels were correlated with IgAN severity and progression-related manifestations, including eGFR, hypertension and Oxford T score. These results suggest that circulating IgA-α1-microglobulin complex detection using our in-house ELISA might serve as a potential noninvasive biomarker detection method for IgAN. Of course, validation studies in other independent populations are needed before its application in clinical practice.
In conclusion, our findings in this study suggest that the IgA-α1-microglobulin complex is an important constituent in CICs and that circulating IgA-α1-microglobulin complex detection using our in-house ELISA might be a potential noninvasive biomarker detection method in IgAN.
SUPPLEMENTARY DATA
Supplementary data are available at ndt online.
FUNDING
This work was supported by grants from the National Natural Science Foundation for Excellent Young Scholars (81922013), the National Natural Science Foundation of China (81670638, 81970598, 31670832), the National Key Research and Development Program of China (2019YFC2005000, 2016YFC0904102, 2016YFA0500301), the Training Program of the Major Research Plan of the National Natural Science Foundation of China (91642120), the Natural Science Foundation for Innovation Research Group of China (81621092), the CAMS Innovation Fund for Medical Sciences (2019-I2M-5-046) and the Beijing Natural Science Foundation (7202206). The funders had no role in study design, data collection and analysis, decision to publish or writing of the manuscript.
AUTHORS’ CONTRIBUTIONS
L.Z. conceived this study. L.Z. and H.Z. designed the study. B.X., Y.Z. and M.J. performed the experiment. Q.W., J.J. and W.L. performed the MS experiment. S.S., L.L. and J.L. recruited patients and collected the clinical data. B.X., Y.Z. and L.Z. analyzed the data. B.X., L.Z. and Q.W. wrote the manuscript. All authors have read and approved the manuscript.
CONFLICT OF INTEREST STATEMENT
None declared.


Comments