


Abstract
The advent of high-throughput sequencing technologies has led to the production of a significant amount of omics data in plants, which serves as valuable assets for conducting cross-species multi-omics comparative analysis. Nevertheless, the current dearth of comprehensive platforms providing evolutionary annotation information and multi-species multi-omics data impedes users from systematically and efficiently performing evolutionary and functional analysis on specific genes. In order to establish an advanced plant multi-omics platform that provides timely, accurate, and high-caliber omics information, we collected 7 distinct types of omics data from 6 monocots, 6 dicots, and 1 moss, and reanalyzed these data using standardized pipelines. Additionally, we furnished homology information, duplication events, and phylostratigraphic stages of 13 species to facilitate evolutionary examination. Furthermore, the integrative plant omics platform (IPOP) is bundled with a variety of online analysis tools that aid users in conducting evolutionary and functional analysis. Specifically, the Multi-omics Integration Analysis tool is available to consolidate information from diverse omics sources, while the Transcriptome-wide Association Analysis tool facilitates the linkage of functional analysis with phenotype. To illustrate the application of IPOP, we conducted a case study on the YTH domain gene family, wherein we observed shared functionalities within orthologous groups and discerned variations in evolutionary patterns across these groups. To summarize, the IPOP platform offers valuable evolutionary insights and multi-omics data to the plant sciences community, effectively addressing the need for cross-species comparison and evolutionary research platforms. All data and modules within IPOP are freely accessible for academic purposes (http://omicstudio.cloud:4012/ipod/).
Introduction
The evolutionary divergence of plant species is evident not only in the structures of their genomes but also in the genetic and epigenetic variations of homologous genes across various molecular processes, including nucleotide polymorphism, gene expression, and modification (Miao et al. 2020, 2022; Theissinger et al. 2023). With the advent of high-throughput sequencing technologies in the postgenomic era, an extensive collection of omics data has been generated in the plant kingdom. These data sets serve as valuable experimental resources for investigating the patterns of plant species evolution. However, the complete utilization of multi-omics data poses a significant challenge in the field of plant evolutionary study. Consequently, the development of an informative multi-omics platform that encompasses extensive evolutionary annotations and practical integrated analysis tools across multiple species is crucial for facilitating cross-species comparison and investigating the evolutionary implications of gene functions.
In recent years, several multi-omics integrated databases tailored to specific plant species have emerged, aiming to enhance functional genomics research through the utilization of omics data. For instance, AtMAD is an Arabidopsis multi-omics association database that facilitates the exploration of comprehensive interactions across various levels, including the genome, transcriptome, methylome, environment, pathway, and phenotype (Lan et al. 2021). CottonFGD serves as a platform that integrates diverse data sets encompassing cotton genomes, transcriptomes, and population genomes, catering to the needs of the cotton functional genomics and breeding research community (Zhu et al. 2017). RiceENCODE, functioning as an encyclopedia of DNA elements specific to rice, amalgamates data sets related to 3D chromatin interactions, histone modification, chromatin accessibility, DNA methylation, and transcriptomes data sets for rice epigenomics and functional genomic research (Xie et al. 2021). WheatOmics integrates various multi-omics data sets and provides practical toolkits to expedite functional genomics research in wheat (Ma et al. 2021). SoyOmics offers a comprehensive integration of multi-omics data sets, such as population genomes, transcriptomes, and epigenetic data, for the purpose of studying soybean functionality and molecular breeding (Liu et al. 2023). Despite the ongoing expansion and frequent utilization of these databases, the homogeneity of omics features pertaining to individual species hinders the ability to obtain a comprehensive understanding of the evolutionary implications of homologous genes.
Recently, a number of integrative databases have emerged that aim to compare and analyze omics features from multiple plant species. For instance, PODC focuses on analyzing gene expression networks of 8 plant species (Ohyanagi et al. 2015), MaGenDB provides functional genomics information for 13 Malvaceae plants (Wang et al. 2020), and ChIP-Hub offers an exploration of plant regulome and epigenome information. These databases have taken on the task of addressing the challenge of integrating and analyzing diverse omics features across different plant species (Fu et al. 2022). However, a number of emerging challenges have surfaced, including the absence of adequate platforms for integrating multi-omics knowledge and evolutionary characteristics of homologous genes, as well as the infrequent updating of these platforms with newly published omics data. These limitations impede the integration of omics sciences with the investigation of molecular evolution and function.
The objective of this study was to construct an integrative plant omics platform (IPOP) in order to investigate and elucidate the correlation between multi-omics features and evolutionary characteristics. The ultimate aim was to utilize the acquired knowledge for cross-species evolutionary analysis and gene functional research. A vast collection of recently published multi-omics data sets, encompassing population genomics, 3D genomics, epigenomics, transcriptomics, and epitranscriptomics, were comprehensively gathered from 13 representative plant species, consisting of 6 monocotyledons, 6 dicotyledons, and 1 moss. Each category of omics data sets underwent individual reanalysis using a standardized pipeline. Furthermore, we have successfully devised a range of practical online tools to facilitate the molecular evolutionary and functional analysis of putative gene families. These tools encompass omics comparison analysis, multi-omics integration analysis, transcripome-wide association analysis (TWAS), evolutionary feature annotation, phylogenetic tree construction, and basic local alignment search tool (BLAST).
Results and Discussion
Overview of IPOP
The primary structure of IPOP is depicted in Fig. 1. A multitude of recently published high-throughput sequencing data sets were gathered, encompassing various techniques such as chromatin immunoprecipitation sequencing (ChIP-seq), assay for transposase-accessible chromatin using sequencing (ATAC-seq), high-throughput technique to capture the conformation of genomes (Hi-C), Bisulfite-seq (BS-seq), RNA-seq, N6-methyladenosine (m6A)-seq, and associations identified by genome-wide association study (GWAS) of population resequencing data, from a total of 13 plant species (Table 1). Each type of data set underwent individual quality control and processing procedures through a standardized pipeline. All acquired omics knowledge was systematically integrated into IPOP to facilitate data access and visualization (http://omicstudio.cloud:4012/ipod/). Specifically, IPOP encompasses comprehensive information regarding the distribution patterns and abundance of 2,530,647 modification peaks identified from ChIP-seq data, 10,000,863 accessible chromatin regions identified from ATAC-seq data, 5,367 chromatin loops and 565 topological associating domains (TADs) identified from Hi-C data, 48,193,750 DNA 5mC methylated genes identified from BS-seq, abundance of 52,651,064 gene transcripts identified from RNA-seq, 683,022 RNA m6A methylation peaks identified from m6A-seq data, and 106,876 trait-associated SNPs identified from population resequencing data. Moreover, drawing upon this biological understanding, we have devised a range of functional modules, namely Omics-Hub, Evolutionary Genomics, Search, Browser, Tools, and Download, to facilitate users in gaining comprehensive insights into the exploration of plant biological mechanisms across multiple omics levels. These modules are elaborated upon in subsequent sections.
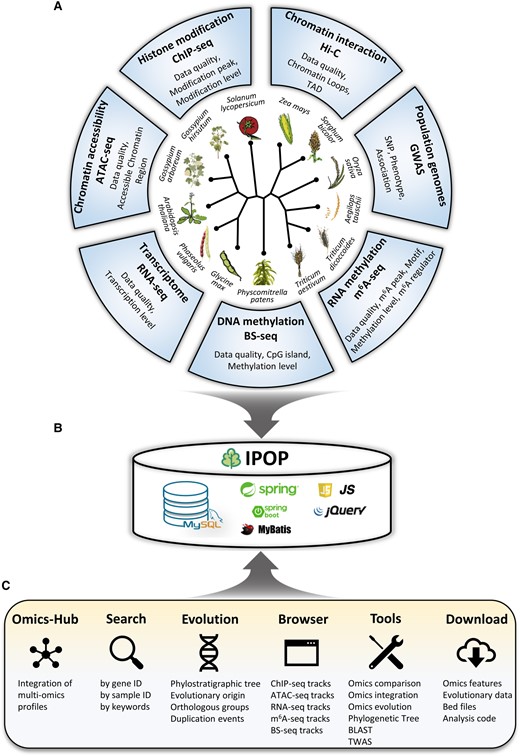
Overview of IPOP. A) Data resources included 7 types of omics data from 13 species. B) All data are stored in a MySQL relationship database with additional indexes. JavaScript and jQuery are used for front-end, and back-end programs are implemented with SpringBoot and MyBatis. C) Overview of the functional modules and usage of IPOP.
Summary of omics data sets collected in IPOP
| ChIP-seq | ATAC-seq | Hi-C | GWAS | BS-seq | RNA-seq | m6A-seq | |
|---|---|---|---|---|---|---|---|
| Arabidopsis thaliana | 168 | 255 | 16 | 42,207 | 243 | 276 | 63 |
| Gossypium arboreum | / | 2 | 1 | / | / | 99 | 3 |
| Gossypium hirsutum | 8 | 2 | 3 | / | 4 | 85 | 3 |
| Phaseolus vulgaris | 6 | 6 | / | / | 92 | 85 | 3 |
| Glycine max | 22 | 4 | / | 444 | 52 | 109 | 3 |
| Solanum lycopersicum | 36 | 2 | 9 | / | 6 | 109 | 18 |
| Sorghum bicolor | / | 2 | / | 2817 | 4 | 115 | 3 |
| Zea mays | / | 127 | / | 41,219 | 7 | 101 | 39 |
| Aegilops tauschii | 6 | 3 | / | / | 3 | 197 | 3 |
| Triticum dicoccoides | / | / | / | / | / | 135 | 3 |
| Triticum aestivum | 43 | 19 | / | / | / | 129 | 9 |
| Oryza sativa | 75 | 85 | 2 | 20,189 | 17 | 187 | 36 |
| Physcomitrella patens | / | 30 | / | / | 2 | 99 | 3 |
The Omics-Hub Module
The Omics-Hub module encompasses 7 distinct types of omics profiles, including histone modification, chromatin accessibility, chromatin interaction, DNA 5mC modification, transcriptome, RNA m6A modification, and population genomics. The web page for each individual omics profile displays the statistical information, encompassing strain names, tissues total sample count, detailed descriptions, and data quality of all experimental samples. Furthermore, users have the capability to extract a multitude of insights from the sample page associated with each omics feature. For instance, within the sample page of histone modification, users can access distribution patterns and detailed descriptions pertaining to histone modification peaks (supplementary fig. S1, Supplementary Material online). Within the sample page of chromatin accessibility, users can acquire distribution patterns and detailed descriptions concerning accessible chromatin regions (supplementary fig. S2, Supplementary Material online). The sample page of chromatin interaction provides users with information regarding chromatin loops and TADs (supplementary fig. S3, Supplementary Material online). The sample page of DNA modification allows users to access gene methylation levels in the context of CG, CHG, and CHH (supplementary fig. S4, Supplementary Material online). Additionally, the sample page of transcriptome offers users the transcriptional levels of gene transcripts (supplementary fig. S5, Supplementary Material online). The sample page of RNA modification provides users with information on m6A peak distribution, abundance, sequence motif enrichment, and the transcriptional profiles of m6A regulator candidates (supplementary fig. S6, Supplementary Material online). On the population genomics profile page, users have access to information pertaining to SNP-trait associations, including genotype, phenotype, significance of the association, and related protein-coding genes (supplementary fig. S7, Supplementary Material online). The sequencing read coverage of each omics features can be visualized through the use of a customized JBrowser. These various omics features have been integrated into their respective gene information page, which also includes evolutionary genomic annotations (supplementary fig. S8, Supplementary Material online). Additionally, we have implemented “Omics Search” function in each omics profile page, enabling users to search for the knowledge profile of a specific sample conveniently.
The Evolutionary Genomics Module
Through the utilization of genomic evolution analysis, a total of 512,106 orthologous genes, 30,454 orthologous groups (orthogroups), and 567,209 duplicate genes were identified from a pool of 612,396 protein-coding genes across 13 plant species (supplementary tables S1 and S2, Supplementary Material online). Building upon this foundation, we have developed an Evolutionary Genomics module that encompasses comprehensive knowledge pertaining to gene homology, evolutionary origins, and duplication events.
The Evolutionary Genomics module consists of 5 main components. The first part displays the basic information of the evolutionary genomics module, encompassing the count of species, phylostratigraphic stages, and orthogroups (Fig. 2A). Elaborate information can be acquired by either hovering over or clicking on the specific statistical values. The subsequent component of the module encompasses a phylostratigraphic tree, which visually represents the evolutionary stages of orthologous genes (Fig. 2B). By hovering over or clicking on the label associated with a phylostratigraphic stage, users can access the corresponding speciation time and information page (supplementary fig. S9, Supplementary Material online). The third section presents a stacked bar chart illustrating the distribution of orthogroups across different phylostratigraphic stages (Fig. 2C). Each orthogroup is associated with a profile page that provides diverse relevant information (supplementary fig. S10, Supplementary Material online). The fourth section provides a summary of the number of orthologous genes, orthogroups, and phylostratigraphic stages for each species (Fig. 2D). The fifth section presents the breakdown of duplication events in each species (Fig. 2E). For more detailed information on these evolutionary features, users can access the corresponding bars by clicking on them. Finally, users are able to conveniently retrieve the information pertaining to specific orthologous genes, orthogroups, phylostratigraphic stages, and duplication events through the utilization of the “Search” function integrated within the Evolutionary Genomics page.
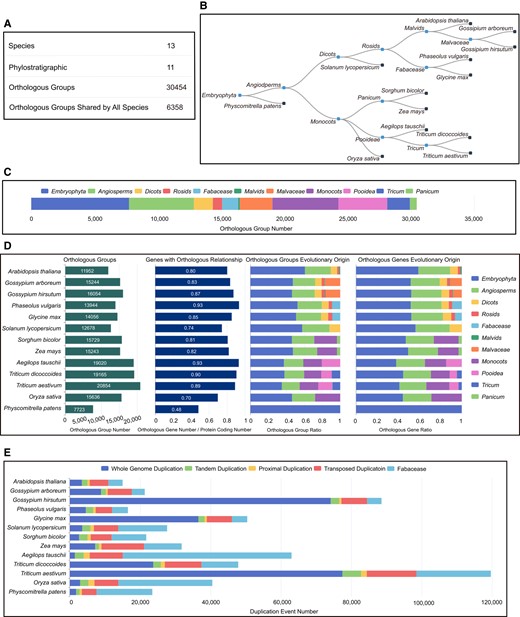
The main structure of evolutionary genomics modules. A) Basic information of the evolutionary genomics module. B) Phylostratigraphic tree. C) Number of orthogroups in each phylostratigraphic stage. D) Statistics of orthologous genes and groups in each species. E) Statistics of duplication events in each species.
Tools for Integrative Analysis of Multi-omics and Evolution
With the objective of facilitating the investigation of cross-species evolution and gene functionality, we have developed a range of online tools. These tools enable users to investigate and interpret the associations between multi-omics data and evolutionary characteristics. Primarily, the BLAST tool (Version 2.12.0) (Camacho et al. 2009) is employed to identify homologous genes of interest, and the outcomes are presented in a downloadable tabular format (Fig. 3A). The Phylogenetic Tree Construction tool embedded FastTree (Version 2.1.11) (Price et al. 2009) facilitates the construction of evolutionary trees for the purpose of investigating the evolutionary mechanisms of gene families (Fig. 3B). The Evolutionary Information Annotation tool offers additional pertinent evolutionary data, including orthogroup statistics (Fig. 3C), phylostratigraphic stage (Fig. 3D), and duplication events (Fig. 3E), which can be accessed by hovering over or clicking on the respective bars. Furthermore, the Omics Comparison Analysis tool and Multi-Omics Integration Analysis tool are available to enable functional analysis of gene families. The Omics Comparison Analysis tool conducts statistical analysis and identifies differences in various samples of omics data. The tool presents overlapped and unique peaks in a bar graph format (Fig. 3F). The differences in expression and modification levels are calculated using DESeq2 (Version 1.30.1) (Love et al. 2014) and CGmapTools (Guo et al. 2018), visualized by volcano maps (Fig. 3G). The Multi-Omics Integration Analysis tool combines different omics data using BEDTools (Version 2.30.0) (Quinlan and Hall 2010) to facilitate the identification of significant areas and provide contextual information (Fig. 3H). Lastly, the Transcriptome-wide association analysis tool based on FUSION (Gusev et al. 2016) establishes correlations between gene expression levels and phenotypic variation, thereby enhancing the functional investigation of gene families (Fig. 3I).
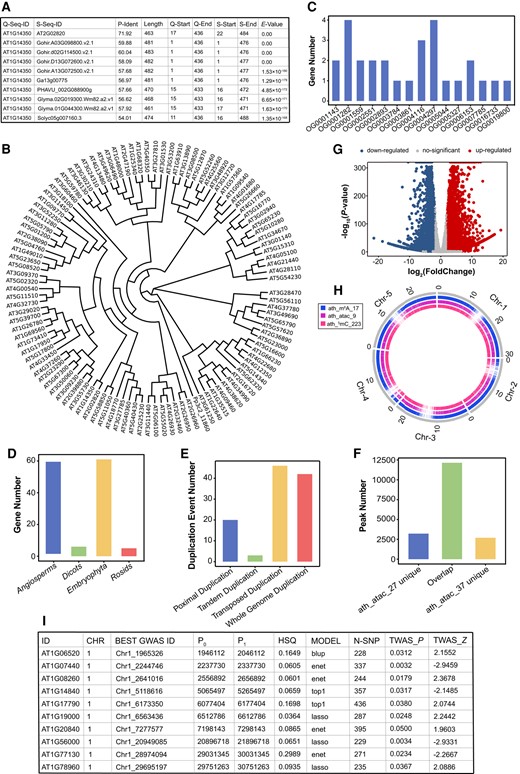
The results of running the tools of IPOP. A) Result of Basic Local Alignment tool. Hover at the top of the table to see each column of definitions. Q-Seq-ID, query sequence ID; S-Seq-ID, subject sequence ID; P-Ident, percentage of identical matches; length, alignment length; Q-Start, start of alignment in query; Q-End, end of alignment in query; S-Start, start of alignment in subject; S-End, end of alignment in subject; E-value, expected value. B) Result of Phylogenetic Tree Construction tool. Physcomitrella patens gene Pp3c2_11860 was used as an outgoup. C–E) Results of Evolutionary Information Annotation tool. C) Statistics of the gene number for each orthogroup in the input data set. D) Statistics of gene evolutionary origin. E) Statistics of related duplication events. F) and G) Results of Omics Comparison Analysis tool. F) Statistics on the overlapped and unique peaks. G) Volcanic maps for differentially expressed genes. H) Result of Multi-omics Integration Analysis tool. I) Result of Transcriptome-wide Association Analysis tool. Hover at the top of the table to see each column of definitions. ID, gene identifier; CHR, chromosome; Best Gwas ID, rsID of the most significant GWAS SNP in locus; P0, gene start; P1, gene end; HSQ, heritability of the gene; MODEL, best performing model; N-SNP, number of SNPs in the locus; TWAS_P, TWAS P-value; TWAS_Z, TWAS Z-score.
Search, Browser, Download, User Manual, and Feedback Modules
IPOP offers various modules aimed at enhancing user efficiency, which can be accessed through buttons located in the top sidebar. The Search module facilitates comprehensive data exploration within the database by allowing users to search using gene ID, sample ID, and keyword inputs. The result page showcases sample statistics associated with the search keywords, and users can access detailed sample information by simply clicking on the provided links (supplementary fig. S11A, Supplementary Material online). The Browser module serves as a repository for sample coverage and genome information pertaining to 13 distinct species, offering visualization capabilities (supplementary fig. S11B, Supplementary Material online). Additionally, the Download module grants users access to all omics result files (supplementary fig. S11C, Supplementary Material online). The user manual, accessible on the home page, provides instructions on the efficient utilization of IPOP. Additionally, the Contact page incorporates a feedback module, which facilitates the submission of feedback and enables users to establish communication with our team at their convenience (supplementary fig. S11D, Supplementary Material online).
Application of IPOP in Evolutionary Genomics Study
The m6A modification is the most prevalent RNA modification observed in cellular systems (Jiang et al. 2021). The YTH domain, which is highly conserved, has been identified as the gene family responsible for reading m6A modifications in various species. This gene family plays a critical role in deciphering the m6A modifications present in RNA molecules (Zhang et al. 2010). To illustrate the functionality and utility of IPOP, we conducted an evolutionary analysis of the YTH domain gene family. Initially, we employed the BLAST tool to align 13 known YTH domain genes from Arabidopsis in order to identify homologous genes in 12 other species. This search yielded a total of 166 YTH domain genes (supplementary table S3, Supplementary Material online), which were classified into 2 subfamilies (YTH-DC and YTH-DF), consistent with previous reports (Scutenaire et al. 2018). We constructed a phylogenetic tree for the 166 candidates using the Phylogenetic Tree Construction tool and annotated the evolutionary information using the Evolutionary Information Annotation tool. Figure 4A demonstrates that all members were assigned to 7 orthogroups and further divided into 3 phylogenetic clades: Clade I (OG0014009 and OG0007584), Clade II (OG0011256 and OG0001792), and Clade III (OG0006668, OG0006753, and OG0001785). We conducted further analysis on the evolutionary origin of these orthogroups (Fig. 4B) and identified 3 phylostratigraphic stages (Embryophyta, Angiosperms, and Monocots). Significantly, the orthogroups derived from Embryophyta and Angiosperms exhibited evolutionary variability, with certain members undergoing the loss of the YTH domain throughout the course of evolution. Conversely, the OG0011256 group originating from Monocots displayed a greater degree of evolutionary conservation. Additionally, our observations revealed that the duplication events basically covered all members of the YTH domain gene family (Fig. 4A), primarily driven by whole-genome duplication (WGD) and subsequently transposed duplication (Fig. 4C), thereby facilitating the expansion and evolutionary progression of the YTH domain gene family. For all WGD pairs, the 2 couples were distributed in the same clade and belonged to the same orthogroups, demonstrating the evolutionary conservation in phylogeny (Fig. 4D).
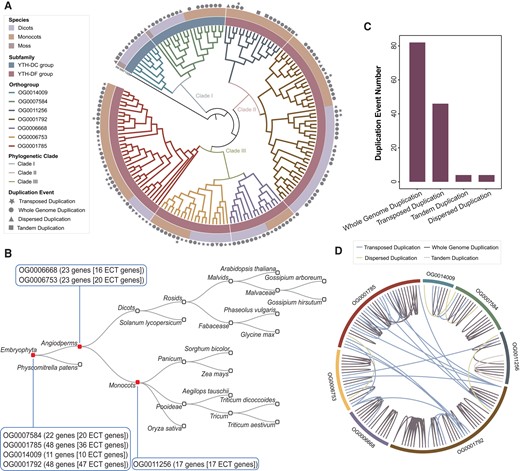
Evolutionary analysis of YTH domain gene family. A) Phylogenetic tree of YTH domain gene family, using Chondrus crispus gene XM_005713289 as outgroup. B) Statistics of gene duplication events in YTH domain gene family. C) Statistics of YTH domain gene number and phylostratigraphic stage for each orthogroup. D) Gene duplication relationships among orthogroups of YTH domain genes.
Following the construction of phylogenetic trees for each orthogroup of YTH domain genes, we proceeded to compare the evolutionary patterns among them (supplementary fig. S12, Supplementary Material online). Within Clade I, the OG0007584 group covered both monocotyledonous and dicotyledonous genes; however, the monocotyledonous genes were absent from the OG0014009 group. In Clade II, the groups OG0011256 and OG0001792 exhibited distinct gene retention patterns in dicotyledonous species, wherein OG0011256 covered all dicotyledonous members while the dicotyledonous members were absent in the OG0011256 group. Conversely, in the context of monocotyledonous species, the OG0011256 and OG0001792 groups displayed similar patterns, as evidenced by the consistent retention of YTH domain genes in Aegilops tauschii, Sorghum bicolor, Triticum dicoccoides, and Triticum aestivum. In Clade III, the evolutionary patterns of the OG0006668 and OG0006753 groups exhibited similarities across monocotyledonous and dicotyledonous species. This similarity was observed in Arabidopsis thaliana, Solanum lycopersicum, Glycine max, Ae. tauschii, Oryza sativa, Triticum dicoccoides, and Triticum aestivum, where the number of members in these groups remained consistent. In contrast, the OG0001792 group displayed a distinct gene retention pattern compared with the OG0006668 and OG0006753 groups in most species. However, it is noteworthy that these 3 orthogroups shared the absence of Malvaceae genes, which diverged from other orthogroups. In conclusion, despite belonging to the same phylogenetic clade, members of orthogroups in different species exhibit significant divergence in evolutionary patterns, potentially leading to functional differentiation of YTH domain genes.
Application of IPOP in Functional Genomics Study
To explore the functional disparities among these orthologous groups, we employed the Search module to retrieve multi-omics features for the YTH domain gene family and conducted statistical analysis on the shared species within each clade.
In Clade I, the orthogroups OG0014009 and OG0007584 exhibited comparable expression and modification patterns in dicots, but displayed divergent expression levels in A. thaliana and Phaseolus vulgaris, divergent m6A abundance in G. max, and divergent H3K4me3 modification levels in S. lycopersicum (supplementary table S4, Supplementary Material online). Both orthogroups were annotated with RNA splicing-related gene ontology (GO) terms (supplementary fig. S13A, Supplementary Material online). In Clade II, the expression and modification patterns of OG0011256 and OG0001792 differed significantly (supplementary table S4, Supplementary Material online). Specifically, OG0001792 exhibited higher expression and m6A modification levels compared with OG0011256 in monocot species. The genes implicated in the 3D chromatin architecture were detected within OG0001792, while they were absent in OG0011256. Within OG0001792, the AT3G03950 gene was observed to reside within a topologically associating domain, exhibiting significant interactions with other regions of the TAD (Fig. 5A). Furthermore, the AT3G13460 and AT1G55500 genes were identified within chromatin loops (supplementary fig. S14A and B, Supplementary Material online). Notably, the AT3G13460 gene was found to harbor a variant associated with protist disease resistance (supplementary fig. S15, Supplementary Material online). Additionally, our findings indicate that the functional annotations of OG0001792 and OG0011256 primarily pertain to cell metabolism processes. Moreover, these 2 orthogroups also exhibit stress response functions (Fig. 5B), suggesting their potential significance in plant resistance to external stress and the maintenance of normal plant life activities. In Clade III, the expression and modification patterns of OG0001785, OG0006668, and OG0006753 were significantly varied in over half of the species (supplementary table S4, Supplementary Material online). Notably, among these 3 orthogroups, only the AT3G13060 gene of OG0001785 was found to be involved in a chromatin-loop architecture (supplementary fig. S14C, Supplementary Material online). The Arabidopsis gene variations observed in OG0006753 and OG0001785 were found to be associated with the plant's adaptation to specific growth conditions. Additionally, the maize gene Zm00001d002372 in OG0001785 was found to have an impact on various traits such as kernel row number per ear, leaf length, and days to flowering (Fig. 5C). The maize genes belonging to Clade III exhibited high expression levels specifically in tissues undergoing active growth and development, such as spikelet, root, and tassel (Fig. 5D). This observation suggested a potential relationship between the YTH domain genes in Clade III and plant growth and development. Furthermore, all 3 orthogroups were annotated with functions related to mRNA destabilization (supplementary fig. S13B, Supplementary Material online).
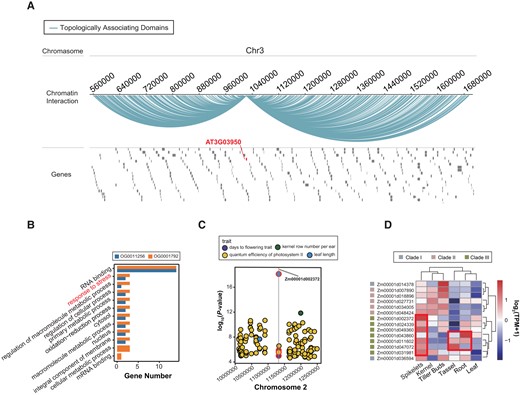
Function analysis of YTH domain gene family. A) Topologically associating domain related to the AT3G03950 gene of OG0001792. B) GO terms statistics of OG0011256 and OG0001792. C) Significant variants–trait associations. Points marked with red circles indicate variant–trait associations related to Zm00001d002372 gene in OG0001785. Gray lines indicate Zm00001d002372 gene location. D) Tissue-specific expression profiles of maize YTH domain genes.
Overall, it is apparent that diversification exists among orthogroups within the same clade in terms of both evolutionary patterns and functions. Even among species with similar evolutionary patterns, there are discernible variations in expression and modification patterns. Nevertheless, despite the shared functions of orthogroups within the same clade in the YTH domain gene family, notable distinctions have arisen, thereby enriches the role of the YTH domain gene family in plants.
Conclusions and Prospects
In this study, we present the introduction of IPOP, an integrated plant multi-omics platform that facilitates evolutionary and functional investigations. IPOP encompasses 7 distinct types of omics data and offers comprehensive evolutionary characteristics of 13 species, presented through diverse visual representations and accessible to users. Additionally, it incorporates numerous online tools to provide services for functional and comparative genomic analysis. Despite the incomplete coverage of certain species within the omics data, IPOP surpasses existing multi-omics databases by encompassing a broader spectrum of omics data, facilitating a more extensive comprehension of evolutionary processes, bridging the gaps within the angiosperms family, and offering substantial support for scientific research endeavors (Table 2). In forthcoming endeavors, we aim to overcome these limitations by augmenting the number of species included in our database, thereby enabling more comprehensive comparative genomics research and fostering a more profound understanding of evolutionary phenomena. In order to enhance the comprehensiveness of IPOP, we intend to augment the range of omics data by incorporating translation, protein, metabolic, and other relevant omics data. Furthermore, we will consistently update the platform's contents and promptly supplement it with the most recent multi-omics data. Consequently, IPOP will serve as a proficient platform for scientists engaged in evolutionary and functional genomics research.
Data comparison of IPOP and other databases
| Species | IPOP (this study) | GERDH (Cheng et al. 2023) | ChIP-Hub (Fu et al. 2022) | MaGenDB (Wang et al. 2020) | PODC (Ohyanagi et al. 2015) | |
|---|---|---|---|---|---|---|
| 1 moss 6 Dicots 6 Monocots | 40 Horticultural plants | 43 plants | 13 Malvaceae | 1 Magnoliatae 5 Dicots 2 Monocots | ||
| Raw data | Transcriptome | 1,726 | 12,856 | / | 280 | 745 |
| Histone modification | 364 | 21 | 4,403 | 40 | / | |
| Chromatin accessibility | 537 | / | 1,263 | 10 | / | |
| Chromatin interaction | 31 | / | / | / | / | |
| DNA 5mC modification | 430 | 63 | / | 4 | / | |
| RNA m6A modification | 189 | 18 | / | / | / | |
| Population genomics | 931 | / | / | / | / | |
| Transcription-factor families | / | / | 2,994 | / | / | |
| Cap analysis of gene expression | / | / | / | 16 | / | |
| Evolutionary information | Duplicate event | √ | / | / | / | / |
| Phylostratigraphic stage | √ | / | / | / | / | |
| Orthologous groups | √ | √ | / | / | √ | |
Materials and Methods
Data Collection and Preprocessing
The data sources and download links regarding the reference genomes and gene annotations of 13 plant species (A. thaliana, Gossypium arboretum, Gossypium hirsutum, P. vulgaris, G. max, S. lycopersicum, Sor. bicolor, Zea mays, Ae. tauschii, Triticum dicoccoides, Triticum aestivum, O. sativa, and Physcomitrella patens) are listed in supplementary table S5, Supplementary Material online. Raw omics data sets were obtained from the NCBI Sequence Read Archive (http://www.ncbi.nlm.nih.gov/sra) and the National Genomics Data Center (NGDC) (CNCB-NGDC Members and Partners 2023). To eliminate sequencing adapters and low-quality reads, the Fastp tool was employed (Version 0.20.1) (Chen et al. 2018) (fastp -5 -3 -r -n 0 -e 20 --trim_poly_x --poly_x_min_len 15). Quality control reports were consolidated using MultiQC (Version 1.10.1) (Ewels et al. 2016).
Histone Modification Data Analysis
The alignment of sequencing reads to the reference genomes was performed using BWA-MEM (Version 0.7.17) (Li 2013) (bwa mem -M -I 200,200,5000). SAMtools (Version 1.7) (Danecek et al. 2021) was utilized to obtain high-quality reads (samtools view -b -h -F 4 -F 8 -F 256 -F 1024 -F 2048 -q 30) and sort the resulting BAM files (samtools sort). The removal of duplicated reads was accomplished using the Picard Toolkit software (Version 2.26.9) (“Picard Toolkit” 2019, Broad Institute, GitHub Repository. https://broadinstitute.github.io/picard/; Broad Institute) (picard MarkDuplicates). Peak calling was conducted using the MACS2 software (Version 2.1.2) (Zhang et al. 2008) (--nomodel --shift 73 -B --qvalue 0.01). The calculation of read coverage was carried out using DeepTools (Version 3.5.1) (Ramírez et al. 2016) (bamCoverage --binSize 25 --normalizeUsing RPGC). The annotation of the identified peaks was performed using the ChIPseeker R package (Version 1.30.3) (Yu et al. 2015). Lastly, the calculation of peak abundance was executed using the DiffBind R package (Version 3.4.11) (Ross-Innes et al. 2012), employing the formula (mapped fragmentsIP × total mapped fragmentsInput)/(mapped fragmentsInput × total mapped fragmentsIP).
Chromatin Accessibility Data Analysis
The read alignment processing strategy for chromatin accessibility data sets aligns with that of histone modification data sets, with slight variations in the parameter settings of MACS2 (Version 2.1.2) software for peak calling (macs2 callpeak --nomodel --shift -100 --extsize 200 --keep-dup all -B --qvalue 0.01). The Picard Toolkit was employed to calculate insert sizes (Version 2.26.9) (picard CollectInsertSizeMetrics), while DeepTools (Version 3.5.1) was utilized to compute scores for genome regions (computeMatrix -b 2000 -a 2000 --skipZeros) and visualize the distribution characteristics of read segments (plotProfile --perGroup).
Chromatin Interaction Data Analysis
The genome size was determined through the utilization of SAMtools (Version 1.7). HIC-Pro (Version 3.1.0) (Servant et al. 2015) was employed to generate enzyme fragment files (digest_genome.py) and interaction matrices, utilizing default parameters. Juicer (Version 1.6) (Durand et al. 2016) utilized to identify TAD regions (juicer_tools.jar arrowhead -m 500 -r 5000,10000 -k KR) and loop regions (juicer_tools.jar hiccups -m 500 -r 5000,10000 -f 0.1,0.1 -p 4,2 -i 7,5 -d 20000,20000).
DNA 5mC Modification Data Analysis
Bismark (Version 0.23.1) (Krueger and Andrews 2011) was employed to align clean reads to the reference genomes, utilizing default parameters. CGmapTools software (Version 0.1.2) (Guo et al. 2018) was utilized to convert BAM files into CGmap files. The calculation of read coverage was performed using DeepTools (Version 3.5.1), utilizing default parameters. MethGo software (Liao et al. 2015) was utilized to determine the global and gene-centric cytosine methylation levels, as well as the coverage distribution of each cytosine.
Transcriptome Data Analysis
The clean reads were aligned to the reference genomes using the HISAT2 software (Version 0.7.17) (hisat2 -k 5 --max-intronlen) (Kim et al. 2015). SAMtools software (Version 1.7) was employed to extract high-quality reads (samtools view -F 1796 -q 30) and organize the resulting BAM files. For quantitative analysis of transcriptome expression, the StringTie software (Version 2.1.7) (Pertea et al. 2016) and featureCounts (Version 2.0.1) (Liao et al. 2014) (featureCounts -p -t exon -g gene_id) were utilized.
RNA m6A Modification Data Analysis
The clean reads were aligned using the HISAT2 software (Version 0.7.17) (hisat2 -k 5 --max-intronlen). The resulting BAM files were sorted using the SAMtools software (Version 1.7), and the high-quality reads were extracted utilizing samtools view (samtools view -F 1796 -q 30). To authenticate m6A peaks, the slidingwindow model in the R package PEA (Zhai et al. 2018) was applied with default options. Additionally, StringTie (Version 2.1.7) was employed to calculate the gene TPM levels (Transcripts Per Kilobase per Million mapped) in input samples using default parameters. The IRanges R package (Lawrence et al. 2013) was utilized for the purpose of merging peaks (only peaks supported by more than 2 replicates are kept as confidence m6A peaks). Finally, the DiffBind package (Version 3.4.11) was employed to calculate the peak abundance using the formula (mapped fragmentsIP × total mapped fragmentsInput)/(mapped fragmentsInput × total mapped fragmentsIP).
GWAS Analysis
The population genomic data sets were obtained from the AraGWAS database (https://aragwas.1001genomes.org/) (Togninalli et al. 2018) and GWAS Atlas database (https://ngdc.cncb.ac.cn/gwas/) (Tian et al. 2020). GWAS analysis was conducted using GEMMA (Version 0.98.3) (Zhou and Stephens 2014).
TWAS Data Analysis
The data sets comprised 3 maize populations (Hirsch et al. 2014; Leiboff et al. 2015; Gui et al. 2020) and 1 Arabidopsis population (1001 Genomes Consortium 2016). In terms of genotype data, the [aa, Aa, AA] gene types were converted to [−1,0,1] and the VCFtools software (Version 0.1.16) (Danecek et al. 2011) was utilized to filter out SNPs with a minor allele frequency below 5% (vcftools --max-missing 0.95 --maf 0.05 --recode --recode-INFO-all). Quality control for gene expression data was conducted using FastQC (Version 0.11.5) and Trimmomatic (Version 0.39) (Bolger et al. 2014) (trimmomatic-0.36.jar LEADING:20 TRAILING:20 SLIDINGWINDOW:4:20 MINLEN:20). The alignment of clean reads to the reference genomes was performed using STAR (Version 2.7.3) (Dobin et al. 2013) (STAR --outSAMtype BAM SortedByCoordinate --outFilterMultimapNmax 1 --outSAMstrandField intronMotif --twopassMode Basic). Unique mapped reads were extracted using Samtools (Version 1.7). Transcript expression was quantified using StringTie (Version 2.1.7) with default parameters, and transcripts with a TPM > 1 in at least 5 samples were filtered out. Predictive expression models were constructed and TWAS analysis was conducted using Fusion software (Gusev et al. 2016).
Evolutionary Genomic Annotations
The construction of orthologous gene groups was carried out using OrthoFinder (v.2.4.0) (Emms and Kelly 2019) with default parameters, utilizing the protein-coding genes from 13 species. In this process, the longest protein sequence was chosen for identification when multiple isoforms were present for a particular gene. The similarity relationships between protein sequences were determined using DIAMOND (v.0.9.24) (Buchfink et al. 2015); and the clustering of genes into orthogroups was accomplished using the MCL graph clustering algorithm (Van Dongen 2008). The summary of orthologous gene annotations for each species is listed in supplementary table S2, Supplementary Material online.
The construction of the phylostratigraphic tree of orthologous genes was carried out using TimeTree (Kumar et al. 2017), following the methodologies outlined in previous research (Domazet-Loso et al. 2007; Guo 2013; Lei et al. 2017). As shown in supplementary table S6, Supplementary Material online, the orthologous genes were assigned to different phylostratigraphic stages representing different evolutionary ages.
Furthermore, the classification of orthologous genes into 4 duplication types (WGD, tandem duplication, proximal duplication, and transposed duplication) was performed using DupGen_finder (Qiao et al. 2019) utilizing the default parameters.
Platform Implementation
The data in IPOP were stored and managed using MySQL (https://www.mysql.com/) database management system. The IPOP was specifically designed to transfer data and results through a front-end web interface written in Java (https://www.java.com/) and JavaScript (https://www.javascript.com/) with Vue.js (https://vuejs.org/) and JQuery.js (https://jquery.com/) frameworks and back-end programs implemented with SpringBoot (https://spring.io/projects/spring-boot/), SpringMVC (https://spring.io/projects/spring-webflow), and MyBatis (https://blog.mybatis.org/). The IPOP was deployed on a Linux-based (https://www.linux.org/) Nginx web server powered with the Ali cloud (https://hk.alibabacloud.com/) computing platform.
Supplementary Material
Supplementary material is available at Molecular Biology and Evolution online.
Acknowledgments
We thank High-Performance Computing (HPC) of Northwest A&F University for providing computing resources.
Author Contributions
Z.M. and C.M. conceived the project; W.H. and X.H. collected and processed the omics data; W.H., X.H., Y.R., and M.S. designed and built the IPOP website; Z.M. and W.H. wrote the manuscript. All authors read, critically revised, and approved the final manuscript.
Funding
This work was supported by the National Natural Science Foundation of China (32000410, 32370723, and 32170681).
Data Availability
All data analyzed during this study are included in the IPOP database (http://omicstudio.cloud:4012/ipod/).
References
4
Author notes
Wenyue Huang and Xiaona Hu contributed equally to this work.
Conflict of interest statement. The authors declare no competing financial interest.
