


Abstract
It is desirable to estimate a tree of life, a species tree including all available species in the 3 superkingdoms, Archaea, Bacteria, and Eukaryota, using not a limited number of genes but full-scale genome information. Here, we report a new method for constructing a tree of life based on protein domain organizations, that is, sequential order of domains in a protein, of all proteins detected in a genome of an organism. The new method is free from the identification of orthologous gene sets and therefore does not require the burdensome and error-prone computation. By pairwise comparisons of the repertoires of protein domain organizations of 17 archaeal, 136 bacterial, and 14 eukaryotic organisms, we computed evolutionary distances among them and constructed a tree of life. Our tree shows monophyly in Archaea, Bacteria, and Eukaryota and then monophyly in each of eukaryotic kingdoms and in most bacterial phyla. In addition, the branching pattern of the bacterial phyla in our tree is consistent with the widely accepted bacterial taxonomy and is very close to other genome-based trees. A couple of inconsistent aspects between the traditional trees and the genome-based trees including ours, however, would perhaps urge to revise the conventional view, particularly on the phylogenetic positions of hyperthermophiles.
Introduction
As a number of genome projects produced the complete genome sequences for various species, genome-wide information has been employed to construct a genome tree for inferring evolutionary relationship of species. Accordingly, several methods for constructing a genome tree have been invented. Some authors compared the whole genomes with respect to the gene contents (Fitz-Gibbon and House 1999; Snel et al. 1999; Tekaia et al. 1999; Wolf, Rogozin, Grishin, et al. 2001; Korbel et al. 2002) to the domain contents (Gerstein 1998; Wolf et al. 1999; Lin and Gerstein 2000; Caetano-Anolles G and Caetano-Anolles D 2003; Winstanley et al. 2005; Yang et al. 2005), to the gene order (Wolf, Rogozin, Kondrashov, Koonin 2001; Korbel et al. 2002), or to the total evolutionary distances between a pair of orthologs (Wolf, Rogozin, Grishin, et al. 2001; Clarke et al. 2002), others dealt with multiple genes by concatenating the aligned sequences (Hansmann and Martin 2000; Brown et al. 2001; Katoh et al. 2001; Wolf, Rogozin, Grishin, et al. 2001), and still others synthesized a compound tree by uniting multiple trees constructed from individual genes (Daubin et al. 2001).
In the pregenome era, we used to construct phylogenetic trees for individual genes or proteins, which have greatly contributed to elucidating unknown, unclear, or controversial phylogenetic positions of a number of species and populations. Unfortunately, however, trees constructed for different genes or proteins are often mutually incompatible (Wolf et al. 2002; Bapteste et al. 2004). The reasons for this could be due to imperfectness of a tree-construction method, stochastic nature of nucleotide substitution, polymorphism in a common ancestral population, horizontal gene transfer (HGT), and/or nondiscrimination of paralogous from orthologous genes. The primary reason, however, lies in the fact that most of the constructed trees are gene trees (Tateno et al. 1982) and not species trees. Because not all genes have evolved consistently with their host species owing to some of the biological factors mentioned above, a gene tree is sometimes inconsistent with the way the species in question have evolved. One way to resolve the inconsistency between the gene and species trees is to use as many genes in a genome as possible (Tateno et al. 1982). It has been reported that the more genes we use, the less influence we suffer from the disturbances mentioned and the closer we can reach the correct tree (Rokas et al. 2003). It is thus desirable to use the entire and pertinent information on the whole genome, if we dare to construct a species tree as a first approximation of the evolutionary relationship of species.
Here, we report a new method for constructing a species tree based on protein domain organizations. We determine domain organization of each protein by the sequential order of the domains in the protein, and then define a repertoire of protein domain organizations of an organism as a set of domain organizations of all proteins encoded in its genome. By using difference of the repertoires among species, a species tree is constructed. Proteins with the same domain organization are roughly regarded as homologous over their total length. Therefore, our method compares the whole genomes with respect to homologous gene contents by the medium of protein domains. Because our method is based not only on the contents of domains but also their order along the primary structure in each protein, it treats more detailed aspects of evolution than the methods based on the domain contents alone (Winstanley et al. 2005; Yang et al. 2005). Moreover, like the domain content methods, our method does not require an orthologous gene set of the species studied for which numerous complicated and burdensome procedures are unavoidable. Applying our method to 17 archaeal, 136 bacterial, and 14 eukaryotic organisms, we have constructed a tree of life that is quite consistent with the taxonomy widely accepted today. We then discuss consistent and inconsistent aspects between our tree and the traditional tree focusing particularly on the phylogenetic positions of hyperthermophiles.
Materials and Methods
Protein Domains
We used the Protein families database of alignments and HMMs (Hidden Markov Models) (Pfam) (Bateman et al. 2004) version 11.0 to assign the Pfam domains to the open reading frame (ORF) sequences in the Genomes TO Protein structures and functions (GTOP) database (Kawabata et al. 2002) as of May 2004 (ftp://spock.genes.nig.ac.jp/pub/gtop/Old_04Jul/). GTOP contains all ORFs of the organisms for which the whole-genome sequence has been reported or the complete set of cDNA clones is sequenced. The Pfam domains were assigned for the ORFs by HMM (Durbin et al. 1998) using GA (gathering cutoffs) scores recorded for individual protein families (Eddy 2003). Assignment of the Structural Classification of Proteins (SCOP) superfamily domains was also carried out by applying reverse PSI-Blast (position specific iterative Blast [Basic Local Alignment Search Tool]) (Altschul et al. 1997) to the SCOP database (Murzin et al. 1995) version 1.65. The cutoff e value was 10−3.
We primarily adopted the Pfam domains for construction of a repertoire of protein domain organizations. Although the SCOP domains have been commonly used in the domain contents methods (Gerstein 1998; Wolf et al. 1999; Lin and Gerstein 2000; Caetano-Anolles G and Caetano-Anolles D 2003; Winstanley et al. 2005; Yang et al. 2005), we supposed that the Pfam domains were more suitable to the present study for the following 2 reasons. First, the Pfam domains are defined by sequence conservation and have clear evolutionary relationship, which is important to phylogenetic analysis. Second, the Pfam domains are more extensively assigned to the ORF regions and are expected to bring out more information from genome sequences than the SCOP domains: the former covered 50.5% of the ORF regions, whereas the SCOP domains covered only 40.2%, when measured in the residue basis in GTOP. In order to check our expectation and robustness of our method, we applied our method also to the SCOP superfamily domains.
Domain Organizations and Repertoires
The domain organization of a protein is defined as the sequential order of the domains in the protein. For example, if a protein has domains A, B, and C along its primary structure in that order, its domain organization is defined as “ABC” (fig. 1). It is distinguished from the domain organization “BAC,” which consists of the same domains but their order is different, and is also distinguished from the domain organization “ABCC,” which has an extra C domain. The domain organization could also be composed of one domain. Regions to which the same domain is assigned are guaranteed to reflect their common ancestry, and therefore, proteins with the same domain organization are roughly regarded as homologous over their total length.
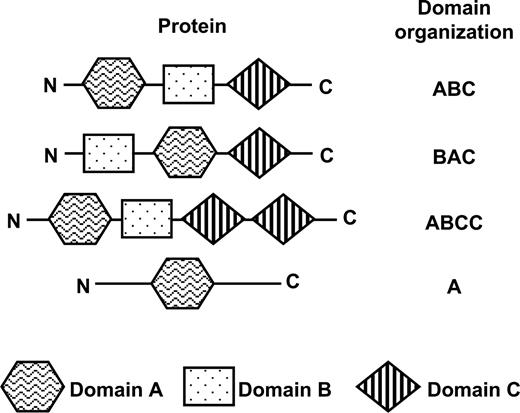
Protein and its domain organization. The domain organization of a protein is defined as the sequential order of the domains in the protein. The domain organization could also be composed of one domain.
The repertoire of protein domain organizations of an organism is defined as the set of domain organizations of all proteins encoded in the genome of the organism. Only the presence or absence of a domain organization was considered for the construction of the repertoire of each organism.
Evolutionary Distances and a Phylogenetic Tree
The evolutionary distance between every pair of the organisms studied was computed, and a tree of life was accordingly constructed by the Neighbor-Joining (NJ) method (Saitou and Nei 1987).
Bootstrap Probability
We evaluated the reliability of each internal branch of the constructed tree by the bootstrap method (Felsenstein 1985) modified by us for the domain organization repertoire data. The modification is as follows. Let us consider a table of m rows and n columns, in which the rows and the columns stand for m organisms and n domain organizations respectively, and presence or absence of a domain organization of an organism is recorded in each cell. In bootstrap resampling, n columns were randomly sampled with replacement from the original table to make a resampled table. Using the resampled table, evolutionary distances and then a tree were obtained by the same methods as those mentioned in the above section. These processes were repeated 100 times. We then compared the topology of each generated tree with that of the original tree and counted the number of occurrences of each branch of the original tree for the 100 generated trees. The percentile number of the occurrences for each branch is the bootstrap probability for the branch in this case.
Construction of a Network
Using the evolutionary distances used for a tree construction, we also constructed a network with NeighborNet (Bryant and Moulton 2004) to reveal some of the conflicting signals that might harbor in the distance data.
Results
Properties of Domain Organization Repertoires
We selected 17 archaeal, 136 bacterial, and 14 eukaryotic organisms, for which the whole-genome sequence or the complete set of cDNA clones is sequenced. Each archaeal and eukaryotic organism represents its species, and the bacterial organisms are derived from 105 species, some of which contain different strains. The names, codes, numbers of ORFs, genome sizes, and National Center for Biotechnology Information (NCBI) taxonomy of the organisms analyzed are listed in supplementary table S1 (Supplementary Material online).
The number of the domain organizations extracted from each organism (nX) ranged between 266 and 4,762 among the 167 organisms, and 18,302 domain organizations were extracted from the organisms as a whole. As expected, nX was distinctively larger for eukaryotic organisms than for archaeal or bacterial organisms. In prokaryotes, nX is larger for a bacterial organism than for an archaeal organism, except for a parasitic or symbiotic bacterial organism such as Mycoplasma, Rickettsia, Chlamydia, or Buchnera. In general, nX is roughly proportional to the number of ORFs in an organism (fig. 2), although plant organisms have small nX for their number of ORFs, as compared with other organisms. This is not due to ineffective detection of the Pfam domains in the plant proteins because the domains are no less extensively assigned to the ORF regions in the plant genomes (e.g., the Pfam cover rate for A. thaliana is 40.2%) than in the other eukaryotic genomes (e.g., 38.2% for human). The most probable explanation for the relatively small nX in the plants is the recent genome duplication in them (The Arabidopsis Genome Initiative 2000; Goff et al. 2002; Yu et al. 2005), by which the number of ORFs was doubled, whereas that of domain organizations was not.
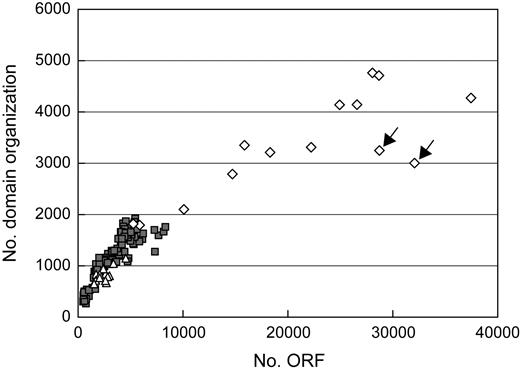
Correlation between the number of ORFs and the number of domain organizations. Each spot represents an organism of Archaea (triangle), Bacteria (square), or Eukaryote (diamond). The 2 numbers are roughly proportional to one another, except for plant organisms (marked with arrows). Both numbers for eukaryotic organisms are distinctively larger than those of archaeal or bacterial organisms.
We then counted nAB, the number of domain organizations shared by organism A and organism B, for every pair of the 167 organisms. The proportion of the shared nAB to the total nA or nB ranged between 0.03 and 1.00. The proportions for a pair of organisms, nAB/nA and nAB/nB, are expectedly larger as the organisms A and B relate more closely. The proportion also tends to increase, as the total nA deceases (fig. 3). This is consistent with the fact that most genes in a small genome are essential and ubiquitous.
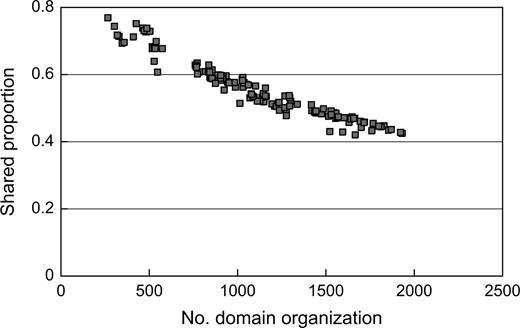
Correlation between the number of domain organizations and the proportion of shared domain organizations. The correlation was computed only for the bacterial organisms. Each spot represents a bacterial organism, and the proportion of a given organism was obtained by averaging all the proportions computed between the organism and the other bacterial organisms.
Construction of a Domain Organization Tree
Using the nAB/nA and nAB/nB values, we computed an evolutionary distance for every pair of the 167 organisms and constructed a phylogenetic tree of them as shown in figure 4 (see Supplementary fig. S1, Supplementary Material online for an enlarged version of the tree). The organisms in the phylogenetic tree are color coded following the NCBI taxonomy (Benson et al. 2000; Wheeler et al. 2000).
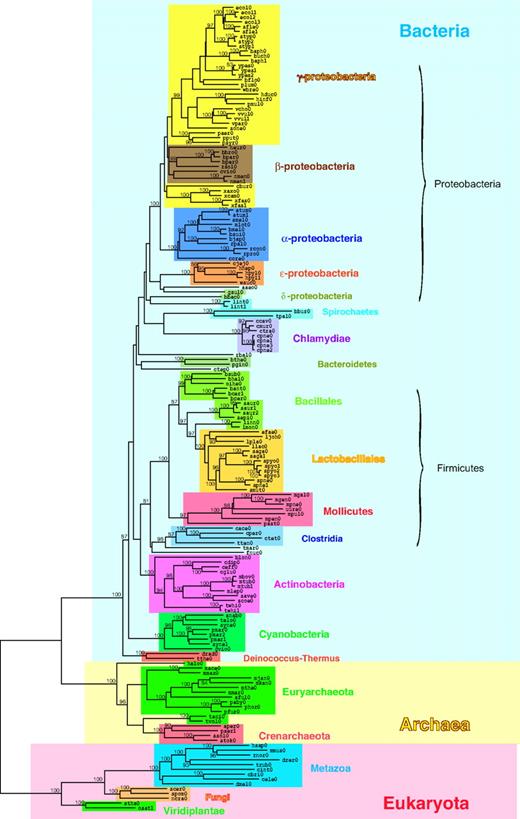
A phylogenetic tree based on the domain organization repertoires. The tree includes 17 archaeal, 136 bacterial, and 14 eukaryotic organisms. The organisms in the tree are color coded according to the NCBI taxonomy (Benson et al. 2000; Wheeler et al. 2000). The Pfam (Bateman et al. 2004) domain organizations were used for constructing the domain organization repertoire of each organism. Evolutionary distance between every pair of the 167 organisms was computed based on their domain organization repertoires, and the tree was constructed by the NJ method (Saitou and Nei 1987). The number on an internal branch shows a percentage of bootstrap probability (Felsenstein 1985). Only bootstrap values equal to or higher than 80% are shown.
The topology of the tree is quite consistent with the NCBI taxonomy and other traditional ones (Garrity et al. 2004) in the following 5 aspects. First, the organisms are clearly divided into the 3 superkingdoms, Archaea, Bacteria, and Eukaryota. Secondly, all the 3 eukaryote kingdoms and most prokaryote phyla show monophyly at a high bootstrap probability. Monophyly is also observed in many bacterial sections, a lower rank to phylum. Although Beta-/Gammaproteobacteria sections are not clearly separated, this is rather due to historical misclassification of Betaproteobacteria as a separate phylum. Thirdly, most of the branching patterns of the bacterial phyla are in agreement with their evolutionary relationships that are widely accepted today, although bootstrap support for the branching patterns is not significant. For example, it is considered now that Deinococcus-Thermus phylum diverged very early in the evolution of Bacteria (Gupta 1998; Brown 2003), which is also shown in our tree. Our tree also shows early divergence of Cyanobacteria phylum, clustering of gram-positive phyla Actinobacteria and Firmicutes together, and close relationships of Chlamydiae, Bacteroides, and Spirochaetes to Proteobacteria. Fourthly, the branching patterns of the eukaryotic organisms are in agreement with their evolutionary relationships in the traditional taxonomy, although the branches in the animal (Metazoa) lineage and those in the plant (Viridiplantae) lineage are respectively longer and shorter than those in the other lineages. The longer branches in the animal lineage probably reflect an increase in the rate of change of domain organization repertoires in this lineage. Finally, our tree places parasitic and symbiotic organisms in the appropriate taxonomic positions. Many genome trees do not show the correct positions of those organisms and cluster them together regardless of their taxonomic positions, whereas some genome trees resolve the problem and show the correct positions (Korbel et al. 2002; Kunin et al. 2005; Yang et al. 2005). Our method has also overcome the problem. These 5 aspects together confirm that the difference of the domain organization repertoires among organisms is a reliable measure for inferring their evolutionary lineages.
There are, however, also inconsistent aspects between the traditional tree and ours, which are also found in genome trees constructed by other authors. First, our tree shows that Euryarchaeota is not monophyly in the Archaea cluster. Whereas one of the Euryarchaeota organisms, Halobacterium sp. NRC-1 (halo0), is placed on a separate basal branch of the cluster, 2 Euryarchaeota organisms, Thermoplasma acidophilum DSM1728 (taci0) and Thermoplasma volcanium GSS1 (tvol0), cluster together with Crenarchaeota rather than the other Euryarchaeota organisms. The same relationships in the Archaea cluster have also been obtained in other genome trees (Korbel et al. 2002; Wolf et al. 2002; Yang et al. 2005). Secondly, the Bacillales section in our tree does not show monophyly (Wolf, Rogozin, Grishin, et al. 2001; Korbel et al. 2002; Wolf et al. 2002; Yang et al. 2005). Thirdly, the Spirochaetes organisms in our tree do not make a cluster (Yang et al. 2005). Fourthly, the Proteobacteria cluster in our tree includes thermophilic bacterium, Aquifex aeolicus (aaeo0) (Wolf et al. 2002; Yang et al. 2005). Finally, the Firmicutes cluster includes another thermophilic bacterium, Thermotoga maritima (tmar0), and fusobacteria, Fusobacterium nucleatum (fnuc0) (Yang et al. 2005).
Those inconsistent aspects are not conclusive to state that our tree is incompatible with the traditional trees for the following 2 reasons. First, some branches involved in the inconsistent clusters have too low bootstrap probabilities to be valid. Our tree cannot resolve deep phylogeny, which is a general feature of trees of life. The branch clustering Thermoplasmata and Crenarchaeota, for example, shows less than 50% bootstrap probability, and so do the branches that prevent Spirochaetes from being monophyly. Secondly, a taxonomic unit sometimes corresponds to a paraphyletic group such as reptiles in the traditional classification (Graur and Li 2000). Because the Bacillales organisms make a paraphyletic group in the Firmicutes cluster in our tree, and so do the Euryarchaeota organisms in the Archaea cluster, they can be considered as taxonomic units.
A SCOP Tree and a Domain Contents Tree
We also applied our method to the SCOP superfamily domains in place of the Pfam domains (supplementary fig. S2, Supplementary Material online). As can be seen in figures 4 (or supplementary fig. S1, Supplementary Material online) and supplementary figure S2 (Supplementary Material online), the 2 trees have similar topology. The SCOP tree, however, is a little more different from the traditional taxonomy than the Pfam tree. The Cyanobacteria phylum clusters with the Proteobacteria phylum in the SCOP tree. The phyla Chlamydiae, Bacteroides, and a part of Spirochaetes are more closely related to the Firmicutes phylum in the SCOP tree than in the traditional taxonomy. In addition, the overall bootstrap probabilities are lower in the SCOP tree than in the Pfam tree. We considered, therefore, the Pfam tree better than the SCOP tree. The difference in the 2 trees could be attributed to the difference in the amount of information between the Pfam and SCOP domains as mentioned in Materials and Methods.
We also constructed a tree using the Pfam domains instead of the domain organizations (supplementary fig. S3, Supplementary Material online) to see if the domain organizations bring a better result than the domain contents. The domain contents tree has more similar topology to the domain organization tree than the SCOP tree: it exhibits an early diversification of the Cyanobacteria phylum as well as the domain organization tree. However, like the SCOP tree, the domain contents tree shows closer phylogenetic relationship between the Firmicutes phylum and Chlamydiae, Bacteroides, and a part of Spirochaetes than the traditional taxonomy indicates. In addition, it does not show the Mollicutes section as monophyly, and the overall bootstrap probabilities of the domain content tree are lower than those of the domain organization tree. These results demonstrate that the tree constructed from the domain organizations is superior to the tree constructed from the domain contents alone. This is mainly because the change of domain organization repertoires is caused not only by the gain or loss of a domain but also by the reorganization of existing domains, whereas the change of domain contents is related only with the former.
Construction of a Domain Organization Network
Using the evolutionary distances computed from the Pfam domain organizations, we constructed a network as shown in figure 5 (see Supplementary fig. S4, Supplementary Material online, for an enlarged version of the network). The network exhibits similar evolutionary relationships among the organisms to that of the Pfam tree. In addition, it reveals some conflicting signals, which are represented by many parallelograms in the network.
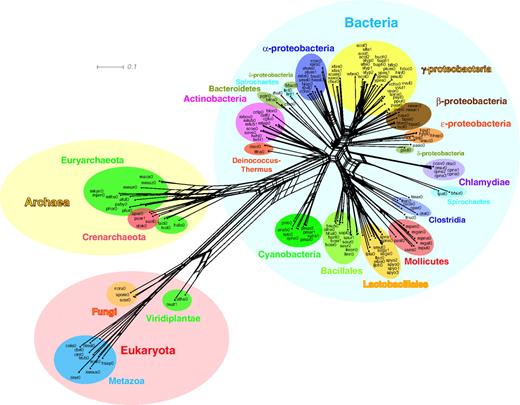
A network based on the domain organization repertoires. The network was constructed with NeighborNet (Bryant and Moulton 2004) using the same evolutionary distances as used for the tree in figure 4. The network exhibits not only similar evolutionary relationship to that of the figure 4 tree but also some conflicting signals harbored in the distance data, which are represented by many parallelograms in the network.
Discussion
One of the new and strong points of our method is to use domain organization for construction of a phylogenetic tree. A tree of life necessarily incorporates all the available species from the 3 superkingdoms, Archaea, Bacteria, and Eukaryota. In addition, it is desirable to construct it from whole genome not from a limited number of genes. Therefore, a method for constructing a tree of life should be applicable to a huge amount of genome data. In our method, a protein domain is considered as an evolutionary unit, instead of an amino acid residue. Such a coarse grained way greatly compresses the genome data and enables us to incorporate all the available species into a tree. Although protein domains do not represent the whole genome of an organism, our method shows one of the most feasible ways to cover a skyrocketing amount of genome data.
Our method scales the change of a domain organization repertoire, that is, appearance and disappearance of domain organization in an organism, which is a rare event in the course of evolution (Fukami-Kobayashi et al. 1993; Apic et al. 2003; Fukami-Kobayashi et al. 2003). This feature is advantageous for elucidating phylogenetic relationships of remotely related species. On the other hand, our method treats more detailed aspects of evolution than the methods based on the domain contents because the domain organization considers not only domain contents of a protein but also their sequential order. The domain organization tree demonstrated a better result than the domain contents tree, which may suggest that domain contents does not give sufficient information and domain organization gives us moderately reduced information for construction of a tree of life.
Our method has the following 6 features that would perhaps make it superior to the methods using gene or protein sequences in the construction of a tree of life. The first 3 features are also inherent in other genome-based methods using gene contents, gene order, or total evolutionary distances. 1) It can incorporate the information of a protein even if the protein is not shared among the species in question. On the other hand, a sequence method can use only genes or proteins that are shared among all the species studied. When constructing a tree of superkingdoms, one has to use limited genes such as ribosomal RNA (rRNA), ribosomal protein, elongation factor Tu, and aminoacyl-tRNA synthetase (AARS) genes, which are almost exclusively involved in information storage and processing (Ciccarelli et al. 2006). 2) It does not require sequence alignment for the proteins in question. When comparing among superkingdoms, it is difficult to obtain reliable alignments even for the most conservative amino acid or nucleotide sequences. That is true of rRNAs (Hasegawa and Hashimoto 1993; Gupta 1998). In addition, the results of tree construction depend substantially upon which parts of the alignment are used as “conservative” regions (Hansmann and Martin 2000). 3) It is resistant to mutational saturation, base (or amino acid) composition biases, and heterogeneity of evolutionary rates among different evolutionary lineages. Those pitfalls prevent sequence methods from constructing the correct tree for remotely related species (Gribaldo and Philippe 2002). 4) The computational time required is roughly proportional to the number of genomes, because most of the time is spared for mapping domains in each genome. If we conduct a round robin blasting of all genes of a genome against the other, the computational time will be roughly proportional to the square number of genomes. As the number of genomes is increased, this problem will become more and more serious. 5) It does not require orthologous gene sets. Computation of orthologous gene sets is accompanied with numerous complicated and burdensome procedures, and certainly error prone. 6) It judges proteins homologous or not by the medium of protein domain organizations. It is practically difficult to define homologous proteins using sequence similarity because the optimum cutoff criteria, Blast score/e value and coverage of homologous regions, for example, vary from protein to protein. Our method takes simpler and more feasible strategy.
In addition, our method discriminates distantly related species in appearance due to genome shrinkage from that in reality and consequently places parasitic and symbiotic organisms in the appropriate taxonomic positions in a tree. Although some genome-based methods (Korbel et al. 2002; Kunin et al. 2005; Yang et al. 2005) achieve the correct positioning by normalizing genome sizes, our method achieve it by taking a geometric mean over the evolutionary distances (see Materials and Methods for details).
However, no method is free from drawbacks, and our method is no exception. The factor that may most seriously influence not only our method but also other genome-based methods in general is a massive amount of HGTs (Kunin and Ouzounis 2003) supposed to have occurred at the early stage of the cellular-organism evolution (Aravind et al. 1998; Brown 2003). There is now pretty strong evidence that there is a considerable amount of HGTs in genomes. It has also been shown that many genes in eukaryotes originated from bacteria and mitochondria (Rivera and Lake 2004; Embley and Martin 2006). Recently, it has been reported that even vitally important genes such as the recA/RAD51 family genes were acquired via endosymbiotic gene transfer (Lin et al. 2006). Dutilh et al. (2004) tried to correct the HGT effect in their gene-content method, and showed that positioning of Halobacterium at the base of Archaea was attributed to extensive levels of directed HGT in this organism. As shown in the network of figure 5, our distance data computed from domain organization repertoire harbor some conflicting signals, which mainly came from HGT. We have to keep in mind, therefore, that even a genome-based tree is just an approximation of evolutionary relationship of species and might not accurately describe their actual evolutionary process. This is a major issue in molecular phylogeny and is too often overlooked.
Whereas the overall topology of our tree is in good agreement with the conventional one, there are a number of inconsistencies between them as already described in Results. Among them, the phylogenetic positions of hyperthermophilic bacteria are particularly noteworthy. Contrary to the 16S rRNA tree (Woese 1987; Brown 2003) or the trees constructed from protein sequences (Brown et al. 2001; Katoh et al. 2001), hyperthermophilic bacteria, A. aeolicus (aaeo0) and T. maritima (tmar0), are not the earliest branching lineages in our tree. Especially, tmar0 has traditionally been located at the deepest branch of eubacteria (Woese 1987; Brown 2003), whereas our tree shows that it is closely related to Clostridia in the Firmicutes cluster with 98% bootstrap value. On the other hand, aaeo0 is located next to Deltaproteobacteria, although its bootstrap value is low. We can reject the attribution of HGTs in this case: if HGTs had occurred in these hyperthermophilic bacteria at the early stage of the cellular-organism evolution, they would have moved the phylogenetic positions of these species to earlier ones. Only a hyperthermophilic bacterium, Thermus thermophilus HB27 (tthe0), is shown to have diverged very early in the bacterial lineage. Similar results on the phylogenetic positioning of hyperthermophilic bacteria are reported also in other genome trees (Korbel et al. 2002; Wolf et al. 2002; Yang et al. 2005). Regarding this issue, it is interesting that some conflicting signals are seen between T. thermophilus HB27 (tthe0) and the Archaea cluster in figure 5.
Our tree together with other genome trees, therefore, may urge to reconsider the conventional view that thermophilic organisms are the earliest cellular life-forms. The conventional view has been derived from gene trees constructed from nucleotide or amino acid sequences and could be suffered from nucleotide or amino acid composition biases characteristic to hyperthermophilic DNAs/proteins (Hasegawa and Hashimoto 1993; Cambillau and Claverie 2000; Fukuchi and Nishikawa 2001; Nakashima et al. 2003). The biases would make hyperthermophilic DNAs/proteins of Bacteria and Archaea resemble in sequences and bring them together toward the root of their gene tree. Our method, as already discussed, is completely free from such biases. Other genome trees (Korbel et al. 2002; Wolf et al. 2002; Yang et al. 2005) are also free from such biases and show similar results to ours. Therefore, the phylogenetic positions of hyperthermophiles in the present study are expected to be more realistic than the traditional ones. Of course, in order to draw the conclusive lineages, we would need more genome data of hyperthermophiles and other evidence from various biological viewpoints.
We thank Mr S. Sakamoto for his help and advice on the use of GTOP. This work was supported in part by Grant-in-Aid for Scientific Research on Priority Areas (C) “Genome Biology” from the Ministry of Education, Culture, Sports, Science and Technology of Japan.
Funding to pay the Open Access publication charges for this article was provided by the Japan Society for the Promotion of Science Grant #16255006.
References
Author notes
William Martin, Associate Editor
