


Abstract
The T cell, Ig domain, and mucin domain-1 (TIM-1) gene is associated with Th2 T cell responses and human atopic diseases. The mechanism by which TIM-1 influences T cell responses remains unknown. We demonstrate that TIM-1 is recruited to the TCR-signaling complex via association with CD3. TIM-1 up-regulates TCR-associated signaling events, including phosphorylation of Zap70 and IL-2-inducible T cell kinase. This activity requires TIM-1 tyrosine phosphorylation. TIM-1 expression induces formation of a novel complex that includes PI3K and ITK. Finally, the consequences of TIM-1 activation include increased expression of effector cytokines. These results demonstrate that TIM-1 is a critical component of the human T cell response and provide a mechanistic hypothesis for the role of TIM-1 in disease.
T cell, Ig domain, and mucin domain (TIM)2 proteins comprise a new protein family (1). TIM-1 is one of eight genes found within the T cell airway phenotype regulator (TAPR) locus in mouse, identified as the result of a congenic analysis of Th2 cytokine expression and airway hyperresponsiveness (1). The TIM genes were linked to the expression of high levels of IL-4 and IL-13 and intensified airway hyperresponsiveness responses in mouse strains. The murine TAPR locus is syntenic with the human 5q23–35 region that has been genetically linked to atopic disease incidence and susceptibility to parasite infection (1). Subsequent analyses of human patients identified TIM-1 variation as a genetic feature of atopic disease in patients seropositive for hepatitis A virus (HAV) (2), in African-American asthmatics (3), in children with atopic dermatitis (4), in Koreans with asthma and atopic dermatitis (5, 6), but not in asthmatic Japanese (7). Thus, the TAPR locus and TIM-1 have been linked to the development of atopic disease in both inbred mouse strains and in diverse human populations. The association of TIM-1 genetic variation with HAV seropositivity was particularly interesting, as rates of HAV infection and asthma have been inversely correlated (8), and TIM-1 has been identified as a receptor for HAV in primates (9). A recent analysis of human TIM-1 sequences identified a very high level of divergence in the mucin domain of TIM-1, suggesting that the gene was indeed subject to balancing selective pressure, as might be expected of a gene involved in both viral infectivity and disease susceptibility (10). Other loci thought to be maintained under balancing selection include the MHC (10).
Functional analyses of TIM-1 have suggested that the protein is a positive regulator of T cell activity. For example, studies of TIM-1 responses induced by an anti-murine TIM-1 mAb or by murine TIM-4, a putative TIM-1 ligand, showed that engagement of TIM-1 up-regulated cellular proliferation and the expression of Th1 and Th2 cytokines both in vitro and in vivo (11, 12). However, administration of the TIM-1-Fc fusion protein to mice also up-regulated immune responses (12), a result seemingly at odds with the proposed model of TIM-1 action. Subsequent studies showed that a second anti-TIM-1 mAb could block immune responses and lung inflammation in the mouse (13) and that recombinant murine TIM-1-Fc inhibited in vitro and in vivo T cell responses (14). Thus, the activity of murine TIM-1 has been described as either stimulatory or inhibitory, depending on the particular reagents and models used. Recently, we showed that the ability of anti-murine TIM-1 mAbs to either exacerbate or block immune responses depends on the specific epitope of the mAb (29). Suggesting that both agonist and antagonist activity can be mediated by mAbs. Our understanding of TIM-1 activity is further complicated by the existence in mouse of a closely related protein, TIM-2 (1). We and others have shown that TIM-2 functions to down-regulate immune responses in the mouse (15, 16), and in particular, TIM-2-gene-deficient mice have greatly exaggerated T cell responses to Ag challenge (15). However, the TIM-2 gene is not found in the human genome and such genomic divergence suggests that the regulation or function of TIM-1 may be different in rodents and primates. We have therefore undertaken to study human TIM-1 activity in T cells. Our results definitively show that human TIM-1 associates with the TCR complex to potentiate T cell signaling. This study therefore identifies a novel mechanism by which T cell function is regulated.
Materials and Methods
Antibodies
The following Abs were used in FACS analyses: anti-TIM-1 mAb (AKG7, ARD5; Biogen Idec), FITC-anti-CD4 mAb (BD Pharmingen), and PE-rat anti-mouse IgG (Jackson ImmunoResearch Laboratories).
The following Abs were used for Western blot analysis: biotinylated anti-TIM-1 mAb (AKG7; Biogen Idec), anti-actin (Sigma-Aldrich), anti-phospho-Zap70 (Cell Signaling Technology), anti-Zap70 (Cell Signaling Technology), anti-IL-2-inducible T cell kinase (ITK) (Upstate Biotechnology), anti-phosphotyrosine (Upstate Biotechnology), and anti-CD3 mAb (BD Pharmingen). In addition, the following HRP-conjugated secondary Abs were used: anti-mouse-HRP (Amersham Biosciences) and anti-rabbit-HRP (Amersham Biosciences). Streptavidin-HRP (Zymed Laboratories) was used to detect biotinylated reagents.
The following Abs were used for immunoprecipitations: anti-PI3K (Upstate Biotechnology), anti-TIM-1 mAb (AKG7; Biogen Idec), and normal mouse IgG1 control Ab (Santa Cruz Biotechnology) followed by protein G Sepharose beads (Amersham Biosciences). Phosphotyrosine (clone 4G10; Upstate Biotechnology) or control (streptavidin; Upstate Biotechnology) coupled agarose beads were also used.
The following Abs were used for T cell stimulation in coimmunoprecipitation experiments: anti-TIM-1 mAb (ARD5; Biogen Idec), anti-CD3 (BD Biosciences), and mouse IgG control Ab (clone MOPC; BD Biosciences).
The following Abs were used for confocal microscopy: biotinylated anti-TIM-1 mAb (ARD5, AUF1; Biogen Idec), anti-CD3 mAb (clone OKT3; eBioscience), and FITC-anti-mouse IgG (Jackson ImmunoResearch Laboratories). Streptavidin Alexa 594 (Molecular Probes) was used to detect biotinylated reagents.
The anti-human TIM-1 mAbs have previously been characterized by Bailly et al. (17).
Generation of stable cell lines and transfectants
Human Jurkat T cells (American Type Culture Collection (ATCC)), grown in complete RPMI 1640 (containing 10% FBS (JRH Biosciences), 1% l-glutamine (Cellgro), and 1% penicillin/streptomycin (Cellgro)), were cotransfected by electroporation with a construct containing the coding sequence of human TIM-1 and a construct containing the puromycin-resistance gene. Full-length human TIM-1 was PCR amplified from image clone 3826378 using primers SC1–793 (5′-TGTGCGGCCGCTCTAGAATGCATCCTCAAGTGGTCATCTT-3′) and SC1–702 (5′-TGGGATCCTCAACTAGTGTCCGTGGCATAAAGACTATTCT-3′) and cloned XbaI/BamHI into the pCG expression vector. The TIM-1 construct contained the 5-bp insertion in the mucin domain described by McIntire et al. (1, 2). Puromycin (4 μg/ml; Calbiochem) was added to the medium 1 day after transfection. After 2 wk, the cells were stained with anti-human TIM-1 mAb AKG7 (Biogen Idec), followed by anti-mouse PE (Jackson ImmunoResearch Laboratories). Single cells were then sorted on a MoFlo (BD Biosciences) and grown to confluence in 96-well plates. Each well was then analyzed by FACS for TIM-1 expression. Two independent lines were created for full-length TIM-1 (JT1wt1, JT1wt2), Additional transient transfections included TIM-1 lacking the IgV domain (JT1ΔIgV), TIM-1 lacking the cytoplasmic domain (TIM-1Δ-cyto), and TIM-1 containing a mutated tyrosine residue (Y350) in the cytoplasmic domain (JT1a1, JT1a2), and empty vector controls. All constructs were prepared using standard PCR and/or mutagenesis techniques, and commonly used vectors for selection and expression, as follows. The cytoplasmic domain mutant Y350A was made using full-length human TIM-1 template, paired mutagenesis primers to cover the target residues, and the QuickChange mutagenesis kit (Stratagene). The IgV-deleted form of TIM-1 was amplified from full-length TIM-1 using primers T1dIgV-5 (5′-TGTTTGCGGCCGCGAAGGTCACG-3′) and T1dIgV-3 (5′-TGTAGAGTCGACTGAGGCATAGTCAGGCA-3′) and cloned NotI/SalI into the pFLAG-CMV-1 vector. The cytoplasmic domain deleted form of TIM-1 was amplified from full-length human TIM-1 using primers T1dcyto-5 (5′-TGTTCCGCGGCCGCTCTAGAATGCATCCTC-3′) and T1dcyto-3 (5′-TGTGGGATCCGCGGCCGCTCATTTGGCAATGATGACACCC-3′) and was cloned NotI/NotI into the pv100 vector.
Primary T cell isolation, fractionation, and transfection
Heparinized peripheral blood obtained from healthy donors was diluted 1/1 with PBS, layered onto Ficoll-Hypaque (Pharmacia), and centrifuged at 2000 rpm for 30 min at 25°C in a table top centrifuge (Sorvall). Buffy coats were removed and washed two times with PBS/0.5% BSA at 1200 rpm for 15 min. PBMCs were then resuspended in PBS/0.5% BSA. CD4+ T cells were negatively selected by magnetic cell separation columns (MACS; Miltenyi Biotec). An aliquot of the T cells were then transfected with the human TIM-1 plasmid using the human T cell nucleofector kit (Amaxa). Transfected and control (mock-transfected or untransfected) T cells were stimulated as described. For Th1/Th2 cytokine analysis, supernatants were harvested after 48 h of incubation and analyzed for cytokine expression using the Th1/Th2 Cytometric Bead Array (CBA) kit (BD Biosciences). Data are represented as units per milliliter as compared with the manufacturer supplied standards. All samples were represented by triplicates and the data represent the mean and SE.
Immunoprecipitation and immunoblot analysis
T cell lines or primary human blood CD4+ T cells were washed in PBS and lysed in buffer containing 1% Nonidet P-40, 50 mM Tris-HCl (pH 8.0), 0.1 mM EDTA, 150 mM NaCl, 10 mM NaF, 0.2 mM Na3VO4, and 1× complete protease inhibitors (Roche) for 20 min on ice. For immunoblots, total protein concentration of lysates was measured using the DC protein assay kit (Bio-Rad) and equal amounts of protein were loaded for each sample. For immunoprecipitations, lysates were incubated for 2 h with either phosphotyrosine or control streptavidin-coupled agarose beads (Upstate Biotechnology), anti-PI3K (Upstate Biotechnology), or anti-TIM-1 (AKG7; Biogen Idec) Abs and protein G Sepharose beads (Amersham Biosciences). The precipitates were washed two to three times with lysis wash buffer (0.3% Nonidet P-40, 50 mM Tris-HCl (pH 8.0), 0.1 mM EDTA, 50 mM NaCl, and 10 mM NaF), resuspended in SDS-loading buffer and boiled for 5 min. The samples were quantified for protein content, then identical amounts of protein were run for each sample The samples were separated by SDS-PAGE on 4–20% gradient polyacrylamide gels (Novex; Invitrogen Life Technologies), transferred to polyvinylidene difluoride membranes (Millipore) and blocked with 5% nonfat dry milk. The blots were incubated with Abs overnight at 4°C. HRP-conjugated secondary Abs were visualized by the Western Lightning ECL system (PerkinElmer) and exposed to film.
T cell activation assays
T cells were activated with 1 μg/ml anti-CD3 mAb, anti-TIM-1 mAb ARD5, or mouse IgG1 isotype control for variable time periods then harvested for analysis. For immunoprecipitations and phospho-Zap70 and phospho-ITK CBA assays (BD Biosciences), 107 cells were stained with 50 μg/ml Ab in 100 μl of PBS/0.5% BSA for 30 min on ice. The cells were washed, resuspended in 0.5 ml of PBS/0.5% BSA and 2.5 μg of anti-mouse IgG was added for 15 min on ice. The cells were then stimulated at 37°C for 2–5 min and immediately lysed with 0.5 ml of cold 2× lysis buffer (CBA: BD Biosciences supplied lysis buffer; immunoprecipitation: 2% Nonidet P-40, 100 mM Tris-HCl (pH 8.0), 0.2 mM EDTA, 300 mM NaCl, 20 mM NaF, 0.4 mM Na3VO4 and 2× complete protease inhibitors (Roche)). For phospho-Zap70 and phospho-ITK CBA analysis, samples were then boiled for 5 min, passed through a 25-gauge needle and analyzed using the flex set kit (BD Biosciences). All CBA results represent mean and SE of triplicate samples. Data are represented as units per milliliter as compared with the manufacturer supplied standards. To assess the combined effect of anti-TIM-1 and anti-CD3 treatment, cells were incubated as described above with both reagents, or with anti-CD3 and anti-CD28 (10 μg/ml). Cells were lysed as described above for immunoprecipitation with anti-phosphotyrosine beads or control beads, then samples were normalized for total protein content and run on Western blots in duplicate for detection of Zap70. Zap70-positive bands were analyzed by gel morphometric scan.
FACS analysis
Expression of TIM-1 on cell lines and isolated CD4+ T cells were analyzed by flow cytometry with a BD Biosciences FACSCalibur and FloJo software. CD4+ T cell populations were ≥95% pure when isolated by MACS beads. CBA assays were analyzed on a BD Biosciences FACS Array.
RT-PCR
Primary CD4+ T cells were diluted serially by 2-fold dilutions and supplemented with up to 1 × 10⁶ A20 cells (ATCC). RNA was purified using TRIzol (Invitrogen Life Technologies). RNA pellets were resuspended in RNase-free H2O and subjected to cDNA synthesis by adding 250 ng of random primers (Invitrogen Life Technologies) and incubating at 68°C for 8 min. The tube was then quickly cooled on ice. A total of 1 μl of 10 mM dNTPs, 2 μl of 100 mM DTT, and 4 μl of first strand buffer (all from Invitrogen Life Technologies) were added to the tube and incubated at room temperature for 10 min. A total of 1 μl of Superscript II reverse transcriptase (Invitrogen Life Technologies) was added and the tube was further incubated at 25°C for 10 min then at 42°C for 50 min. Following cDNA synthesis, reactions were incubated at 68°C for 15 min to inactivate the reverse transcriptase. A total of 180 μl of H2O was added to the cDNA and TIM-1 or GAPDH PCR was performed using the Fast Start TaqDNA polymerase kit (Roche). The specific PCR primers used were as follows: TIM-1: 5′-TTGGTGGAGAGGCAGGTCCAT-3′ and 5′-GCTCGTTCGAACAGTCGTGAC-3′; GAPDH: 5′-GGGCGCCTGGTCACCAGGGCTG-3′ and 5′-GGGGCCATCCACAGTCTTCTG-3′. 769P cells (ATCC) were used as a positive control and A20 cells or H2O were used as negative controls. PCR products were resolved on a 3% agarose gel and bands were visualized with ethidium bromide.
TaqMan thermal cycling for real-time PCR
RNA was isolated from Jurkat T cells as described above. Oligonucleotide primers and TaqMan MGB probes were designed using Primer Express version 2.0.0 (Applied Biosystems). TaqMan MGB probes contained a 5′ covalently linked fluorescent reporter dye (FAM) and a minor groove binder/nonfluorescent quencher covalently linked to the 3′ end. Oligonucleotide standard templates were designed by the addition of 10 bp of gene-specific sequence to the 5′ and 3′ ends of the amplicon. PAGE-purified oligonucleotide standard templates (BioSource International) and desalted primers and HPLC-purified probes (Applied Biosystems) were used. A primer and probe set for GAPDH was used as a normalizing control.
Cells were lysed in 1.5 ml of TRIzol reagent (Invitrogen Life Technologies) and RNA was extracted using 1 ml of acidic phenol:chloroform:isoamyl alcohol 25:24:1 (pH 6.6). Purified total RNA was resuspended in DEPC H2O (Ambion) and 260/280 absorbance recorded (Spectra Max Plus; Molecular Devices). A total of 100 μg of RNA was further purified using an RNeasy mini column (Qiagen). Residual DNA was removed from 5 μg of total RNA using 5 U of DNase I (amplification grade; Invitrogen Life Technologies) at 20°C for 15 min, which was then inactivated according to manufacturer’s protocol. cDNA was synthesized using a high capacity cDNA archive kit (Applied Biosystems) and were stored at −20°C until use. Oligonucleotide templates were pooled and then serially diluted 1/10 six times in 25 ng/μl yeast RNA (Ambion) to include a final range of 100 fM to 1 aM.
Quadruplicate PCR for samples and standards were mixed in a 96-well plate then transferred to a 384-well optical plate and cycled in a 7900HT thermal cycler (Applied Biosystems) under the following conditions: 50°C for 2 min (uracil N-deglycosylase digest), 95°C for 10 min (activation of Taq thermostable polymerase), and 40 cycles at 95°C for 15 s and 60°C for 60 s for amplification. The fluorescence emission was collected every 7 s for the length of the run for each reaction well. Relative transcript quantities were determined for each sample by comparison to oligonucleotide standard curve using Sequence Detection Software (Applied Biosystems).
Confocal microscopy
A total of 2 × 10⁶ Jurkat or JT1wt1 cells were stained in 250 μl of PBS/0.5% BSA on ice for 30 min with 40 μg/ml primary Ab. The cells were washed and stained with 20 μg/ml secondary Ab. Cells were then stimulated for 10 min at 37°C, immediately cooled with cold PBS/0.5% BSA/0.1% sodium azide and washed twice in the same buffer. Cells were then stained with a second primary/secondary Ab pair, as appropriate. Cross-linking controls included isotype control mAbs (mouse IgG2a and mouse IgG1) and secondary Abs alone. The following staining combinations were used: anti-CD3/anti-mouse FITC and biotinylated anti-TIM-1/streptavidin Alexa 594. All stained samples also contained secondary only controls for the other Ab to ensure no background stain bled between filters. Cells were fixed with 2% paraformaldehyde in PBS, mounted on slides, and analyzed using a Leica DM IRB confocal microscope and associated image capture and analysis software.
Results
TIM-1 overexpression induces T cell activation signals
It has been established that TIM-1 mRNA and protein are expressed in both mouse (1, 11, 18) and human (14, 19) CD4+ T cells following activation. To study the downstream signaling effects of TIM-1 expression in human T cells, multiple immortalized lines from ATCC and elsewhere were tested for TIM-1 expression by FACS analysis, but no TIM-1-positive cell lines were found (data not shown). The Jurkat T cell line did however behave similarly to primary T cells in that TIM-1 mRNA expression levels increased upon T cell stimulation with PMA and ionomycin, as seen by real-time RT-PCR analysis (Fig. 1a). Therefore, we created Jurkat cell lines that stably express TIM-1. The resulting cell lines were assessed by FACS and Western blot analyses, confirming that full-length TIM-1 protein was highly expressed (Fig. 1, b and c).To test whether TIM-1 overexpression affected T cell signaling, wild-type Jurkat T cells and Jurkat T cells expressing TIM-1 (JT1wt1) were subjected to Western blot and CBA analyses to examine the levels of phosphorylated Zap70 and phosphorylated ITK when the cells were at rest, i.e., not activated. Levels of phosphorylation were calculated relative to standard curves generated using the CBA kit and technology. Sample curves are shown (Fig. 2b); relative mean fluorescence intensity varied from experiment to experiment but the relationship of mean fluorescence intensity to units per milliliter concentration was highly consistent. It was determined that TIM-1 overexpression in T cells was sufficient to cause elevated levels of Zap70 phosphorylation (Fig. 2, a and b). Phosphorylation of ITK was variable but was also reproducibly higher in JT1wt1 cells than in Jurkat cells in multiple experiments (n = 4) (Fig. 2c). The increase in ITK phosphorylation did not reach statistical significance, as Jurkat cells alone demonstrated considerable phosphorylation of this kinase (Fig. 2c). Therefore, TIM-1 overexpression was sufficient to increase the baseline phosphorylation of downstream TCR signaling components, particularly of Zap70.
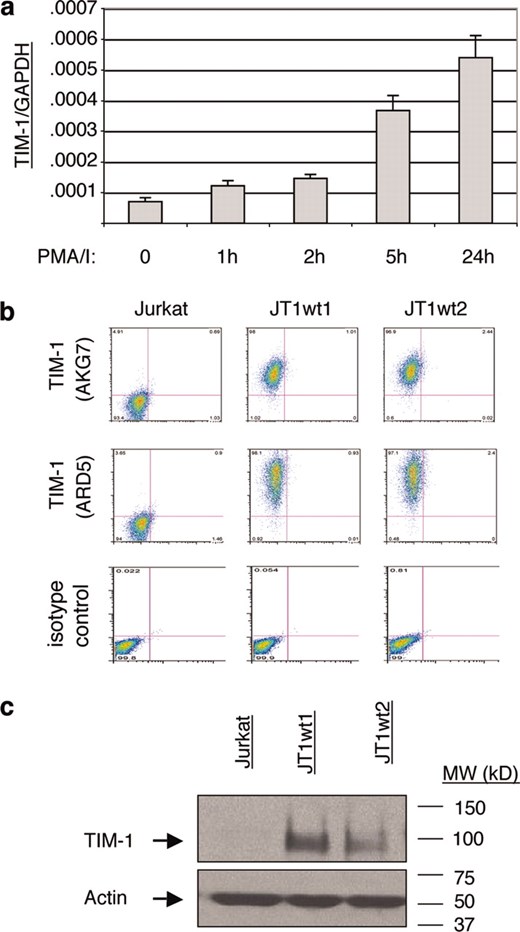
Expression of TIM-1 in untransfected and stably transfected Jurkat cell lines. a, Wild-type Jurkat cells increase TIM-1 mRNA expression over 24 h upon activation with 1 ng/ml PMA and 250 ng/ml ionomycin (PMA/I). Cells were harvested at the times indicated and RNA isolated for real-time PCR analysis. TIM-1 expression is shown relative to GAPDH control expression. This experiment was performed at least four times and the result is representative. b, FACS analyses of two human TIM-1 stably transfected Jurkat cells lines (JT1wt1 and JT1wt2) as assessed with the anti-human TIM-1 mAbs AKG7 and ARD5. TIM-1 expression is assessed in the FL-2 channel (y-axis); the FL-1 channel (x-axis) is unused. c, Cell lysates made from wild-type Jurkat cells and TIM-1 stable transfectants JT1wt1 and JT1wt2 were run on SDS-PAGE and TIM-1 was detected by Western Blot analysis using biotinylated-AKG7. The FACS and Western blot analyses were routinely run to monitor expression during passage in culture.
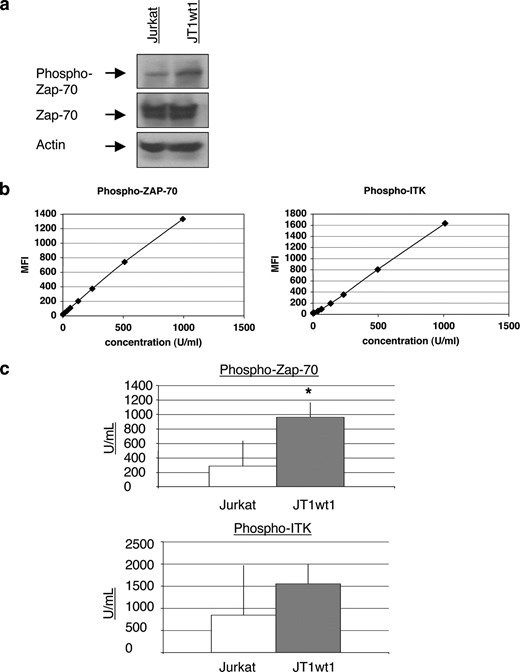
Overexpression of TIM-1 is sufficient to increase phosphorylation of Zap70 and ITK. a, Western blot analysis of cell lysates demonstrating increased Zap70 phosphorylation in the TIM-1-expressing cell line JTwt1. Baseline Zap70 levels were not changed. b, CBA analysis of cell lysates confirming that Zap70 phosphorylation is increased in the JTwt1 cell line. c, CBA analysis of cell lysates demonstrating increased ITK phosphorylation in the TIM-1-expressing JTwt1 cell line. For the CBA analyses, triplicate wells were analyzed and mean and SE are shown. *, p < 0.001 by test of mean equivalence. All data shown are representative of at least six independent experiments and illustrate typical results.
TCR signaling increases upon TIM-1 cross-linking
To investigate whether TIM-1 cross-linking also affected the activation of TCR signaling pathway components, Jurkat or JT1wt1 cells were cross-linked with 1 μg/ml anti-CD3 mAb, anti-TIM-1 mAb ARD5, or mouse IgG1 isotype control for 2–5 min then analyzed. ARD5 is an anti-TIM-1 mAb directed to the IgV domain (17), and therefore might induce activity similar to ligand binding. Whole cell lysates were treated with either control or phosphotyrosine-coupled beads to immunoprecipitate tyrosine-phosphorylated proteins. Western blots were run and probed for Zap70. TIM-1 cross-linking consistently induced greatly elevated Zap70 phosphorylation in the JTwt1 cell line (Fig. 3a). Of interest, this protocol also induced a slight elevation of Zap70 phosphorylation in wild-type Jurkat cells, suggesting that a small amount of TIM-1 is naturally expressed on these cells. Additionally, JT1wt1 cells were stimulated with either anti-CD3 or anti-TIM-1 Abs and subjected to CBA analysis. TIM-1 cross-linking with mAb ARD5 led to an increase in both phosphorylated Zap70 protein levels and phosphorylated ITK protein levels in JT1wt1 cells within 2 min, to levels similar to that induced by anti-CD3 cross-linking (Fig. 3, b and c), i.e., 2- to 8-fold higher than that observed by TIM-1 overexpression alone. In separate experiments, the combined effect of anti-CD3 and anti-TIM-1 treatment was assessed using phosphotyrosine immunoprecipitation followed by Zap70 Western blot analysis. Phosphorylated Zap70 was quantitated by gel scanning morphometry of samples normalized for total protein load. The results show that cross-linking both TIM-1 and CD3 had a modestly higher impact on Zap70 phosphorylation than cross-linking either alone, and this impact was similar to the effect of CD3/CD28 cross-linking (Table I).
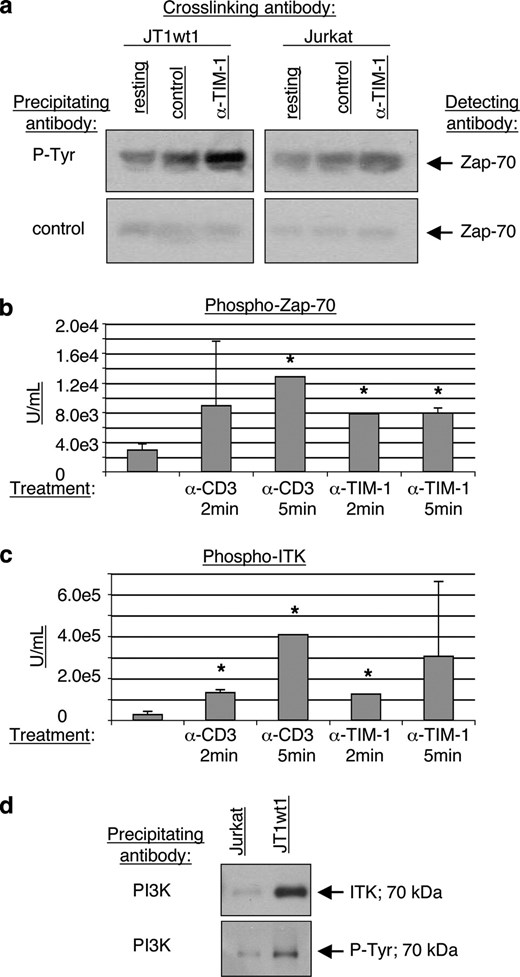
Cross-linking of TIM-1 induces phosphorylation of Zap70 and ITK, and association with PI3K. a, Immunoprecipitation analysis of Zap70 phosphorylation following TIM-1 cross-linking. Wild-type Jurkat or JTwt1 cells were incubated with anti-TIM-1 mAb ARD5 or control mAb for 5 min then cell lysates were analyzed via immunoprecipitation with anti-phosphotyrosine or control Ab, followed by Western Blot analysis using anti-Zap70. b, CBA analysis of phosphorylated Zap70 levels following cross-linking with anti-CD3 mAb or ARD5 mAb. Triplicate wells were analyzed; mean and SE are shown. *, p < 0.001 by test of mean equivalence. c, CBA analysis of phosphorylated ITK levels following cross-linking with anti-CD3 mAb or ARD5 mAb. Triplicate wells were analyzed; mean and SE are shown. *, p < 0.001 by test of mean equivalence. d, Coimmunoprecipitation analysis of PI3K interacting with ITK in the TIM-1 dependent signaling cascade. Cell lysates from Jurkat or JTwt1 cell lines were immunoprecipitated with PI3K Ab then run on a Western blot which was probed with Ab to ITK or to phosphorylated tyrosine. Both probes detected the same 70-kDa band. All data shown are representative of at least six independent experiments and illustrate typical results.
Morphometric scans of band density of JTwt1 cells activated with the indicated Ab pairs as described in Materials and Methodsa
| phospho-Zap-70 | phospho-Zap-70 | |
|---|---|---|
| Untransfected control | 0.26 (0) | ND |
| Isotype controls | 0.28 (0.01) | 0.19 (0.03) |
| Anti-CD3 | 0.375 (0.01) | 0.42 (0.1) |
| Anti-CD3/anti-CD28 | 0.51 (0.025)b | 0.6 (0.15) |
| Anti-TIM-1 | 0.35 (0.03) | 0.49 (0.07) |
| Anti-CD3/anti-TIM-1 | 0.451 (0.028)b | 0.62 (0.14)c |
Cell lysates were immunoprecipitated with anti-phosphotyrosine beads or control beads, and Western blots were run with equivalent protein load per sample. Numbers shown represent mean and standard error of duplicate lanes of the Western blot probed for ZAP-70, normalized to background as measured in the matched control bead lane. The experiment was done twice with similar results.
p < 0.0001;
p < 0.05.
To determine whether additional components of the TCR signaling complex were engaged in TIM-1-expressing T cells, whole cell lysates from Jurkat or JT1wt1 cells were immunoprecipitated with PI3K and blots were probed for ITK or phosphotyrosine. The results show that ITK can be coimmunoprecipitated via Ab to PI3K, suggesting that the TIM-1-induced complex contains canonical TCR-signaling components (Fig. 3d).
TIM-1 cross-linking causes rapid tyrosine phosphorylation of TIM-1
To determine whether human TIM-1 is phosphorylated following mAb-mediated cross-linking, Jurkat cells, JT1wt1 cells, or JTwt2 cells (an independent TIM-1-expressing line) were incubated for 5 min with isotype control mAb or anti-TIM-1 mAb ARD5. Whole cell lysates were then immunoprecipitated with either isotype control beads or anti-phosphotyrosine-coupled beads to pull down tyrosine-phosphorylated proteins. Western blots were run and probed for TIM-1 using biotinylated AKG7. This experimental design detected a marked increase in phosphorylated TIM-1 proteins after ARD5 stimulation. Thus, we demonstrated that TIM-1 cross-linking with mAb ARD5 induced phosphorylation (Fig. 4a).
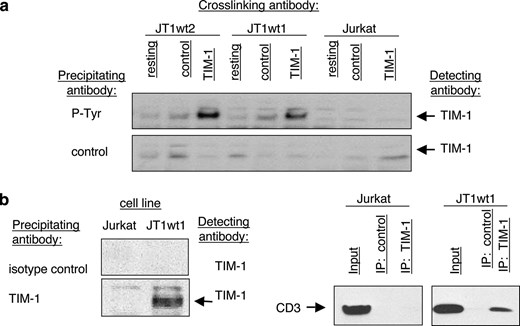
Phosphorylation of TIM-1 and physical association of TIM-1 with the TCR. a, TIM-1 cross-linking is sufficient to induce TIM-1 phosphorylation. Cell lines were stimulated with anti-TIM-1 mAb ARD5 for 5 min and then cell lysates were immunoprecipitated with anti-phosphotyrosine Ab and run on Western blots. Blots were probed with biotinylated anti-TIM-1 mAb AKG7. b, Immunoprecipitation of CD3 via anti-TIM-1 mAb AKG7. The Western blots were probed with biotinylated anti-TIM-1 mAb AKG7 or with anti-CD3. The experiment was performed twice with similar results.
TIM-1 is physically associated with the TCR/CD3-signaling complex and colocalizes with CD3
Given the results obtained thus far, we hypothesized that TIM-1 might physically interact with the TCR/CD3 complex. To test this, Jurkat or JT1wt1 cells were immunoprecipitated with anti-TIM-1 mAb AKG7 and Western blots were probed for TIM-1 and for CD3. Jurkat or JT1wt1 contained similar amounts of anti-CD3 while only the JT1wt1 line contained detectable TIM-1, as expected (Fig. 4b). We found that a significant amount of the available CD3 in the JT1wt1 cell line coimmunoprecipitated with TIM-1 in vitro (Fig. 4b).
To examine this interaction in vivo, confocal microscopy was performed on anti-TIM-1 or anti-CD3-stimulated JT1wt1 cells. As expected, anti-CD3 cross-linking caused aggregation (capping) of CD3 on the cell surface (20). Strikingly, colocalization of TIM-1 with CD3 was observed upon anti-CD3 stimulation, as shown by two-color fluorescent analysis ((Fig. 5). Furthermore, anti-TIM-1 stimulation using biotinylated mAb ARD5 or biotinylated mAb AUF1 (an independent mAb to the IgV domain (17)) also caused TIM-1 and CD3 colocalization in JT1wt1 cells as detected by fluorescence analysis ((Fig. 5). The confocal images in many cases represent staining of small clump of cells, for two experimental reasons. First, Jurkat cells generally grow in variable sized clusters and second, we did not treat with any reagents as TIM-1 is known to shed readily from the cell surface (17). In addition, TIM-1 transfection appears to increase clumping in Jurkat cells, either because of increased cell proliferation or because of the induction of cell surface proteins that enhance adhesion (our unpublished observations). We are currently extending these studies to transfected primary T cells in which TIM-1-dependent signaling events have also been observed (see below).
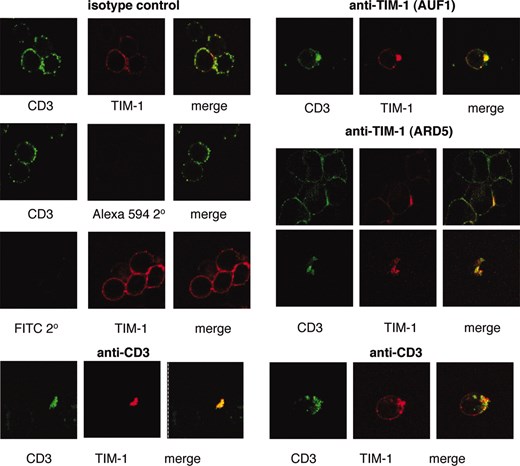
Confocal microscopy reveals colocalization of CD3 and TIM-1 upon cell activation with anti-CD3, or by cross-linking of TIM-1 with mAb ARD5. The isotype control panel (left) shows cells stained for CD3 or for TIM-1 after incubation with isotype control mAbs. Detection of CD3 with anti-mouse FITC also included the secondary only control for TIM-1 detection (streptavidin Alexa 594) and visa versa, as indicated. The anti-TIM-1 panel shows cells stained for CD3 or for TIM-1 after incubation with the indicated cross-linking anti-TIM-1 mAbs. The anti-CD3 panel (lower) shows cells stained for CD3 or for TIM-1 after incubation with cross-linking anti-CD3 mAb. The data shown are derived from two of three experiments and the results are representative.
Overexpression of TIM-1 cytoplasmic domain mutants fails to trigger signaling in T cells
To demonstrate that the activation events observed when TIM-1 was overexpressed or cross-linked were due to TIM-1 activity, and not that of an associated protein, we repeated several experiments using domain variants and mutated forms of human TIM-1. In all of these experiments transient transfectants of mutated TIM-1 constructs were compared with transient transfectants of wild-type TIM-1 constructs (JT1wt), or transient transfections of empty vector or wild-type Jurkat cells (Jurkat). In the first experiment, cells were transiently transfected with TIM-1 constructs lacking specific domains of the TIM-1 protein, and then TIM-1 was cross-linked as described above. First, FACS analysis was used to demonstrate cell surface expression of the TIM-1 domain mutants. Transfection of TIM-1 lacking the IgV domain (TIM-1-ΔIgV) was demonstrated using mAb AKG7 which recognizes the mucin domain of the protein. Expression of TIM-1-ΔIgV was similar to that of transfected wild-type TIM-1 when detected using this mAb (Fig. 6a). The cytoplasmic-deleted mutant TIM-1 (TIM-1-Δcyto) was detected using mAb ARD5. Expression of TIM-1-Δcyto was similar to that of transfected wild-type TIM-1 when detected using this mAb (Fig. 6a). The transfected cells were incubated either with anti-CD3 mAb or anti-TIM-1 mAb ARD5 to cross-link cell surface proteins. Anti-CD3 cross-linking induced similar levels of Zap70 phosphorylation in each of the transfected cells, while ARD5 cross-linking of TIM-1 only induced Zap70 phosphorylation when full-length wild-type TIM-1 was expressed (Fig. 6b). Because ARD5 recognizes the IgV domain of TIM-1, the result using the TIM-1-ΔIgV construct was as expected. Importantly, up-regulation of Zap70 phosphorylation did not occur in the absence of the TIM-1 cytoplasmic domain (Fig. 6b) indicating that this TIM-1 activity was mediated via intracellular signaling. Similar results were obtained in experiments to detect ITK phosphorylation, although low and variable amounts of ITK phosphorylation were observed, presumably due to the reduced level of expression of TIM-1 on transfected cells as compared with the stable cell line (data not shown). Next, we transfected Jurkat cells with TIM-1 constructs in which the tyrosine at amino acid residue 350 was mutated to alanine to investigate the requirement for tyrosine phosphorylation in transducing the TIM-1 signal. mAbs ARD5 and AKG7 were used to show the efficiency of expression of these constructs (Fig. 6c) which was as good or better than wild-type TIM-1 as assessed by staining the wild-type transfectants (JT1wt, Fig. 6a). Transfected cells were incubated with mAb ARD5 for 5 min, subjected to anti-phosphotyrosine immunoprecipitation, then analyzed by Western blot using biotinylated AKG7 for detection of TIM-1. Mutation of tyrosine 350 markedly reduced the level of TIM-1 phosphorylation detected, as shown using lysates made from two wild-type TIM-1 transfectants and two independent TIM-1-Y350A transfectants (JT1a1 and JT1a2; Fig. 6d). Together, these results suggest that TIM-1 tyrosine phosphorylation may be involved in mediating the observed effects on TCR downstream signaling. Demonstration of the requirement for TIM-1 phosphorylation and identification of the relevant signaling molecule(s) involved in augmenting TCR signaling will require additional investigation.
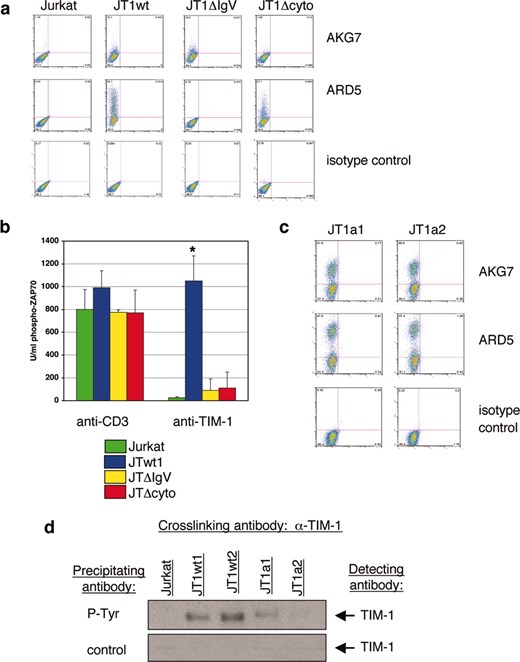
Mutant TIM-1 overexpression does not induce T cell activation signals. a, Wild-type TIM-1 (JTwt1), or domain deleted TIM-1 (lacking the IgV domain: JT1ΔIgV; lacking the cytoplasmic domain: JT1Δcyto) were transfected into Jurkat cells, and protein expression was analyzed by FACS using anti-TIM-1 mAbs AKG7 or ARD5. TIM-1 expression is assessed in the FL-2 channel (y-axis); the FL-1 channel (x-axis) is unused. b, Jurkat cells and TIM-1 transfectants (JTwt1, JT1ΔIgV, JT1Δcyto) were incubated with anti TIM-1 mAb ARD5 or anti-CD3 mAb for 5 min, whole cell lysates were made, and analyzed for phosphorylated Zap70 expression. Mean and SE of triplicate samples are shown. *, p < 0.001 by test of mean equivalence, compared with mutated samples. c, Mutant TIM-1 Y350A constructs (JT1a1, JT1a2) were transfected into Jurkat cells, and protein expression was analyzed by FACS using anti-TIM-1 mAbs AKG7 or ARD5. TIM-1 expression is assessed in the FL-2 channel (y-axis); the FL-1 channel (x-axis) is unused. d, Jurkat cells and TIM-1 transfectants (JTwt1, JTwt2, JT1a1, JT1a2) were incubated with anti-TIM-1 mAb ARD5 for 5 min. Whole cell lysates were made and immunoprecipitated with anti-phosphotyrosine beads or control beads. Samples were run on SDS PAGE gels, blotted, and probed for TIM-1 using biotinylated AKG7 mAb. All data shown are representative of at least three independent experiments.
Overexpression of TIM-1 in primary human CD4+ T cells causes rapid tyrosine phosphorylation of TIM-1, induction of T cell signaling, and enhances cytokine production
To determine whether we could recapitulate the observations made using Jurkat T cells with primary human CD4+ T cells, those cells were isolated from peripheral blood obtained from normal donors. We determined that TIM-1 could be detected at the mRNA level, but not at the protein level in resting human CD4+ T cells from a number of donors (Fig. 7, a and b, and data not shown). Therefore, we transiently transfected wild-type TIM-1 into primary CD4+ T cells for these experiments. In a preliminary experiment using primary human CD4+ T cells, we performed mock transfections with empty vector control plasmid and analyzed Zap70 phosphorylation by immunoprecipitation with anti-phosphotyrosine beads or control beads, followed by Western blot detection of Zap70. No effect of mock transfection on Zap70 phosphorylation was observed (data not shown). Using the CBA method, we found that, as in the Jurkat cell lines, TIM-1 overexpression in primary cells caused an increase in downstream TCR signaling components as illustrated by the dramatic increase in levels of phosphorylated Zap70 and phosphorylated ITK (Fig. 7, c and d). Also, TIM-1 was found to be tyrosine phosphorylated in primary cells following engagement with anti-TIM-1 Ab ARD5, as was seen in the stably transfected Jurkat cell lines (Fig. 7e). Therefore, TIM-1 activity in Jurkat T cells is recapitulated in primary human CD4+ T cells.
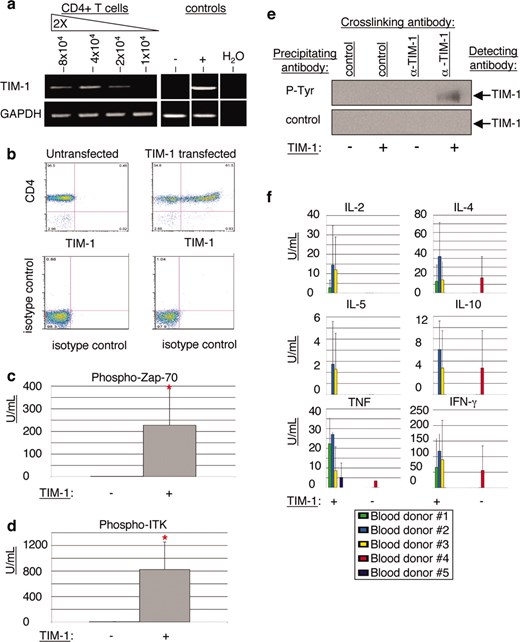
TIM-1 expression in primary CD4+ T cells induces T cell activation signals, TIM-1 phosphorylation, and cytokine secretion. a, RNA samples from freshly isolated human CD4+ T cells were serially diluted and subjected to real-time RT-PCR to detect human TIM-1 RNA. 769P cells served as the positive control (+) and A20 cells as the negative control (−). b, Wild-type TIM-1 was transiently transfected into primary human CD4+ T cells. TIM-1 protein expression from one representative donor is shown by FACS analysis using anti-CD4 and biotinylated mAb AKG7. TIM-1 expression is assessed in the FL-2 channel (x-axis); the FL-1 channel (y-axis) shows CD4 expression. Isotype controls for both channels are shown in the lower panel. c and d, Expression levels of phosphorylated Zap70 (c) and phosphorylated ITK (d) were analyzed in untransfected primary human CD4+ T cells (−) and TIM-1-transfected primary human CD4+ T cells (+). Data shown represent mean and SD of triplicate samples from five individual donors. *, p < 0.001 by test of mean equivalence. The experiment was performed three times with similar results. e, Untransfected (−) or TIM-1-transfected (+) CD4+ human T cells were incubated with anti-TIM-1 mAb ARD5 or isotype control mAb for 5 min. Whole cells lysates were immunoprecipitated with anti-phosphotyrosine beads or control beads, run on SDS PAGE gels, blotted, and probed with biotinylated anti-TIM-1 mAb AKG7. f, Untransfected (−) or TIM-1-transfected (+) CD4+ human T cells from five individual donors were cultured for 48 h, and supernatants were collected for FACS analysis using Th1/Th2 CBA beads. Data shown represent mean and SD of triplicate samples from five individual donors. Although individual donors did vary in responsiveness, the experiment was performed twice with similar results.
To understand the consequence of TIM-1 activity, we measured cytokine secretion into the cell culture supernatant 48 h after transfection, comparing TIM-1 expressing and nonexpressing primary human CD4+ T cells from the same individual donors. In four of five donors tested, TIM-1 expression led to an increase in both Th1 and Th2 cytokine expression (Fig. 7f). Although variability in the assay was considerable, it is important to stress that four of five donor primary T cells, which in the control culture expressed no cytokines, were induced to secrete cytokines upon TIM-1 transfection. This is a clear demonstration that TIM-1 plays a physiological role in controlling T cell activity and the data are consistent with the signaling events observed. Of interest, one donor (no. 4) whose cells did express cytokines in the control culture, lost cytokine expression upon TIM-1 transfection, suggesting some regulatory control, T cell exhaustion, or other mechanism at work when TIM-1 is introduced to an (apparently) already activated T cell. Further work will be required to clarify the roles of TIM-1 in this type of assay.
Discussion
Although the TIM-1 gene has been linked to atopic disease susceptibility in a number of studies (1, 2, 3, 4, 5, 6), our understanding of the function of the TIM-1 protein has been complicated by several issues. First, TIM-1 has been implicated as both a positive and negative regulator of immune responses in mice, depending on the reagents used to study the pathway. As outlined above, anti-TIM-1 mAbs and TIM-1-Fc fusion proteins have been described as having opposing effects on immune responses in a number of systems (11, 12, 13, 14, 18). We have recently shown that anti-murine TIM-1 mAbs can block or exacerbate immune responses in mice depending on the specific epitope targeted (29). Second, the murine TAPR locus contains five genes that are absent from the human locus, including TIM-2 which is very closely homologous to TIM-1 (1). We and others have shown that TIM-2 is a negative regulator of T cell activity (15, 16, 21) and a recent study has shown that TIM-2 can function by blocking CD3/CD28-mediated costimulation of T cells (21). It is possible that TIM-2 acts to block TIM-1-mediated signaling in mice as well. As TIM-2 has no homolog in the human genome, we thus considered that the regulation and perhaps function of TIM-1 may differ in rodents and primates. Finally, it is clear that the TIM-family is promiscuous in its use of natural ligands, which include a semaphorin (TIM-2 ligand), ferritin-H (TIM-2 ligand), a galectin (TIM-3 ligand), and another TIM protein called TIM-4 (TIM-1 ligand) (12, 22, 23, 24). We have been unable to convincingly demonstrate interaction of TIM-4 with TIM-1 by physical measures (e.g., surface plasmon resonance, FACS) and only weak interaction by ELISA and have not been able to demonstrate any TIM-4-mediated signaling events through binding TIM-1 (data not shown). This may reflect differing purity or aggregation state of TIM-1 and TIM-4 fusion proteins, which can impact low-affinity interactions.
In light of the complexity outlined above, we chose an in vitro system and specific anti-human TIM-1 mAbs to elucidate human TIM-1 function. Our major finding is that TIM-1 expressed in human T cells colocalizes and indeed coimmunoprecipitates with CD3, a critical component of the TCR. Colocalization can be triggered by either CD3 cross-linking or by TIM-1 cross-linking, as shown by confocal microscopy ((Fig. 5). These results suggest that TIM-1 can be recruited to the TCR complex that forms upon T cell activation and are mechanistically consistent with the signaling results described. Thus, TIM-1 overexpression and cross-linking is sufficient to increase TCR downstream signaling via phosphorylation of Zap70 and ITK (Figs. 2 and 3). Importantly, this effect was seen not only in the transformed Jurkat cell line but also in primary human CD4+ T cells isolated from normal donors ((Fig. 6). These results are in agreement with a recent study in which reporter constructs were used to study promoter engagement after murine TIM-1 overexpression (18). In this study, it was shown that TIM-1 expression induced transcription from the IL-4 and NFAT/AP-1 promoters, signals which would be expected to be induced upon TCR activation.
The induction of ITK phosphorylation in a TIM-1-regulated manner is particularly interesting in light of the evidence that TIM-1 is linked to Th2 responses, airway hyperresponsiveness, and atopic disease in mouse and human genetic analyses (25). It appears that TIM-1 expression induced physical interaction of ITK and PI3K although what other molecules are required to form the complex is not yet known (Fig. 3d). Association of ITK and PI3K has been described previously in the context of CD28 signaling (26) and ITK is proposed to integrate TCR and calcium dependant signaling cascades in T cells (27). Furthermore, ITK protein expression is increased during the commitment of Th0 cells to Th2 cells and the ITK promoter contains binding sites for the canonical regulator of Th2 differentiation, GATA-3 (28). Thus, ITK gene-deficient mice have diminished responses to intracellular pathogens normally controlled by Th2 immunity and have decreased allergic airways responses to allergen challenge (28). The activity of ITK is therefore consistent with the hypothesis that TIM-1 is a driver of Th2 T cell differentiation. In contrast, we and others have noted that in mouse systems TIM-1 enhances T cell proliferation and Th2 effector function (i.e., cytokine production) without necessarily dampening Th1 activity (15, 18). Thus, whether phosphorylation of ITK is sufficient to drive Th2 differentiation during TIM-1-induced T cell activation remains uncertain. In the mouse system, we favor the hypothesis that TIM-1 functions to preferentially enhance the activity or survival of Th2 T cells after their initial differentiation has taken place (29). This model is consistent with the observation that TIM-1 is highly induced on mouse and human T cells after several rounds of Th2 differentiation in vitro (11, 19). The data are also consistent with the pattern of cytokine expression induced in human primary T cells upon TIM-1 transfection, as both Th1 and Th2 cytokines were expressed, suggesting that TIM-1-mediated activation amplified the existing T cell response, rather than causing skewing to a strictly Th2 state (Fig. 7f). However, this is an admittedly artificial system based on TIM-1 transfection, and these questions will have to be addressed under circumstances where human TIM-1 is expressed on T cells naturally, and in the context of normal (i.e., costimulatory) T cell activation. It will be of particular interest to compare the effect of TIM-1 engagement on various T cell subsets including naive T cells and Th0-, Th1-biased and Th2-biased effector T cells. In this regard, it is important to note that the available data suggest that TIM-1 is preferentially expressed on the Th2 subset (11) and therefore would be expected to predominantly enhance Th2 cytokine levels.
Our results clearly show positive regulation of T cell activity by TIM-1 expression in human T cells. In light of the human genetic data linking TIM-1 to the development of asthma, these results implicate TIM-1 as a critical and novel amplifier of TCR signaling, that may act on Th2 immune responses by up-regulating phosphorylation of ITK. A critical question to be addressed is the manner by which the known genetic variants of TIM-1 might impact the development of atopic disease. Investigation of the effect of the mucin domain variants on TCR signaling is clearly needed. Furthermore, the kinase responsible for the phosphorylation of TIM-1 itself, as well as the identity of other signaling mediators involved in this pathway, remain to be discovered. The identification of TIM-1 as an important mediator of T cell activation should further stimulate the development of functional antagonists of TIM-1, with the hope that these will yield therapeutics for use in asthma, atopic dermatitis, and other Th2-driven pathologies.
Acknowledgments
We thank Jose Sancho for FACS analyses, Chris Tonkin, Michele McAuliffe and Richard Tizard for oligonucleotide production and DNA sequence analyses, Patricia McCoon and Rachel Rennard for DNA constructs, Norm Allaire for assistance with real-time PCR, Chris Ehrenfels for assistance with confocal microscopy, and Ann Ranger for insightful discussion.
Disclosures
L. L. Binné, M. L. Scott, and P. D. Rennert were employees of Biogen Idec when this work was performed, and P. D. Rennert and M. L. Scott are or were stockholders in Biogen Idec.
References
McIntire, J. J., S. E. Umetsu, O. Akbari, M. Potter, V. K. Kuchroo, G. S. Barsh, G. J. Freeman, D. T. Umetsu, R. H. DeKruyff.
McIntire, J. J., S. E. Umetsu, C. Macaubas, E. G. Hoyte, C. Cinnioglu, L. L. Cavalli-Sforza, G. S. Barsh, J. F. Hallmayer, P. A. Underhill, N. J. Risch, et al.
Gao, P. S., R. A. Mathias, B. Plunkett, A. Togias, K. C. Barnes, T. H. Beaty, S. K. Huang.
Graves, P. E., V. Siroux, S. Guerra, W. T. Klimecki, F. D. Martinez.
Chae, S. C., J. H. Song, J. C. Heo, Y. C. Lee, J. W. Kim, H. T. Chung.
Chae, S. C., J. H. Song, Y. C. Lee, J. W. Kim, H. T. Chung.
Noguchi, E., J. Nakayama, M. Kamioka, K. Ichikawa, M. Shibasaki, T. Arinami.
Matricardi, P. M., F. Rosmini, L. Ferrigno, R. Nisini, M. Rapicetta, P. Chionne, T. Stroffolini, P. Pasquini, R. D’Amelio.
Kaplan, G., A. Totsuka, P. Thompson, T. Akatsuka, Y. Moritsugu, S. M. Feinstone.
Nakajima, T., S. Wooding, Y. Satta, N. Jinnai, S. Goto, I. Hayasaka, N. Saitou, J. Guan-Jun, K. Tokunaga, L. B. Jorde, et al.
Umetsu, S. E., W. L. Lee, J. J. McIntire, L. Downey, B. Sanjanwala, O. Akbari, G. J. Berry, H. Nagumo, G. J. Freeman, D. T. Umetsu, R. H. DeKruyff.
Meyers, J. H., S. Chakravarti, D. Schlesinger, Z. Illes, H. Waldner, S. E. Umetsu, J. Kenny, X. X. Zheng, D. T. Umetsu, R. H. DeKruyff, et al.
Encinas, J. A., E. M. Janssen, D. B. Weiner, S. A. Calarota, D. Nieto, T. Moll, D. J. Carlo, R. B. Moss.
Mesri, M., G. Smithson, A. Ghatpande, A. Chapoval, S. Shenoy, F. Boldog, C. Hackett, C. E. Pena, C. Burgess, A. Bendele, et al.
Rennert, P. D., T. Ichimura, I. D. Sizing, V. Bailly, Z. Li, R. Rennard, P. McCoon, L. Pablo, S. Miklasz, L. Tarilonte, J. V. Bonventre.
Chakravarti, S., C. A. Sabatos, S. Xiao, Z. Illes, E. K. Cha, R. A. Sobel, X. X. Zheng, T. B. Strom, V. K. Kuchroo.
Bailly, V., Z. Zhang, W. Meier, R. Cate, M. Sanicola, J. V. Bonventre.
de Souza, A. J., T. B. Oriss, J. O’Malley, K. A. Ray, L. P. Kane.
Khademi, M., Z. Illes, A. W. Gielen, M. Marta, N. Takazawa, C. Baecher-Allan, L. Brundin, J. Hannerz, C. Martin, R. A. Harris, et al.
Thome, M., P. Duplay, M. Guttinger, O. Acuto.
Knickelbein, J. E., A. J. de Souza, R. Tosti, P. Narayan, L. P. Kane.
Zhu, C., A. C. Anderson, A. Schubart, H. Xiong, J. Imitola, S. J. Khoury, X. X. Zheng, T. B. Strom, V. K. Kuchroo.
Kumanogoh, A., S. Marukawa, K. Suzuki, N. Takegahara, C. Watanabe, E. Ch’ng, I. Ishida, H. Fujimura, S. Sakoda, K. Yoshida, H. Kikutani.
Chen, T. T., L. Li, D. H. Chung, C. D. Allen, S. V. Torti, F. M. Torti, J. G. Cyster, C. Y. Chen, F. M. Brodsky, E. C. Niemi, et al.
Umetsu, D. T., R. H. Dekruyff.
Lu, Y., B. Cuevas, S. Gibson, H. Khan, R. LaPushin, J. Imboden, G. B. Mills.
Liu, K. Q., S. C. Bunnell, C. B. Gurniak, L. J. Berg.
Schwartzberg, P. L., L. D. Finkelstein, J. A. Readinger.
Footnotes
The costs of publication of this article were defrayed in part by the payment of page charges. This article must therefore be hereby marked advertisement in accordance with 18 U.S.C. Section 1734 solely to indicate this fact.
