


Abstract
Genetic modification of T cells to express chimeric antigen receptors (CAR, CAR-T cells) enable them to recognize the specific antigen on tumor surface and then eliminate the tumor. T lymphocyte ion channels such as Kv1.3, KCa3.1 and CRAC influence T cell activation and proliferation by regulating Ca2+ signaling, as well as other effector functions such as cytokine release, migration and even target cell killing. Here we established two CAR cell lines (using CEM T cell line and primary T cells) recognizing CD19 antigen on surface of Raji B and human breast cancer MCF-7 expressing CD19 cell lines. First, we exposed that KCa3.1 and Kv1.3 functional expressions of CEM cells were comparable to those in T cells, which demonstrated their suitability for primary T cell mimics. Next, we studied the tumor cell killing efficiency of CAR-T and CEM-CAR cells in monolayer and 3D spheroid tumor models. We could show that CAR expressing cells specifically eliminate tumor cells regardless of tumor models. Furthermore, the application of Kv1.3 (Vm24) and KCa3.1 (TRAM34) inhibitors significantly improved the tumor eradication efficiency for both CEM-CAR and CAR-T cells in spheroids, however, the infiltration rate was not influenced upon addition of antagonists. We could conclude that modification of Kv1.3 and KCa3.1 ion channels could contribute to a more effective immunotherapy of solid tumor.
Introduction
CAR-T cells generated by genetic manipulation of T cells with chimeric antigen receptor.1–3 CAR-T cells are able to recognize specific antigens on the tumor surface and thus eliminate the tumor. CAR consists of four regions: an antigen recognition domain (scFv), which consists of variable heavy (VH) and light (VL) chains of an immunoglobulin, an extracellular hinge region, a transmembrane domain and 1 or more intracellular T cell activating or stimulating domains. Specific antigen recognition by CAR-T cells is mediated through scFv, which leads to major histocompatibility complex (MHC)-independent activation. Different generations of CAR-T cells have been created to improve their effectiveness in the fight against cancer.2,4,5 The first generation of CAR-T cells has a single CD3ζ signaling domain. The second generation CARs encode a co-stimulatory domain such as 4-1BB/CD28, while the third generation of CARs contains several co-stimulatory signaling domains.2,4,6 The fourth generation CARs are designed to release transgenic cytokines upon activation, thereby facilitating more efficient effector functions.2,5 “New generation” or fifth generation CARs based on second generation CARs contain a truncated cytoplasmic IL-2 receptor β-chain domain with a binding site for the transcription factor STAT3, thus are able to simultaneously trigger TCR (T cell receptor), co-stimulatory and cytokine signaling that will lead to T cell activation and proliferation.4,5 CAR-T therapy has a long-lasting antitumor effect, with the best results in pediatric and adult relapsed/refractory acute B-cell lymphoblastic leukemia.6,7 The efficiency and safety of CAR-T cell therapies still need to be developed due to toxicity and limited response in solid tumors.2,7–10 Laboratories are already developing CAR constructs, which are proved to be more efficient and safer compared to conventional ones, and possess reversible on/off and universal CARs with protein adapters.10–14 Nanoparticles expressing anti-PD-L1 and loaded with STING (interferon gene stimulator pathway) antagonist have been developed that can alter TME, which contributes to enhanced CAR-T cell activity and can prevent CAR-T cell exhaustion.15
The recognition of specific antigens of T cells induces clonal proliferation, differentiation ensuring the adaptivity of the immune system.16 Ion channels of T lymphocyte such as Kv1.3 (voltage-gated K+ channel 1.3), KCa3.1 (calcium-activated K+ channel 3.1) and CRAC (Ca2+ release-activated Ca2+ channel) are involved in the regulation of many functions, such as antigen presentation-induced Ca2+ signaling, which is required for T cell proliferation, cytokine release, migration, and tumor killing.17–19 Antigen recognition by the TCR/CD3 receptor complex, thereby triggering an intracellular signaling cascades, as a consequence of which IP3 (inositol trisphosphate) produced by PLCγ (phospholipase) is released, triggering increase in cytoplasmic Ca2+ in two phases. As a result, the Ca2+ is released from the endoplasmic reticulum (ER) store via IP3 receptors in the ER membrane, which activates the STIM1 subunit of the CRAC channel and Ca2+ ions flow from the extracellular space into the cell via the CRAC. The well-coordinated operation of the Kv1.3 and KCa3.1 ion channels maintains the store-operated Ca2+ entry (SOCE) as they maintain a constant steady-state driving force for Ca2+ influx and stabilize the membrane potential at a sufficiently negative value.20,21 The Kv1.3 channel is activated by membrane depolarization, whereas KCa3.1 is activated by an increase in cytosolic Ca2+ concentration. The sustained Ca2+ level allows NFAT (nuclear activated T cell factor) to translocate to the nucleus, thereby promoting the transcription of several genes such as interleukin-2, granzyme B (GrB), perforin.17,22
The Kv1.3 channel is involved in regulating the pathway responsible for GrB production and secretion by CD8+ T cells.21,22 In mouse models, it has been shown that upregulation of Kv1.3 expression reduced melanoma tumor growth by tumor-specific CD8 cells.23 NK cells (natural killer cells) and CTLs (cytotoxic T cells) have been reported that optimal target cell elimination requires interaction between CRAC and KCa3.1 channels.24–26 In CD8+ CAR-T cells (HER2 antigen specific) the efficacy of target cell elimination was also influenced by the activity of Kv1.3 and KCa3.1 channels.27 Immune surveillance by the immune system often fails due to reprogramming of pathways that ensure tumor cell survival.21
Tumor-infiltrating lymphocytes (TILs) and CD8+ T cells are less efficient due to the immunosuppressive mechanisms, barriers of the tumor microenvironment (TME), thus influencing the elimination of cancer cells.28 TME is characterized by increased extracellular K+, H+, ATP and adenosine levels and hypoxia, which may inhibit effector functions, through modification of ion channels (Kv1.3, KCa3.1, CRAC) and immunosuppressive barriers include myeloid-derived suppressor cells (MDSC), regulatory T cells, tumor-associated macrophages (TAM) or neutrophils (TAN), suppressive soluble factors and cytokines.29 Furthermore, programmed cell death ligand 1 (PD-L1) on tumor cells impairs effector function of CD8+ cells. PD-L1 binds to the PD-1 receptor on T cells, thereby inducing KCa3.1 inhibition via the PI3K (phosphatidylinositol 3-kinase) pathway.21,30,31
The use of 2D model systems has many limitations, while tumor xenotransplantation is a costly and time-consuming procedure. This problem could be solved by developing 3D tumor models that mimic the characteristics of native tumor, TME and can contain multiple cell types. Tumor spheroids larger than 500 μm in diameter are often characterized by hypoxic areas and necrotic centers and produce factors that enhance malignant cell proliferation and survival. Spheroids have many applications, they can be used to model TME and angiogenesis, as xenograft models and biobanks, for drug screening and to aid the development of therapeutic agents.32
In this study, we elucidated the role of Kv1.3 and KCa3.1 ion channels in tumor infiltration and tumor killing of CAR-T cells. We have assessed the role of Kv1.3/KCa3.1 in effector function of CD19-specific CAR-T cells in monolayer culture and spheroid tumor models. Our results support the evidence that modification of Kv1.3 and KCa3.1 ion channels can contribute to a more successful CAR-T cell therapy.
Materials and methods
Cells and culture conditions
HEK293T packaging cells, T lymphoblast Jurkat-E6-1 (later Jurkat), CCRF-CEM, CD19+ B lymphoblastoid Raji and human breast cancer MCF-7 are from American Type Culture Collection (ATCC, Manassas, Virginia, USA). HEK293T cells were cultured in Dulbecco's Modified Eagle Medium (DMEM) supplemented with 2 mmol/l GlutaMAX and 10% Fetal Calf Serum (FCS) and antibiotics. Jurkat-E6-1, Raji and MCF-7 cells were cultured in RPMI (Roswell Park Memorial Institute) medium supplemented with 2 mmol/l GlutaMAX and 10% FCS and antibiotics. CCRF-CEM cells were cultured in ATCC-formulated RPMI-1640 medium (ATCC, Manassas, Virginia, USA) supplemented with 10% fetal bovine serum (FBS) and antibiotics. Primary human T cells and CAR-T cells were cultured in RPMI medium supplemented with 15 mM HEPES, 2 mmol/l GlutaMAX, 10% FCS and antibiotics. All cells and cell lines were maintained in a humidified atmosphere containing 5% CO2 at 37 °C.
PBMC isolation and activation
Peripheral blood mononuclear cells (PBMCs) were isolated from whole blood as described previously.21,33 Briefly, PBMCs were isolated by centrifugation of whole blood using a SepMate PBMC isolation tube (STEMCELL Technologies, Cambridge, Massachusetts, USA) with the Ficoll–Paque (GE Healthcare Bio-Sciences, Piscataway, New Jersey, USA) density gradient. PBMCs were separated from freshly drawn human blood, diluted twofold with HBSS (Hank’s Balanced Salts Modified: Sigma H4891, Ca2+- and Mg2+-free, 15 mM HEPES was added, pH = 7.4). We measured 15 ml of Histopaque-1077 into the SepMateTM PBMC isolation tube (STEMCELL Technologies, USA). The diluted blood was added to the SepMate tube onto the Ficoll layer. After centrifugation, the opalescent part, which contained peripheral mononuclear cells (PBMC), was transferred into a 50 ml tube and washed twice with HBSS and resuspended in RPMI medium (Sigma-Aldrich Ltd, Budapest, Hungary). The peripheral blood mononuclear cells (PBMCs) were maintained in RPMI medium (Sigma-Aldrich Ltd, Budapest, Hungary) supplemented with 10% Fetal Calf Serum, 15 mM HEPES, 2 mM L-glutamine, 1 mM Na-pyruvate and 200 units of streptomycin/penicillin. Activation was performed for 48 h in a 24-well cell culture plate coated with mouse anti-human CD3 and CD28 antibodies (both 10 µg/ml, BioLegend, San Diego, California, USA).21 On day 2, the expansion of T cells was subsequently supported with human interleukin-7 (IL-7; 10 ng/ml) and human interleukin-15 (IL-15; 5 ng/ml) (Miltenyi Biotec, Bergisch Gladbach, Germany). The study and informed consent forms were approved by the Regional and Institutional Research Ethical Board of the University of Debrecen (RKEB/IKEB No.: 6627-2023).
Retroviral transduction
In total, 72 h prior to transfection 3.5 × 10⁵ HEK293T cells were seeded on a 10 cm culture dish in DMEM supplemented with 10% FBS and 1% L-glutamine (LifeTechnologies, Carlsbad, CA, USA). Viral vector particles were produced by transfection of HEK293T cells with the CD19-specific CAR-encoding pBMN retroviral plasmid, the MSCV-hCD19 (127889; Addgene, Watertown, Massachusetts, USA) plasmid, the PAX2 packaging plasmid and VSVG plasmid using jetPrime transfection reagent (Polyplus, Illkirch, France). The backbone of the chimeric antigen receptor encodes CD19-scFv, CD8 transmembrane region, CD28, 4-1BB costimulatory and CD3ζ intracellular signal domain and sGFP (superfolder green fluorescent protein). Supernatants containing the retrovirus were collected after 48 h. The virus binding plate was prepared by centrifugation. MCF-7, CCRF-CEM and T cells were transduced (2.5 × 10⁴ cells/cm2), with retroviral particles (250 μl/cm2) on RetroNectin-coated (Takara, Kusatsu, Japan) plate, supplemented with IL-7, IL-15 in case of T cells. Following 72 h incubation, cells were used for further experiments.
Electrophysiology
The electrophysiological measurement were performed as described previously.21 KCa3.1 and Kv1.3 currents in CEM-CAR cells were measured in the whole-cell voltage-clamp configuration at room temperature (23–25 °C) using a Multiclamp 700 B/Axopatch 200 A amplifier connected with an Axon Digidata1440 digitizer (Molecular Devices, Sunnyvale, California, USA) to the personal computers. pClamp 10.6 software (Molecular Devices, Sunnyvale, California, USA) was used for current recording and subsequent analysis. The aspartate bath solution contained the following (in mmol/l): 145 Na-aspartate, 5 KCl, 2.5 mM CaCl2, 1.0 MgCl2, 5.5 glucose, 10 HEPES (pH = 7.4). Patch-clamp pipette filling solution composition was as follows (in mM): 145 K-aspartate, 10 K2EGTA, 8.5 CaCl2, 2 MgCl2, 10 HEPES (free Ca2+ concentration 1 µM, pH = 7.2). Patch-clamp pipettes (4–6 MΩ) were pulled from GC150F-15 borosilicate capillaries (Harvard Apparatus, Kent, UK). Currents were elicited by a 200 ms ramp protocol ranging from −120 to +50 mV from a holding of −70 mV in every 15 s. The whole-cell conductance of KCa3.1 channels (GKCa3.1) and Kv1.3 (GKv1.3) channels was calculated as we described before.21 For each cell, the conductance was calculated as the average of 3 subsequent measurements.
Pharmacological characterization
For pharmacological analysis, the following drugs were added to the cells: Vm24 (1 nM, specific Kv1.3 blocker) and TRAM34 (specific for KCa3.1, 200 nM). TRAM34 was dissolved in DMSO and then diluted in a high K+ solution containing 150 mM KCl, 1 mM MgCl2, 2.5 mM CaCl2, 5.5 mM glucose, and 10 mM HEPES, pH of 7.35. The normal extracellular solution was composed of 145 mM NaCl, 5 mM KCl, 1 mM MgCl2, 2.5 mM CaCl2, 5.5 mM glucose, and 10 mM HEPES, with a pH of 7.35. Solutions were exchanged with a gravity-driven perfusion system. Vm24 were dissolved in aspartate bath solution (see above). The composition of the pipette solution for pharmacological measurement was the same as for the patch-clamp measurements. TRAM34 was obtained from Heike Wulff (UC Camp Davis, USA) recombinant Vm24 was produced in our laboratory.
Intracellular Ca2+ measurements
Intracellular Ca2+ responses were measured as described previously.21,33 Briefly, the NT (non transduced) CEM, CEM-CAR and NT T cells were loaded with 1 μM FURA-2-AM (Thermo Fisher Scientific Inc., Budapest, Hungary). The cells were perfused with 0 mM Ca2+ solution (143.3 mM NaCl, 4.7 mM KCl, 10 mM HEPES, 5.5 mM glucose, 1 mM MgCl2, 0.1 mM EGTA, pH 7.35) to check the cells’ integrity and then 1 μM thapsigargin (TG) (Thermo Fisher Scientific Inc.) containing 0 mM Ca2+ solution to deplete of ER and then 2 mM Ca2+ (143.3 mM NaCl, 4.7 mM KCl, 10 mM HEPES, 5.5 mM glucose, 2 mM CaCl2, 1 mM MgCl2, pH 7.35) containing 1 μM TG to activate intracellular Ca2+ elevation through CRAC. To test the effect of the ion channel inhibitors on the intracellular Ca2+ responses of NT T-cells we added 1 nM Vm24/1 µM TRAM34 to the 1 μM TG containing 2 mM Ca2+ solution. The amplitude of Ca2+-response for NT CEM, CEM-CAR, NT T cells was defined as the difference between peak and baseline (was calculated as the mean of ratios before addition of 2 mM Ca2+ along with TG) of 340 nm/380 nm intensity ratio of FURA-2.
Flow cytometry
CD19-specific CAR expression was confirmed by sGFP positivity. For CD19 positivity analysis cells were spin (400×g, 5 minutes, 4 °C), fixed with 1% PFA and incubated for 10 min on ice and dark. Cell were spun and washed with 1x PBS. For blocking of Fc receptors, we pre-incubated the cells with purified anti-CD16/CD32 antibody (1 µg/106 cells in 100 µl volume 1x PBS cointaining 10% BSA) for 5 to 10 min on ice. Cells were spun (400×g), washed with PBS, and stained for 30 min on ice with the Alexa Fluor 647 anti-human CD19 (catalog no. 302220, HIB19; Biolegend) antibody. Analysis was performed on at least 10,000 cells per sample using a NovoCyte 3000RYB (ACEA Biosciences, San Diego, California, USA) instrument and NovoExpress software (ACEA Biosciences, San Diego, California, USA).
Calcein red killing assay
To test cytotoxicity target cells were resuspended in 1 μM Calcein Red AM solution. This is followed by 30 min incubation at room temperature, in the dark. Cells were spun (400×g, 5 min, RT), washed with 1x PBS and then resuspended in medium and incubated for 10 min before assay. Cells were plated into 8-well ibidi chamber (ibidi GmbH, Germany). Effector CEM-CAR and target Raji, MCF7 and CD19 MCF-7 cells were added at 2:1 E:T ratios, and cocultured with target cells for 3 h. To detect Calcein Red staining of target cells confocal snapshots were taken with Nikon confocal microscope (excitation: He-Ne laser line of 561 nm, detection: LP filter 576 nm). The mean Calcein Red fluorescence intensity of cells was determined with ImageJ 1.54F software.
Agarose-based spheroid formation
Jurkat, Raji and CD19 MCF-7 cells (0.5× 10⁴ cells/ml in 55 μl media) were pipetted into µ-Plate 96 Well 3D plates (ibidi GmbH, Germany) coated with 1% agarose gel, as detailed in manufacturer’s protocol. The suspensions were centrifuged at 1000×g for 10 min at room temperature and the cell pellet was cultured for 5 to 7 d. CD19- spheroids were generated from CD19 negative Jurkat cell line.
Spheroid-based tumor infiltration and killing assay
Infiltration and killing capacity of CEM-CAR and CAR-T cells in three-dimensional cell cultures were determined by Live-or-Dye 640/662 (Biotium, Fremont, California, USA) incorporation assay. Spheroids were cocultured with effector cells for 24 h, number of CEM-CAR/CAR-T cells was equal to the initial number of target cells used for spheroid growth. Ion channel inhibitors, such as TRAM34 (1 µM), Vm24 (10 nM) were added to the required samples. Spheroids incubated without effector cells served as controls to test the cytotoxic-effect of TRAM34, Vm24 and DMSO. After 24 h, 3D cocultures were labeled with Live-or-Dye 640/662 stain, as detailed in manufacturer’s protocol. The z-stack images of spheroids were taken at 10 µm thickness with Nikon-STORM confocal microscope. ImageJ was used to calculate the incorporation of Live-or-Dye 640/662 stain and sGFP positive CAR-T cells into the spheroids.34 The total cell number (total cell # (TC)), number of CEM-CAR or CAR-T (# of CAR-T cells (CC) cells and Live-or-Dye positive cells (number of dead cells (DC)) were determined for every slice, then summed up for the entire spheroid. At least 3 spheroids per condition were analyzed. From the cell numbers we determined the infiltration rate (IR) (IR = CC/(TC-CC)), the killing rate (KR) (KR = DC/(TC-CC)) and the killing efficiency (KE) (KE = KR/IR) of CEM-CAR and CAR-T cells. For the cytotoxicity assay, the percentage of dead cells (Live-or-Dye positive cells) was calculated from total cell and dead cell numbers. To monitor the effect of antagonists on the proliferation we calculated changes in TC and diameter (µm) of spheroids in the presence and absence of ion channel inhibitors (Vm24, TRAM34).
Statistical analysis
For statistical analysis and plotting, GraphPad Prism 9.3.1 software was used (GraphPad software, Inc., La Jolla, California, USA). For multiple group comparison, 1-way ANOVA or Kruskal-Wallis test was performed. Differences were considered significant at P < 0.05. Data was presented as mean ± standard error of the mean (SEM).
Results
Generation and validation of CEM-CAR and targetcells
The third generation sGFP-CD19-CAR construct was packaged into VSVG pseudotyped retrovirus particles and transduced into CCRF-CEM T cell lines, thereby generating CD19-specific CAR-T cell line (CEM-CAR). The transduction efficiency in the CEM population was over 60% in the CEM-CAR group (Fig. 1A), as assessed by flow cytometry on day 3 post-transduction. NT CEM cells (non-transduced) were used as control. To achieve a higher CAR positive cell rate, we sorted the GFP+ cells (CAR expressing CEM cells) and later on we used this homogenous cell population to establish various assays (∼ 98% expressed sGFP). Next, to select appropriate target cells for our CAR expressing cell, we confirmed the CD19 positivity of target Raji cells by labeling with mouse anti-human CD19 conjugated with Alexa Fluor-647. The whole population of Raji cells expressed the CD19 marker (Fig. 1B); as a negative control we stained the CD19- Jurkat cells. The hCD19 construct was transduced into MCF-7 breast cancer cell line, and the transduction efficiency was over 93% (Fig. 1C), which was confirmed by labeling with mouse anti-human CD19 conjugated with Alexa Fluor-647.
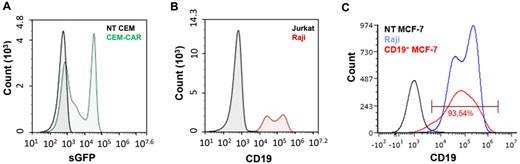
Representative flow cytometry histogram of CAR and CD19 expression. (A) The CD19-specific CAR expression confirmed by the fluorescent signal of sGFP in CEM cells (black: NT-CEM, green: CEM-CAR). (B) CD19 labelled Raji (red) and Jurkat (control, black) cells, antibody: mouse anti-human CD19-Alexa647. (C) CD19 MCF-7 (red), NT MCF-7 (black, non-transduced control) and Raji (blue) cells labeled with mouse anti-human CD19-Alexa647 antibody.
CEM-CAR cells express Kv1.3 and KCa3.1 channels
As we detailed before, both KCa3.1 and Kv1.3 play crucial role in various effector functions of T cells. Hence, we determined the activity of K+ ion channels, which influence the Ca2+ response, with patch-clamp method in CEM-CAR cells. We applied ramp protocol (ranging from -120 mV to + 50 mV) to record potassium-current in CEM-CAR cells (Fig. 2A): the current reversed at negative voltages (between −50 and −60 mV), and over ca. −50 mV a remarkable outward current was detected. We performed pharmacological tests with specific ion channel inhibitors (Vm24: Kv1.3, TRAM34: KCa3.1). Application of 1 nM Vm24 blocked the outward current completely (Fig. 2B, observe the difference of control and Vm24 treated traces (green line)). The recording of whole-cell current in high K+ solution in the presence and absence of TRAM34 demonstrated that current of functional KCa3.1 channels are present in the membrane of CEM-CAR cells (Fig. 2C). Comparison of Kv1.3 and KCa3.1 conductances in CEM-CAR, NT CEM and activated CEM cells did not detect significant differences between them (Fig. S1).
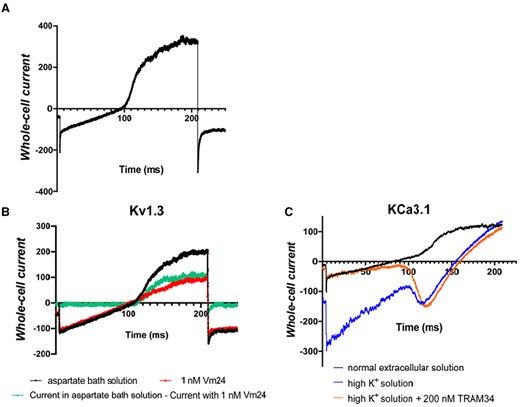
Biophysical and pharmacological characterization of Kv1.3 and KCa3.1 channels in CEM-CAR cells. (A) Whole-cell current trace recorded in CD19-CAR expressing CEM cell using 200-ms-long voltage-ramp protocol ranging from -120 mV up to +50 mV, holding potential was −70 mV (see Materials and methods). (B) Current traces were registered in the absence (black line) and presence of 1 nM Vm24 (red line) in aspartate bath solution using ramp protocol described in panel A. Green line is the difference of the black and red records exhibiting the Kv1.3 whole-cell current. (C) Current traces were recorded in normal extracellular solution (black line), then in high K+ solution (blue line) and finally in the presence of 200 nM TRAM34 dissolved in high K+ solution (orange line). The same voltage ramp protocol was used as in A and B.
CRAC activation is involved in several T cell effector function related pathways, and we investigated the Ca2+ response of CEM-CAR and control NT CEM cells induced by thapsigargin (TG) using FURA-2 Ca2+-imaging method. Representative recordings of TG-induced Ca2+ response of a CEM-CAR and a NT CEM cell is shown in Fig. S2A. Figure S2A (see insert graph) also reports that CEM-CARs had a significantly lower CRAC-specific response compared to the NT CEMs (P < 0.0001, n = 27 for NT CEM and 30 for CEM-CAR cells). These suggest that the presence of CAR influences Ca2+ influx through the CRAC channel, which may affect the effector function, as we reported before.27 Figure S2B illustrates that the application of TRAM34 (P = 0.019, n = 24), Vm24 (P = 0.007, n = 21) significantly decreased CRAC-specific response compared in NT T cells (n = 24). Moreover, the TG-induced Ca2+-response of NT CEM and NT T cells was not different (Fig. S2C).
CEM-CAR cells recognize and eliminate the CD19+ Raji and CD19 MCF7 target cells
To learn the target cell killing capacity/ability Calcein Red AM-based killing assay were implemented, where Raji, MCF-7 and CD19 MCF-7 cells were loaded with Calcein Red AM viability dye and incubated with CEM-CAR cells at a 2:1 effector-to-target cell ratio for 3 h. For controls, unstained Raji, CD19 MCF-7 cells and Raji, CD19 MCF-7, MCF-7 cells with Calcein Red uptake co-incubated with NT CEM cells were applied. For positive control CD19 MCF-7 cells with Calcein Red were incubated with 1% TritonX. After the incubation we visualized the fluorescent cells with confocal microscope (Fig. 3A). The tumor cell killing efficiency of CEM-CAR cells was rated by the mean fluorescence intensity of Calcein Red positive (Raji, MCF-7, CD19 MCF-7) cells: analysis showed that Raji (Fig. 3B, P < 0.001) and CD19 MCF-7 (Fig. 3C, P < 0.0001, n = 50) had significantly lower fluorescence intensity when cocultured with CEM-CARs. This clearly reports that CEM-CAR cells are able to recognize the CD19 target antigen on Raji’s and CD19 MCF-7’s and to induce an anti-tumor response in monolayer coculture.
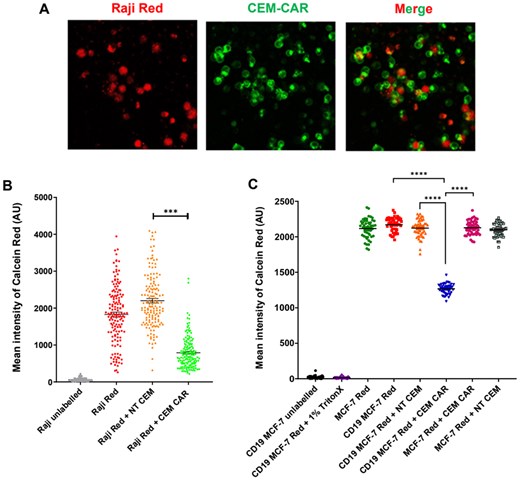
CEM-CAR cells eliminate Raji target cells. (A) Confocal images of Raji (CD19+) cells loaded with Calcein Red-AM (red, Raji Red) and CEM-CAR cells (green: sGFP-CD19-CAR, CEM-CAR) co-incubated for 3 h. (B) Mean fluorescence intensity of Calcein Red in Raji cells detected after 3 hour-incubation (Raji unlabeled: no Calcein Red-AM, Raji Red: only Raji cells, Raji Red + NT CEM: coincubation of Raji Red and NT CEM cells, Raji Red + CEM-CAR: coincubation of Raji Red and CEM-CAR T cells). (C) Mean fluorescence intensity of Calcein Red in MCF-7 and CD19 MCF-7 cells (CD19 MCF-7 unlabeled: no Calcein Red-AM, CD19 MCF-7 Red + 1% TritonX: CD19-MCF7 cells loaded with Calcein Red-AM, incubated with 1% TritonX, MCF-7 Red: only MCF-7 cells loaded with Calcein Red-AM, CD19 MCF-7 Red: only CD19 MCF-7 cells, CD19 MCF-7 Red + CEM NT: coincubation of CD19 MCF-7 Red and CEM NT cells, CD19 MCF-7 Red + CEM CAR: coincubation of CD19 MCF-7 Red and CEM CAR cells, MCF-7 Red + CEM CAR: MCF-7 Red coincubated with CEM CAR, MCF-7 Red + CEM NT: coincubation of MCF-7 Red and CEM NT cells. A symbol represents the mean intensity of Calcein Red determined for one cell. Horizontal lines: mean ± SEM; N ≥ 106 (Raji), 50 (MCF-7, CD19 MCF-7); ***P < 0.001, ****P < 0.0001.
CEM-CAR and CAR-T cells migrate into and eliminate the CD19+ spheroids
The successful validation in 2D culture prompted us to expose the infiltration into tumor spheroids as in vitro tumor model and killing efficiency of CAR-expressing cells. Therefore, CD19+ and CD19- spheroids (negative control) were cultured from Raji and Jurkat cells, respectively, and doped with CEM-CAR/CAR-T cells. On average, spheroids were grown for 3 to 5 d (initial cell number was 5–10 × 103), and they expanded to a size between 400 and 800 µm with a visible necrotic core typical for tumors (black patches or dots in the images, Fig. 4A and B). To standardize the procedure, we pipetted 104 CEM-CAR or CAR-T cells into the culturing well containing a single spheroid, then we incubated this coculture for 24 h. Confocal microscopy images of the middle z-stack for tumor spheroids from Raji (CD19+, Fig. 4A, top) and Jurkat (CD19-, Fig. 4B, top) cells invaded by CEM-CAR cells show that CAR-expressing cells (green, sGFP signal) migrated to the peripheral and pericentral region. The histograms of Fig. 4 A and B (bottom in both) display the number of cells in a slice in Raji and Jurkat spheroids, where the origin (0 position stack) was set to the confocal section, where the highest number of cells were obtained. In each confocal stack the total cell count, the number of sGFP+ cells (CAR-expressing), and the number of dead cells incorporate Live-or-Dye 640/662 stain was determined. Parameters of tumor elimination (IR: infiltration rate, KR: killing rate and KE: killing efficiency, see Materials and Methods section) were calculated to evaluate the killing efficiency of CEM-CAR and CAR-T cells. The measurements happened on 2 (CAR-T) or 3 (CEM-CAR) different days. CEM-CAR cells infiltrated CD19- (7 spheroids) and CD19+ (15 spheroids) spheroids with equal extent, hence IR showed no statistically significant difference (P = 0.57). However, the killing rate (P < 0.0001) and killing efficiency (P < 0.0001) was significantly measurable only in CD19+ spheroids (Fig. 4C), which indicates the specific target cell recognition and elimination by the CEM-CAR. The successful application of this CEM-CAR T cell model prompted/inspired us to generate CAR-T cells from human, primary T cells and test the ability in tumor killing. A similar outcome with CAR-T cells was observed: the tumor-infiltrating capacity of CAR-T cells was the same regardless of the presence of the spheroid CD19 marker, thus IR was not statistically significant between the 2 spheroid types (Raji [8 spheroids] vs Jurkat [10 spheroids]) (Fig. 4D). The KR (P = 0.002) and KE (P < 0.0001) were also negligible (practically zero) for Jurkat spheroids unlike for Raji’s. Thus, our results demonstrate that CAR-T cells also recognized and eliminated CD19+ target cells specifically.
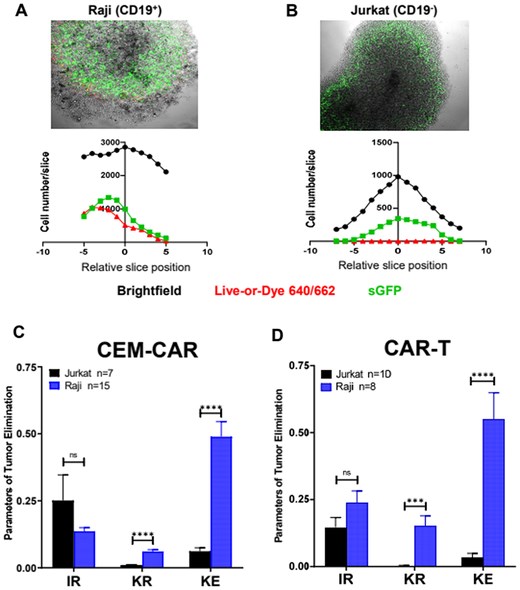
CEM-CAR and CAR-T cells eradicate the tumor cells of spheroid. Confocal images on the infiltrated CEM-CAR cells into (A) Raji (CD19+) and (B) Jurkat (CD19-) tumor spheroids (top row). The images represent a middle slice of z-stack images. Histograms display the total (black), dead (Live-or-Dye 640/662 positive cells, red) and CEM-CAR (sGFP-CD19-CAR expressing, green) cell number in a slice vs. relative slice position (0 position: middle section, bottom row). (C) The tumor elimination of CEM-CAR cells depicted with the infiltration rate (IR), killing rate (KR) and killing efficiency (KE) after 24 h for 15 Raji (blue) and 7 Jurkat (black) spheroids. (D) Parameters of tumor elimination (IR, KR and KE) of CAR-T cells are displayed (incubation: 24 h) for 8 Raji (blue) and 10 Jurkat (black) spheroids. Data are plotted as mean ± SEM; ***P < 0.001; ****P < 0.0001; n.s., not significant.
Kv1.3 and KCa3.1 ion channel inhibition facilitates killing efficiency (KE parameter) of CD19 specific CEM-CAR and CAR-T cells
As we detailed before, K+ ion channels of T lymphocytes may play an important role in tumor elimination by CAR-T cells, which are involved in effector functions through modulation of Ca2+ signaling. Here we revealed that CEM-CAR and CAR-T cells were able to infiltrate tumor spheroids and exert antitumoral effects. Subsequently, ion channel dependence of the tumor-killing activity by CD19-specific CEM-CAR and CAR-T cells was explored: Vm24, a specific blocker of Kv1.3 and TRAM-34, a selective KCa3.1 antagonist were utilized. Confocal microscopy images of the middle z-stacks of tumor Raji spheroids show that CEM-CAR cells were able to infiltrate the tumor spheroid in the presence of both inhibitors (Fig. 5A and B, left). Histograms of Fig. 5A (right) and Fig. 5B (right) clearly show that the number of infiltrating cells in the presence of TRAM34 (1 µM) or Vm24 (10 nM) correlates with the number of dead cells (Live-or-Dye 640/662 positive cells). As before, we determined the IR, KR and KE for each spheroid, and we obtained that addition of Vm24 (4 spheroids) or TRAM34 (5 spheroids) did not alter the tumor infiltrating ability of CEM-CAR into CD19+ Raji spheroids (Fig. 5C) as compared to untreated spheroids (control, 15 spheroids). However, the incubation of tumor invasion model with Vm24 or TRAM34 significantly increased the KR (P = 0.0004, Vm24, 4 spheroids; P < 0.0001, TRAM34, 5 spheroids) and KE (P = 0.009, Vm24 and P < 0.0001, TRAM34) of CEM-CAR cells (Fig. 5C). Figure 5D represents the parameters of tumor elimination (IR, KR, KE) in CD19 MCF-7 spheroids, where the IR did not change significantly, but the addition of Vm24 and TRAM34 significantly increased the KR (Vm24: P = 0.0322, 4 spheroids; TRAM34: P = 0.0126, 4 spheroids) and KE (Vm24: P = 0.0112; TRAM34: P = 0.0002) of CEM-CAR cells as compared the untreated control spheroids (6 spheroid). Although the IR and KR parameters did not change significantly, the addition of both Vm24 (P = 0.007) and TRAM34 (P = 0.028) improved the killing efficacy (KE parameter) of CAR-T cells against the in vitro CD19+ Raji tumor spheroids (Fig. 5E). In the absence of effector/CAR-expressing cells, the presence of inhibitors (Vm24, TRAM34) or DMSO alone (0.1%) did not affect the Raji cells’ viability: percentage of dead cells did not exceed 1% in the spheroids (Fig. S3A). Presence of Vm24 (3 spheroids), TRAM34 (3 spheroids) and DMSO (3 spheroids) also had no effect on total cell number (TC) (Fig. S3B) and spheroid growth (Fig. S3C), i.e. no effect on proliferation compared with the untreated control (3 spheroids). Furthermore, we also evaluated the colocalization of sGFP+ (CEM-CARs) and Live-or-Dye 640/662 (dead cells) in CD19+ Raji spheroids in the presence of TRAM34 and Vm24 (test of off-target effect of compounds). The Pearson correlation coefficient calculated for the colocalization was 0.12 ± 0.038 for TRAM34 and 0.097 ± 0.004 for Vm24. This clearly shows, that increased KE is not due to the death of CAR cells upon addition of antagonist. The presence of inhibitors (Vm24, TRAM34) and DMSO did not influence the IR, KR and KE parameters for Jurkat (CD19-) spheroids co-incubated with CEM-CAR cells (Fig. S4).
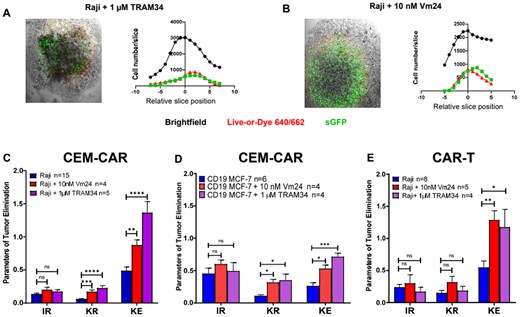
Ion channel inhibitors enhance the eradication of tumor spheroid. Confocal images of infiltration of CEM-CAR cells into Raji (CD19+) tumor spheroid presence of 1 µM TRAM34 (A) and 10 nM Vm24 (B) (left). The images represent a middle slice of z-stack images. Histograms display the total (black), dead (Live-or-Dye 640/662 positive cells, red) and CEM-CAR (sGFP-CD19-CAR expressing, green) cell number in a slice vs. relative slice position (0 position: middle section, right). (C) The tumor elimination of CEM-CAR cells in the presence of TRAM34 (1 µM, KCa3.1 blocker) or Vm24 (10 nM, Kv1.3 inhibitor) depicted with IR, KR and KE after 24 h for 15 Raji (blue) and 4 Raji along with 10 nM Vm24 (red, Raji + 10 nM Vm24), and 5 Raji with 1 µM TRAM34 (purple, Raji + 1 µM TRAM34) spheroids. (D) Parameters of tumor elimination (IR, KR and KE) of CEM-CAR cells with TRAM34 in Vm24 in CD19 MCF-7 cells are calculated for 6 CD19 MCF-7 (blue), 4 CD19 MCF-7 with 10 nM Vm24 (red, CD19 MCF-7 + 10 nM Vm24), and 4 CD19 MCF-7 along with 1 µM TRAM34 (purple, CD19 MCF-7 + 1 µM TRAM34). (E) Parameters of tumor elimination (IR, KR and KE) of CAR-T cells with TRAM34 and Vm24 are displayed (incubation: 24 h) for 8 Raji (blue, Raji) and 5 Raji with 10 nM Vm24 (red, Raji + 10 nM Vm24), and 4 Raji with 1 µM TRAM34 (purple, Raji + 1 µM TRAM34) spheroids. Data are plotted as mean ± SEM; *P < 0.05; **P < 0.01; ***P < 0.001; ****P < 0.0001; n.s., not significant.
Discussion
The use, development, and optimization of CAR T cell-based therapeutic systems has become increasingly popular in recent years. Despite remarkable clinical results, patients receiving treatment can still suffer from life-threatening toxicities.35 Moreover, the microenvironment of solid tumors, the extracellular matrix inhibits the access of small molecules to the targets on/in tumor cells such as therapeutic antibodies. Also the CAR T cell-based treatments have low efficacy against solid tumors, which could be attributed to the suppressive features of tumors preventing infiltration and effector function of these cells.2,7–9 T cell ion channels such as Kv1.3, KCa3.1, and CRAC channels are involved in the regulation of many T cell functions such as migration and tumor killing, that are pertinent in a cancer eradication. Inhibition of these ion channels alters T cell proliferation and effector functions;17–19 hence they can serve as “fine-tuning knobs” in the system. However, little is known about the role of these ion channels in the antitumor response of CAR-T cells and thus in tumor cell recognition, tumor infiltration, and elimination of cancer cells.
First, we tested by electrophysiological and pharmacological tools whether our CD19-specific CEM-CAR (third generation CAR) cells express Kv1.3 and KCa3.1 channels. Our results showed that CEM-CAR cells express both Kv1.3 and KCa3.1 ion channels, and the conductance level/channel number (700 vs. 550 KCa3.1 and 500 vs. 350 Kv1.3 in CEM or T cell, respectively) for both were comparable to those described in primary activated T cells.36–38 Jurkat cells, which are regarded as a typical model for T cells, are not suitable model of T cells: instead of KCa3.1 they express another Ca2+-dependent K+ channel, namely KCa2.2.38 Though these two channels have familiar biophysical properties (half-maximal activation Ca2+ concentration, conductance), probably, the membrane localization or/and signaling proteins coupled to the channel intracellular tails could be entirely different. Consequently, the CEM cells were more appropriate to model the behavior of CAR-expressing T cells in further experiments, however, we also included T cells in our study.
Here we obtained that Ca2+ influx is reduced in CAR-T cells compared to control NT CEM cells and a similar result is observed for CAR-T and NT T cells (Fig. S2.).27 As was reported before, the reduced Orai1 expression in CTLs facilitate target cell elimination.26 However, targeting Orai1 channels is not resolved due to the lack of high affinity and selective inhibitors; hence we could not test its role in CAR-expressing cells. Based on these we suppose the genetic manipulation of Orai1 functional expression (knock-down or expression of non-conducting Orai1 mutants) could be a modality in development of novel CAR-T cell generations.
Next, we assessed the target killing affinity of our CEM-CARs in a monolayer, and we could show that CAR receptor specifically recognize the target CD19+ Raji, CD19 MCF-7 cells. Even during the short-term incubation, the CEM-CAR cells could eliminate target cells, however, the tumor defensive mechanism would prevent even cells migrating into the in vivo tumors. To model solid tumor vs. CAR-T cell scenario, we generated spheroids from CD19+ Raji, CD19 MCF-7 (CD19+ MCF-7 cell line) and CD19- Jurkat cells: they had necrotic core, and exhibited dense cell structure, which probably built up a TME-like milieu.
We reported here that CEM-CAR and CAR-T cells can infiltrate spheroids regardless of the CD19 cell surface marker presence but tumor killing only occurred in CD19+ Raji spheroids: this clearly proves that the anti-tumor response of CEM-CAR and CAR-T cells occurred through specific antigen recognition. We introduced killing efficiency or KE, which is an estimate of the number of killed cells per CAR expressing cell, and it was extensively higher for Raji spheroids as compared to Jurkat, which further underlines the specific response of CAR bearing CEM and T cells to the CD19 antigen.
Inhibition of the Kv1.3 by Vm24 and KCa3.1 by and TRAM34 significantly increased the killing efficiency of CD19-specific CEM-CAR and CAR-T cells in the spheroids (Raji, CD19 MCF-7). Previously it was reported for CTL and NK cells that changes in the intracellular and extracellular Ca2+ concentrations play a regulatory role in migration, proliferation and cytotoxic functions. In CTLs, the optimal cytotoxicity range is associated with low [Ca2+]int (<300 nM) ([Ca2+]ext: 23–625 µM), which correlates with the release of lytic granules containing granzyme B. However, at high [Ca2+]int values (>300 nM) ([Ca2+]ext: 0.5 to 1.0 mM) the migration speed and persistence are optimal, whereas cytotoxicity against target cells is already reduced.26 We suppose that the inhibition of Kv1.3 and KCa3.1 ion channels contributes to a shift of this calcium optimum into the cytotoxicity range, resulting in a more efficient anti-tumor response by CEM-CAR and CAR-T cells.39 Since inhibitors were added to the Raji/CD19 MCF-7 spheroids simultaneously with the CEM-CAR/CAR-T cells and we could not detect change in the infiltration of either CEM-CAR or CAR-T cells, we suppose that migration of these cells is not vastly hampered by channels’ inhibition.
In the 24-h spheroid killing assay 10 nM Vm24 was used (unlike in patch-clamping where 1 nM), since the Vm24 might be degradable peptide and due to its size (app. 4 kD) its diffusion could be fairly limited into the tumor spheroids. Hence, we used ca. 1,000 times the Kd value, while for TRAM34 50-fold Kd, as this small molecule is more stable than those with peptidyl origin.40–42 Also, we should mention that this concentration of drugs had no effect on the viability of target cells, as well as that of CAR cells (Fig. S3). Both inhibitors, when administered in vivo, had no adverse effect.
In summary, we could show that (1) both KCa3.1 and Kv1.3 ion channels are functional in CD19-specific CEM-CAR cells, (2) CEM-CAR cells have lower CRAC levels compared to NT CEM control, (3) CEM-CAR and CAR-T cells specifically recognized the tumor cell and eliminated it in both 2D and 3D cultures, (4) inhibition of Kv1.3/KCa3.1 channels promotes tumor killing. Based on these results, we propose that modulation of ion channels in CAR-T cell therapy should be a novel approach to achieve better therapeutical outcome, which could be further improved with combination of immune checkpoint strategies targeting PD-1/PD-1L and/or CTLA4/B7.43 Since these 2 channels are also present in normal T cells, the systemic application of K+ blockers in vivo is limited, however, appropriate genetic modulation of their expression could be a possibility in CAR-T cell therapy.
Acknowledgments
Supported by the University of Debrecen Program for Scientific Publication, University of Debrecen Scientific Research Bridging Fund, NKFIH K128525 and 152728 (P.H.). Supported by the EKÖP-24-3 University Research Scholarship Program of the Ministry for Culture and Innovation from the source of the National Research, Development and Innovation Fund (V.J.). We would like to say thank you to Anikó Szilágyi for her technical assistance. We are grateful to Jesús Borrego and György Panyi for sharing recombinant Vm24 for electrophysiological experiments and spheroid assays, and to Heike Wulff (UC Davis, CA, USA) for TRAM34. We would like to express our thanks to Xiaolei Su (Yale University, New Haven, CT, USA) for sending us CD19-CAR plasmid.
Author contributions
V.J.: writing—original draft preparation, formal analysis, data curation, methodology, investigation, visualization; Á.Sz.: formal analysis; P.H.: conceptualization, writing—original draft preparation, writing—review & editing, project administration, resources, formal analysis, validation, funding acquisition. All authors have read and agreed to the published version of the manuscript.
Vivien Jusztus (Data curation [Equal], Formal analysis [Equal], Investigation [Equal], Methodology [Equal], Visualization [Equal], Writing—original draft [Equal]), Árpád Szöőr (Formal analysis [Equal]), and Péter Hajdu (Conceptualization [Equal], Formal analysis [Equal], Funding acquisition [Equal], Project administration [Equal], Resources [Equal], Validation [Equal], Writing—original draft [Equal], Writing—review & editing [Equal])
Supplementary material
Supplementary material is available at The Journal of Immunology online.
Funding
This research was funded by NKFIH: K128525, 152728 (P.H.), University of Debrecen Program for Scientific Publication, University of Debrecen Scientific Research Bridging Fund (P.H.), NKFIH: FK132773 (Á.Sz.).
Conflicts of interest
The authors declare no conflicts of interest.
Data availability statement
The data underlying this article will be shared on reasonable request to the corresponding author.
