


Abstract
Women with polycystic ovary syndrome (PCOS) have increased incidence of atherogenic dyslipidemia and cardiovascular disease (CVD). Interventions targeting atherogenic dyslipidemia to reduce CVD risk are limited in women with PCOS.
This pilot study was conducted to determine the effect of 12 weeks of high dose fish oil (FO), metformin, and FO as an adjunct to metformin (FO-metformin) therapy on fasting and nonfasting plasma lipids and ApoB-remnants in young women with the metabolic syndrome (MetS) and PCOS.
In this open-label parallel pilot trial, women with MetS and PCOS (18-30 years of age) were randomized into 1 of 3 interventions: (1) FO; (2) metformin; and (3) FO-metformin. Plasma lipids and ApoB (48 and 100)-lipoproteins and triglycerides (TG) were measured in the fasted and postprandial state following a high-fat meal at baseline and postintervention.
FO-metformin significantly lowered fasting plasma TG by >40% compared with FO and metformin treatments. Fasting plasma apoB48 was lowered 40% in FO-metformin and 15% in the FO groups from baseline to postintervention. ApoB48 area under the curve (ApoB48AUC), ApoB48 incremental AUC (ApoB48iAUC), ApoB100AUC, and ApoB100iAUC decreased in all groups from baseline to postintervention; however, these findings did not reach statistical significance.
The findings of this pilot trial show that high dose FO and FO-metformin combination therapy tend to lower fasting and postprandial plasma TG and ApoB-lipoprotein remnants compared with metformin; however, the study is limited by small sample size. These results may be clinically significant in individuals with PCOS for management of atherogenic dyslipidemia.
Cardiometabolic risk factors of obesity, dyslipidemia and insulin resistance are highly prevalent in adolescents and young women with polycystic ovary syndrome (PCOS) [1, 2]. These risk factors persist throughout the lifespan of women with PCOS, increasing the risk of cardiovascular disease (CVD), type 2 diabetes (T2D) and other comorbidities [3-7]. Large population studies have shown a 2-fold higher incidence of dyslipidemia and CVD in women with PCOS [5, 6, 8, 9]. In young women (18-45 years of age) with PCOS and the metabolic syndrome (MetS), there is an increased incidence of atherogenic dyslipidemia and premature atherosclerotic cardiovascular disease (ACVD), including endothelial and cardiac dysfunction and increased carotid intimal medial thickness (cIMT) [10-19]. A causal risk factor in the development of atherosclerosis and CVD is atherogenic dyslipidemia, and 65% to 80% of women with PCOS are reported to have an adverse lipid profile [20, 21].
Atherogenic dyslipidemia includes elevated fasting and nonfasting triglycerides (TG) and total apolipoprotein B (ApoB), and decreased fasting HDL-C concentrations [22, 23]. Fasting and nonfasting plasma ApoB-remnant cholesterol lipoproteins have been causally associated with increased incidence of ischemic cardiovascular events [24, 25]. Remnant cholesterol refers to remnants of TG-rich Apo-B-lipoproteins; chylomicron-ApoB48 from the intestine, and very-low-density lipoprotein-ApoB100 derived from the liver [24]. ACVD is caused by an accumulation of ApoB-lipoprotein remnant cholesterol in the subendothelium-intima and thickening of the smooth muscle layer in the arterial wall [26-28]. ApoB-cholesterol remnants are associated with early ACVD, “residual risk” of CVD, and increased ischemic CVD events [24]. Progression of ACVD over decades leads to end-stage ischemic CVD, including coronary and cerebral artery disease [24, 26]. We have been the first to show that obese adolescents with PCOS and MetS (13-17 years of age) have elevated fasting and nonfasting TG and plasma ApoB-remnant cholesterol lipoproteins [1, 29]. These results indicate that adolescents and young women with PCOS and the MetS may be at high-risk for premature development of ACVD [1, 29]. Currently we lack evidence-based research for effective and safe treatments that target ApoB-remnant cholesterol lipoproteins in young women with PCOS [2, 5, 30].
The metabolic syndrome (MetS) has higher prevalence in adolescents and young females (18-50 years of age) with PCOS compared with age- and body mass index (BMI)-matched controls, and prevalence has been shown to be from 24% to 45% in different populations [3, 30-32]. Individuals with PCOS and MetS are at a 4-fold higher risk of developing T2D [5, 6]. Furthermore, those with PCOS and T2D have a 3-fold higher risk of developing ACVD compared with those without diabetes [5]. The first line of intervention in overweight-obese PCOS patients is to reduce body weight by targeting dietary-lifestyle habits [2]. However, the PCOS and MetS phenotype is often metabolically resistant to dietary-lifestyle interventions [33-35]. Metformin is commonly used as standard of care for treatment of insulin resistance and the prevention of transition to T2D in PCOS [2, 36]. Metformin may improve insulin sensitivity, reduce glucose production, and reduce androgens via steroidogenic enzyme pathways, as well as contributing to improvement in the insulin-mediated upregulation of lipogenesis leading to dyslipidemia [36, 37]. However meta-analyses have shown that metformin does not improve fasting plasma lipids in PCOS, particularly in the PCOS and MetS phenotype [30, 36, 38, 39]. Fish oil (FO) contains omega-3 long chain fatty acids, eicosapentaenoic (EPA) and docosahexaenoic acid (DHA), and FO has been shown to effectively target fasting TG, nonfasting plasma TG and total apoB-lipoproteins in the MetS [40-43]. Meta-analyses have shown that FO lowers fasting plasma TG and ApoB-lipoproteins by 15% to 45%, and FO specifically targets the nonfasting or postprandial excursion in plasma TG following a high-fat meal [42, 44]. Evidence to date suggests that FO supplementation may reduce fasting plasma TG in PCOS women [45-50]. However, the efficacy of FO or combination FO-metformin treatment to target both fasting and nonfasting excursions in TG and ApoB-lipoprotein remnants in the PCOS and MetS phenotype has not been investigated.
The aim of this pilot trial was to investigate the efficacy of a polytherapeutic first-line intervention approach of healthy diet-lifestyle counseling with either high dose FO, metformin, or combination FO + metformin treatment on fasting and nonfasting plasma TG and ApoB48 and ApoB100-lipoprotein remnant concentrations in young women with PCOS and the MetS. We hypothesized that a combination of FO + metformin, compared with either FO or metformin alone, would lower fasting and nonfasting plasma TG, and ApoB48- and ApoB100-lipoprotein remnant concentrations in women with PCOS and the MetS.
Methods
Study Design
The trial was an open-label parallel randomized design. Upon enrollment, eligible participants completed a signed informed consent and were assigned using the block method (Sealed envelope) to one of the following interventions for 12 weeks: (1) metformin (1.5 mg/day, n = 8); (2) FO (high dose containing 2.52 g EPA, 1.68 g DHA/day, n = 13); or (3) FO-metformin (n = 8). Participant selection was based on inclusion criteria of consecutive patients that consented to be in the study over a specific time interval of 12 months. Original sample size calculations to achieve a clinically significant reduction of 15% in 12 weeks in the primary outcome of fasting plasma TG were n = 28 with P < 0.05 and 80% power to detect a significant difference. We aimed to recruit n = 38 participants, allowing for a 30% dropout or failure to comply to intervention. Final participant numbers in each intervention group using random permuted block method were as follows: metformin n = 8, FO n = 13, and FO-metformin n = 8. Prior to baseline measurements, participants completed 24-hour food records for 3 days to reflect their usual dietary intake (2 weekdays and 1 weekend day)[51]. Diet records were used by a Registered Dietitian to counsel participants on nutrition and lifestyle according to Eat Well Live Well with Health Canada’s Food Guide, as part of recommendations for first-line standard of care [2]. Compliance to interventions was assessed by our institutional clinical trial management team in which compliance was determined by documenting number of capsules consumed by participant (daily log) and counting of remaining capsules. The study had 98% compliance. The study was approved by the University of Alberta Human Ethics Board (Pro00059201), Health Canada Natural Health Product Directorate, and Health Canada Drug Directorate (HC6-24-C191998), and it was registered at clinicaltrials.gov (NCT04116203).
Study Participants and Inclusion Criteria
Participants were young women with PCOS, aged 18 to 30 years, recruited from endocrine clinics and the greater community in Edmonton, Alberta, Canada. Inclusion criteria included: (1) a PCOS diagnosis using the Rotterdam PCOS Diagnostic Criteria in adults with 2 of the specific criteria met: oligo- or anovulation, clinical and/or biochemical hyperandrogenism, or polycystic ovaries on ultrasound and exclusion of related endocrine disorders; (2) features of the MetS: BMI > 25 kg/m2, fasting plasma TG > 150 mg/dL and/or total apoB > 0.08g/L, the presence of glucose intolerance or impaired insulin sensitivity (fasting glucose 100-125 mg/dL [6.1-6.9 mM], 2-hour oral glucose tolerance test [OGTT] >7.8 to 11 mM), and/or insulin >15 uM/mL). Participants were excluded if they were pregnant, lactating, or attempting to get pregnant or taking fertility drugs. Those taking oral contraceptives, metformin, nonrequired medications, nutraceuticals, or special diets were required to withdraw from these if medically appropriate, and a washout period of 8 weeks was initiated before starting the intervention. The health and diet aspects for each participant were reviewed as part of routine standard of care before approval for participation in the study.
Anthropometric, Body Composition, and Blood Pressure Measurements
Anthropometric assessments were done on the same clinical visit day at baseline and postintervention by trained research staff using standardized measurement protocols, as previously described [1, 29]. In brief, height was measured without shoes to the nearest 0.1 cm using a wall-mounted stadiometer (Holtain Limited, UK). Waist circumference was measured to the nearest 1 mm at the level of the umbilicus using a nonstretch measuring tape. All anthropometric measurements were completed 3 times and average values were calculated. Body composition, including weight, fat mass, fat-free mass, % fat mass, and % fat-free mass, was determined using the BOD POD system (COSMED/Life Measurement, Inc. USA) [29, 52].
Baseline and Postintervention Assessment of Fasting Plasma Lipids, Biochemical, and Endocrine Parameters
Fasting plasma lipids and assays for biochemical and endocrine parameters were performed at University of Alberta Hospital Outpatient Laboratory using standard protocols [29]. Total cholesterol, low-density lipoprotein cholesterol (LDL-C), HDL-C, and TG were measured using enzymatic colorimetric assays [29, 52]. Plasma endocrine hormone profile (using fasting blood collected between 8:00 and 11:00 am) with assay limit of quantification (LQ) and intra-assay coefficient of variation (ICV) using the same lot number, included total testosterone (LQ, 0.2 nmol/L; ICV, 2.4%-3.3%; Roche Diagnostics, Cobas e801 electrochemiluminescence immunoassay analyzer [ECLIA]), androstenedione (LQ, 1.0 nmol/L; ICV, 8.8%-12.1%; DIASource RIA), dehydroepiandrosterone (DHEAS) (LQ, 0.5 nmol/L; ICV, 2.5%-5%; Roche Diagnostics, Cobas e801 ECLIA), and sex hormone binding globulin (SHBG) (LQ, 0.8 nmol/L; ICV, 6.8%-7.2%; Roche Diagnostics, Cobas e801 ECLIA). Free testosterone was calculated using Vermeulen equation [53]. The free androgen index (FAI) was calculated, FAI = 100 (Total testosterone/SHBG) [29]. Fasting and nonfasting plasma insulin and glucose were assessed using an OGTT (2-hour, 75 g glucose). The homeostasis model assessment of insulin resistance (HOMA-IR) was calculated by fasting insulin (mU/mL) × fasting glucose (mmol/L) / 22.5, and insulin resistance was defined by a HOMA-IR reading >4 [29, 54].
Baseline and Postintervention Postprandial Lipid and ApoB-Lipoprotein Metabolism Following a High-Fat Meal
At baseline and following the 12-week intervention, a high-fat meal test was undertaken by each participant. Following a 12-hour overnight fast, a blood sample was taken and then subjects consumed a high-fat milk shake meal providing 0.61 g lipid/kg body weight to assess nonfasting postprandial lipid metabolism [29]. The meal contained cream (35% milk fat) and Ensure Calorie Plus Meal Replacement Drink (Abbott Laboratories, Canada) to provide approximately 62.5% energy as fat, 30% energy as carbohydrate, and 7.5% energy as protein. Blood samples following consumption of the meal were collected into EDTA-coated vacutainers at 2, 4, 6, and 8 hours, and plasma prepared by centrifugation (3500 rpm, 4 oC for 10 minutes) and stored at −80 oC for lipid and ApoB-lipoprotein analysis. Area under the curve (AUC) and incremental AUC (iAUC) (nonfasting response) for lipids and apoB-lipoproteins were determined using GraphPad 8.0 (San Diego, USA) [29, 52].
Quantification of Plasma ApoB-Lipoproteins
ApoB48- and ApoB100-lipoproteins were quantified using an adapted Western blot method as previously described [1, 29, 52]. Briefly, total plasma proteins were separated on a 3% to 8% NUPAGE Tris-acetate polyacrylamide gel (Invitrogen, USA) and then transferred onto a polyvinylidene difluoride membrane (0.45 μm, ImmobilonPTM, Millipore, USA). Membranes were incubated with a primary polyclonal antibody specific for ApoB (dilution 1:200, RRID:AB_92217) [55] and a secondary antibody tagged with horseradish peroxidase (dilution 1:500, RRID:AB_628490) [56]. ApoB48 and B100 bands were visualized by enhanced chemiluminescence (ECL Advance, Amersham Biosciences, UK) and quantified using linear densitometric comparison to a known mass of purified human ApoB48 and ApoB100 standards [1, 29].
Statistical Analyses
Normality of continuous variables was assessed by the D’Agostino and Pearson omnibus normality test. Differences between intervention groups were examined using analysis of variance (ANOVA) and repeated-measures ANOVA for comparing baseline to postintervention results, followed by Bonferroni post tests for multiple comparisons when data assumed a normal Gaussian distribution. To explore simple relationships between primary outcomes of fasting and nonfasting TG and ApoB-lipoproteins, Pearson (for normally distributed data that assume linearity and homoscedasticity) and Spearman (for data not normally distributed) correlation coefficients were used. Select multiple linear regression models were used to further examine the relationship between primary lipid outcomes and predictor variables of interest. Assumptions of normality, linearity, limited multicollinearity, and homeoscedasticity were applied, and variables did assume a normal distribution of residuals. Akaike information criterion statistics were used to assess overall model fit. The level of statistical significance was set at p < 0.05. All statistical and graphical analyses were performed using GraphPad Prism 9.0 (GraphPad Software, Inc. USA).
Results
Anthropometry, Endocrine, and Insulin-Glucose Parameters
The body weight, BMI, waist circumference, waist-to-hip ratio, % total fat mass, and fat-free mass were not significantly different between groups at baseline and postintervention (Table 1). Within the FO-metformin group there were reductions (8%-14%) in total body weight, BMI, and % fat mass from baseline to postintervention, but this did not reach statistical significance. There were no significant differences in endocrine hormones between treatment groups at baseline or at the postintervention evaluation. Within groups, SHBG increased by > 30% in the metformin-treated group, was reduced by > 20% in the fish oil group, and there was no change in the FO-metformin group; however, these changes did not reach statistical significance. Free testosterone tended to increase within all groups from baseline following the intervention, and FAI increased markedly (by 70%) in the FO group. There were no significant differences in insulin, glucose, 2-hour OGTT, or HOMA-IR at baseline or postintervention between groups. Fasting insulin and HOMA-IR tended to be lower by 17% to 30% within all groups at baseline compared with postintervention and these findings may be of clinical significance in individuals; however, there was no statistical difference within groups.
Fasting anthropometric, endocrine, insulin, and glucose concentrations at baseline and postintervention treatment for 12 weeks with metformin, fish oil or fish oil-metformin in women with PCOS
| Metformin (n = 8) | Fish oil (n = 13) | Fish oil-metformin (n = 8) | |||||
|---|---|---|---|---|---|---|---|
| Baseline all groups (n = 29) | Baseline | Post (%) | Baseline | Post (%) | Baseline | Post (%) | |
| Age, years | 25.0 ± 1.8 | 25.5 ± 1.2 | 28.7 ± 1.7 | ||||
| Body weight, kg | 109.8 ± 4.8 | 117.9 ± 7.6 | 116.1 ± 7.4 (-1) | 104.5 ± 5.7 | 105.7 ± 5.6 (1) | 111.6 ± 10.3 | 102.8 ± 7.8 (-8) |
| BMI, kg/m2 WC, cm WHR | 38.6 ± 1.4 45.7 ± 1.1 0.9 ± 0.01 | 41.9 ± 1.3 47.8 ± 2.3 0.9 ± 0.02 | 41.2 ± 0.9 (−1) 48.1 ± 2.3 (<1) 1.0 ± 0.03 (+10) | 35.9 ± 1.8 43.8 ± 1.2 0.9 ± 0.02 | 36.4 ± 1.8 (1) 44.1 ± 1.3 (<1) 0.9 ± 0.02 (0) | 40.5 ± 3.6 47.3 ± 2.5 0.9 ± 0.02 | 37.1 ± 2.3 (−8) 46.6 ± 2.0 (−1) 1.0 ± 0.02 (+10) |
| Fat mass, kg | 50.4 ± 2.8 | 56.3 ± 4.7 | 55.8 ± 4.5 (<1) | 46.6 ± 3.9 | 47.9 ± 4.5 (3) | 51.8 ± 6.4 | 44.8 ± 3.9 (−14) |
| Fat-free mass, kg | 59.4 ± 1.6 | 61.3 ± 3.2 | 60.1 ± 3.4 (−2) | 58.2 ± 1.9 | 56.6 ± 2.3 (3) | 59.6 ± 4.3 | 58.2 ± 4.2 (−2) |
| Androstendione, nmol/L | 8.8 ± 0.7 | 7.2 ± 0.8 | 7.8 ± 1.8 (8.0) | 9.3 ± 0.9 | 11.1 ± 1.1 (16) | 9.6 ± 1.7 | 10.2 ± 0.1 (6) |
| Testosterone, nmol/L | 1.4 ± 0.1 | 1.3 ± 0.2 | 1.3 ± 0.4 (0) | 1.5 ± 0.2 | 1.6 ± 0.1 (6) | 1.4 ± 0.2 | 1.5 ± 0.2 (7) |
| Free T, pmol/L | 27.4 ± 2.8 | 23.8 ± 4.1 | 25.2 ± 8.1 (6) | 30.8 ± 6.0 | 34.7 ± 4.6 (13) | 26.8 ± 3.9 | 29.2 ± 2.3 (9) |
| SHBG, nmol/L | 34.4 ± 3.6 | 35.6 ± 6.0 | 55.6 ± 6.9 (36) | 39.0 ± 5.5 | 30.1 ± 4.9 (-22) | 29.3 ± 7.2 | 30.0 ± 6.3 (2) |
| FAI DHEAS, μmol/L | 4.7 ± 0.6 7.6 ± 0.6 | 4.4 ± 0.9 7.6 ± 1.2 | 5.1 ± 1.7 (16) 6.4 ± 1.2 (−16) | 3.9 ± 0.9 8.2 ± 1.0 | 6.6 ± 0.9 (70) 8.4 ± 1.1 (2) | 5.7 ± 1.2 6.7 ± 1.1 | 5.9 ± 0.9 (3) 7.25 ± 1.2 (8) |
| Insulin, pmol/L | 215.0 ± 28.0 | 217.1 ± 46.4 | 180.1 ± 52.2 (−17) | 223.4 ± 60.3 | 181.1 ± 20.8 (−19) | 203.1 ± 43.7 | 144.3 ± 19.0 (−29) |
| Glucose, mmol/L OGTT (2-hr), mmol/L | 4.9 ± 0.1 5.9 ± 0.2 | 4.8 ± 0.2 5.9 ± 0.4 | 4.7 ± 0.1 (-2) 6.4 ± 0.8 (8) | 4.9 ± 0.1 6.0 ± 0.3 | 4.8 ± 0.2 (-2) 6.1 ± 0.5 (2) | 4.9 ± 0.1 5.9 ± 1.2 | 4.6 ± 0.2 (−6) 5.7 ± 0.6 (−3) |
| HOMA-IR | 7.8 ± 1.1 | 7.9 ± 1.8 | 6.3 ± 1.9 (−20) | 8.1 ± 2.2 | 6.5 ± 0.8 (−20) | 7.4 ± 1.7 | 5.0 ± 0.8 (−32) |
Values are presented as mean ± SEM and variables were normally distributed. Post (%) represents mean percentage change from baseline within group.
Abbreviations: DHEAS, dehydroepiandrostendione; FAI, free androgen index; HOMA-IR, homeostatic model assessment of insulin resistance; OGTT (2-hr), oral glucose tolerance at 2 hours; SHBG, sex hormone binding globulin; T, testosterone; WC, waist circumference; WHR, waist hip ratio.
Fasting Plasma Lipids and ApoB-Lipoproteins
There was no difference in fasting plasma concentrations in LDL-C, HDL-C, or non-HDL-C and apoB48 or apoB100-remnant lipoproteins between groups at baseline or postintervention (Table 2). Metformin, compared with the other treatments, was shown to significantly reduce fasting plasma total cholesterol by 10% from baseline to the postintervention assessment. Within the FO-metformin group fasting plasma TG was reduced by > 40% from baseline to postintervention, and in the FO intervention there was a trend for a reduction in TG by 20% from baseline to postintervention; however, these did not reach statistical significance. There was also a trend for fasting plasma concentrations of ApoB48 to be lowered by 15% in the FO and by 40% in the FO-metformin group from baseline to postintervention, which may be clinically significant in individuals; however, these findings did not reach statistical significance (Table 2 and Fig. 1).
Fasting and nonfasting lipid and apoB-concentrations at baseline and postintervention treatment with metformin, fish oil or fish oil-metformin for 12 weeks in women with PCOS
| Metformin (n = 8) | Fish oil (n = 13) | Fish oil-metformin (n = 8) | |||||
|---|---|---|---|---|---|---|---|
| Baseline all groups (n = 29) | Baseline | Post(%) | Baseline | Post (%) | Baseline | Post (%) | |
| TG, mmol/L TG, AUC TG, iAUC | 2.5 ± 0.2 2459 ± 260 825 ± 128 | 2.2 ± 0.2 2388 ± 583 955 ± 217 | 2.1 ± 0.2 (−5) 2154 ± 626 (10) 742 ± 272 (−12) | 2.5 ± 0.2 2620 ± 350 911 ± 237 | 2.0 ± 0.1 (−20) 2227 ± 178 (−15) 734 ± 92 (−20) | 2.7 ± 0.5 2599 ± 521 783 ± 237 | 1.8 ± 0.2 (−43)* 1570 ± 258 (−40) 360 ± 63 (−54) |
| TC, mmol/L | 5.3 ± 0.2 | 5.4 ± 0.2 | 4.6 ± 0.2 (−10)* | 5.3 ± 0.4 | 5.2 ± 0.3 (−2) | 5.4 ± 0.3 | 5.0 ± 0.4 (−8) |
| HDL-C, mmol/L | 1.0 ± 0.0 | 1.1 ± 0.1 | 1.0 ± 0.1 (−10) | 1.0 ± 0.1 | 0.99 ± 0.1 (0) | 0.9 ± 0.05 | 1.0 ± 0.1 (10) |
| LDL-C, mmol/L | 3.4 ± 0.2 | 3.4 ± 0.2 | 2.9 ± 0.2 (−15) | 3.4 ± 0.4 | 3.5 ± 0.3 (3) | 3.3 ± 0.2 | 3.3 ± 0.3 (0) |
| Non-HDL-C, mmol/L ApoB48, μg/mL ApoB48, AUC ApoB48, iAUC ApoB100, g/mL ApoB100, AUC ApoB100, iAUC | 4.6 ± 0.2 24.6 ± 2.4 188.3 ± 17.4 43.8 ± 6.2 2.8 ± 0.2 25185 ± 2140 5682 ± 857 | 4.2 ± 0.2 22.3 ± 4.8 187.1 ± 34.4 40.1 ± 9.5 2.8 ± 0.20 27240 ± 4824 6810 ± 1900 | 3.6 ± 0.2 (−15) 21.4 ± 5.5 (4) 174.1 ± 25.5 (−7) 37.2 ± 5.8 (−7) 3.5 ± 0.8 (20) 26996 ± 5873 (−1) 7017 ± 1352 (3) | 4.7 ± 0.4 21.7 ± 2.7 189.5 ± 14.7 45.4 ± 8.0 2.9 ± 0.3 24727 ± 2155 5251 ± 1061 | 4.5 ± 0.3 (−4) 18.5 ± 2.9 (−15) 170.5 ± 17.8 (−10) 38.6 ± 9.6 (−15) 3.1 ± 0.5 (7) 21811 ± 2908 (−12) 4963 ± 1735 (−5) | 4.7 ± 0.2 26.3 ± 6.5 199.7 ± 60.0 42.6 ± 18.2 2.8 ± 0.3 23779 ± 6403 5487 ± 2209 | 4.3 ± 0.3 (−9) 15.7 ± 1.2 (−40) 135.8 ± 12.6 (−32) 31.1 ± 6.5 (−17) 2.7 ± 0.3 (4) 20238 ± 2782 (−15) 4800 ± 1046 (−12) |
Values are presented as mean ± SEM and variables were normally distributed. Post (%) represents mean percentage change from baseline within group. AUC and iAUC represent nonfasting response following a high-fat meal test.
Abbreviations: AUC, area under the curve; HDL-C, high-density lipoprotein cholesterol; iAUC, incremental area under the curve; LDL-C, low-density lipoprotein cholesterol; non-HDL-C, non-high-density lipoprotein cholesterol, TC, total cholesterol; TG, triglycerides.
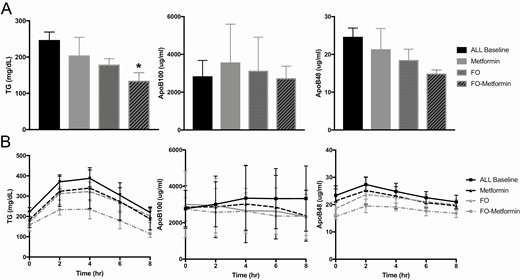
Fasting (A) and nonfasting (B) response to a high-fat meal test in plasma triglycerides, ApoB100-, and ApoB48-lipoproteins at baseline and postintervention treatment for 12 weeks with metformin (n = 8), fish oil (n = 13) and fish oil-metformin (n = 8) in women with PCOS. Data shown as mean ± SEM. *P < 0.05.
Postprandial Response in Plasma Lipids and ApoB-Lipoproteins Following a High-Fat Meal
The postprandial response in plasma ApoB-lipoproteins and TG following the high-fat meal is shown in Table 2 and Fig. 1. Between groups, there was not significant difference in postprandial response at baseline or postintervention. However, within groups, FO and FO-metformin treatments decreased total plasma TGAUC by 15% and 40%, respectively, but these findings did not reach statistical significance. Plasma TGiAUC, representing the incremental response in plasma TG from fasting concentration following the high-fat meal tended to decrease in all groups from baseline to postintervention, by 12% in metformin, 20% in FO, and 54% in the FO-metformin intervention groups. Similarly, plasma ApoB48AUC and ApoB48iAUC, representing intestinal chylomicron secretion and metabolism in response to the high-fat meal, decreased 7% to 17% within all groups from baseline to postintervention. The decrease in ApoB48AUC and ApoB48iAUC was greatest within the FO-metformin group; however, these findings were not significantly different. ApoB100AUC and ApoB100iAUC, representing hepatic very-low-density lipoprotein metabolism following the high-fat meal, were shown to modestly decrease by 5% to 12% in the FO group and 12% to 15% in the FO-metformin group from baseline to postintervention compared with metformin treatment alone; however, these reductions did not reach statistical significance.
Correlation and Regression Analysis of Fasting and Nonfasting Plasma Triglycerides, ApoB-Lipoproteins, Body Weight and Insulin Indices
Total body weight, BMI, and % fat mass tended to be reduced to a greater extent in the FO-metformin group compared with the metformin and FO groups; therefore, we tested if the percentage change in these parameters was correlated with percentage change in fasting and nonfasting plasma lipids and ApoB-lipoproteins from baseline to postintervention (Table 3). A decrease in % fat mass was shown to be positively correlated with a decrease in fasting plasma TG. Furthermore, based on our current data of trends for improvements in fasting insulin and HOMA-IR in all intervention groups, we also explored the correlation of these indices with % change in fasting and nonfasting plasma lipids and ApoB-lipoproteins from baseline to postintervention. We found no significant correlations of percentage change in insulin or HOMA-IR with percentage change in fasting and nonfasting plasma lipids and ApoB-lipoproteins from baseline to postintervention (Table 3). We further performed a multiple linear regression model analyses with the dependent primary variable of percentage change in fasting TG from baseline to postintervention with predictive variables of percentage change in % fat mass and insulin. These parameters were also chosen on the basis of our previous findings and the pathophysiological relationship of these variables [1, 29]. In the model we found no interaction effect of percentage change in insulin on the ability of % fat mass to predict percentage change in plasma TG (data not shown).
Correlation of fasting and nonfasting plasma lipids and ApoB-lipoproteins with body weight and insulin indices from baseline from baseline to postintervention following 12 weeks of treatment with metformin, fish oil, or fish oil-metformin in women with PCOS
| Variable | % BMI | % BW | % FM (%) | % Insulin | %HOMA-IR |
|---|---|---|---|---|---|
| Fasting | |||||
| % TG | 0.03 | 0.20 | 0.49* | -0.05 | 0.07 |
| % TC | 0.05 | 0.24 | 0.07 | 0.37 | 0.03 |
| % LDL-C | 0.05 | 0.23 | 0.23 | 0.33 | 0.28 |
| % HDL-C | 0.01 | -0.02 | -0.28 | 0.37 | 0.28 |
| % Non-HDL-C | 0.07 | 0.28 | 0.18 | 0.29 | 0.26 |
| % ApoB48 | 0.01 | 0.02 | -0.02 | -0.08 | -0.14 |
| % ApoB100 | 0.03 | -0.15 | 0.04 | -0.09 | 0.17 |
| Nonfasting | |||||
| % TGAUC | 0.08 | 0.09 | 0.27 | -0.01 | -0.13 |
| % ApoB48AUC | 0.25 | 0.26 | -0.04 | 0.08 | -0.02 |
| % ApoB100AUC | 0.02 | 0.01 | 0.04 | 0.19 | 0.17 |
Variables are %, change in variable from baseline to postintervention.
Abbreviations: AUC, area under the curve; BMI, body mass index. BW, body weight; FM, fat mass; HDL-C, high-density lipoprotein cholesterol; LDL-C, low-density lipoprotein cholesterol; non-HDL-C, non-high-density lipoprotein cholesterol, TC, total cholesterol; TG, triglycerides. *P < 0.01
Discussion
Premature onset of ACVD, including cIMT and endothelial dysfunction, is increased in young women with PCOS [11-16, 57]. Population studies have shown that women with PCOS have a 2-fold higher incidence of CVD, including hypertension and ischemic vascular disease [5, 8, 9]. Atherogenic dyslipidemia, including elevated fasting and nonfasting TG and ApoB-lipoprotein cholesterol remnants, are causative risk factors in the development of ACVD and end-stage ischemic CVD events [24, 25, 58]. The aim of this pilot trial was to investigate the potential effect of metformin compared with high dose FO or combination FO-metformin treatment on fasting and nonfasting plasma TG, and apoB-lipoprotein remnant concentrations in young women with PCOS and the MetS. Consistent with our findings in youth and adolescents with PCOS and MetS, we have shown that young women (18-30 years of age) with PCOS and MetS have elevated fasting and postprandial plasma TG, ApoB48-, and ApoB100-lipoprotein remnants [1, 29, 52]. The results of this small pilot study demonstrate a strong trend for FO and FO-metformin combination treatment to reduce fasting TG and apoB48-lipoprotein remnants compared with monotherapy with metformin in young women with PCOS and MetS. Reductions in fasting and postprandial plasma TG and apoB48-lipoprotein remnants were 15% to 40% following the high dose FO and FO-metformin treatments. Despite a lack of statistical difference between groups, reductions in these risk factors can represent significant clinical improvement in individuals. For example, a decrease in plasma TG and ApoB-remnants by 1 mmol/L or >20% is associated with significant reductions in clinical CVD risk [24, 59]. Furthermore, elevated nonfasting plasma apoB48-remnants have been observed in normolipidemic and hyperlipidemic females with coronary heart disease and it provides an early subclinical biomarker of ACVD and “residual risk” of CVD events [25, 60, 61]. Long-term studies are required to track PCOS patients with fasting and nonfasting hypertriglyceridemia and ApoB-remnant dyslipidemia to determine if they present with increased morbidity and mortality from CVD and ischemic events later in life compared with women without PCOS.
We implemented first-line recommendations of dietary-lifestyle counseling and found no significant improvement between groups in body weight, BMI, % fat mass, or waist circumference. However, the FO-metformin group showed a tendency for reductions in body weight, % fat mass, and BMI. In correlation analyses we showed that only % fat mass was positively associated with improvements in fasting plasma TG, consistent with previous studies, but it was not associated with improvements in other lipids or apoB-lipoproteins [1, 29]. These results suggest improvements at least in fasting plasma TG may be dependent on improvements in % fat mass following interventions. The FO-metformin intervention was shown to have a greater improvement in fasting plasma insulin and HOMA-IR compared with the metformin and FO groups; however, correlation analyses showed no association of these variables with fasting and nonfasting lipids and apoB-lipoproteins. In regression analyses, we further explored the effect of insulin and % fat mass on fasting and nonfasting lipids and ApoB-lipoproteins. We found adjustment of these variables did not impact the primary lipid and ApoB-lipoprotein outcomes. These results suggest that improvements in fasting and nonfasting and apoB-lipoproteins, and nonfasting plasma TG were independent of improvements in % fat mass and insulin indices.
The mechanisms and treatments to target increased atherogenic dyslipidemia and ACVD risk remain understudied in PCOS [5, 62]. We have shown that androgens via the androgen receptor can exacerbate lipogenesis and dyslipidemia in conditions of insulin resistance and obesity [63, 64]. The clinical challenge in PCOS is that individuals often have insulin resistance and obesity, and together with hyperandrogenemia this appears to exacerbate ApoB-remnant dyslipidemia and premature development of ACVD [3, 5, 13, 19, 62, 65]. To date there have been limited interventional studies that specifically target ApoB-remnant dyslipidemia and subclinical ACVD in PCOS [2, 66]. Our findings in this study are consistent with meta-analyses of metformin monotherapy that show no significant improvements in fasting plasma lipids in women with PCOS, particularly those with obesity [34, 36]. However, we did show trends for improvements in all fasting plasma lipids with metformin treatment. Our data is also consistent with meta-analyses that show FO lowers fasting plasma TG and ApoB-lipoproteins by 15% to 45%, and FO specifically targets the nonfasting excursion in plasma TG following a lipid meal [42, 67]. We have shown that FO can reduce intestinal secretion of ApoB48 and TG through inhibition of the nuclear receptor SREBP-1c in an animal model of MetS [68]. The ANCHOR study showed that high dose EPA-ester can lower plasma TG, total apoB, and non-HDL cholesterol (an indirect marker of remnant cholesterol) in older high-risk women with T2D on statin therapy [69]. Previous trials with low dose omega-3 fatty acids (<1 g EPA/DHA) have shown mixed effects, including no effect on major adverse cardiac events and significant reductions in secondary outcomes, such as heart attack and coronary heart disease risk [70, 71]. These studies examined older participants (>50-90 years of age) taking statins and those with preexisting health outcomes such as diabetes, coronary heart disease and stroke [70, 71]. Long-term interventions with high dose EPA (>2-4 g, FO, or EPA-ester or EPA/DHA) have shown reduced incidence of end-stage CVD events in older patients on statin therapy with hypertriglyceridemia and diabetes [44, 72-75]. A longer-term trial is needed in young and older women with PCOS to test the efficacy of high dose FO to reduce plasma ApoB-lipoprotein remnants and TG, as well as the development and progression of subclinical ACVD.
The limitations of this pilot trial are the small sample size and large interindividual variation in fasting and postprandial response to the high-fat meal leading to a lack of statistical significance in postintervention results between groups. Standard available hospital antibody-based methods for quantification of steroid hormones were used and this is a limitation of the study. We also did not determine the presence of ACVD, such as cIMT or endothelial vascular function, at baseline or postintervention. In young women aged 18-30 years increased incidence of premature ACVD has been reported [9, 13-16]; however, this age group is young to observe advanced atherosclerotic lesions and ischemic CVD events, as these are observed in later life [5, 76]. Three months is a short period of time to target prevention or progression of ACVD, as this disease develops over decades and is usually diagnosed in mid to late adulthood (>50 years) following an ischemic or vascular event [3, 5, 76]. In preclinical studies, we have explored the mechanisms of FO and metformin on lipogenic mechanistic pathways; however, in this study we did not explore mechanisms [64, 68]. FO is known to have anti-inflammatory effects [44] but we did not measure inflammatory or cardiac function indices in this pilot trial.
The findings of this pilot trial show that high dose FO and FO-metformin combination therapy tend to lower fasting and postprandial plasma TG and ApoB-lipoprotein remnants to a greater extent compared with metformin alone in young women with PCOS and MetS. These results may be clinically significant for management of fasting and nonfasting atherogenic dyslipidemia and prevention of early ACVD in these individuals. PCOS women with MetS are at higher risk for the development of ACVD, and nutrition-lifestyle counseling combined with FO-metformin and/or other treatments used in PCOS may form a polytherapeutic approach to prevent early ACVD [76].
Abbreviations
- ACVD
atherosclerotic cardiovascular disease
- apoB
apolipoprotein B
- AUC
area under the curve
- cIMT
carotid intimal medial thickness
- CVD
cardiovascular disease
- DHA
docosahexaenoic acid
- EPA
eicosapentaenoic acid
- FAI
free androgen index
- FO
fish oil
- HDL-C
high-density lipoprotein cholesterol
- HOMA-IR
homeostatic model assessment of insulin resistance
- iAUC
incremental area under the curve
- ICV
intra-assay coefficient of variation
- LDL-C
low-density lipoprotein cholesterol
- LQ
limit of quantification
- MetS
metabolic syndrome
- OGT
oral glucose tolerance test
- PCOS
polycystic ovary syndrome
- SHBG
sex hormone binding globulin
- T2D
type 2 diabetes
- TG
triglyceride
Acknowledgments
The study was supported by bridge and pilot funding from the Women and Children’s Health Research Institute (DV), Alberta Diabetes Institute (DV) and Canadian Institute for Health Research (DV). EP and OW were funded by NSERC Summer Studentships.
Additional Information
Disclosures: The authors have nothing to disclose.
Data Availability
Some or all datasets generated during and/or analyzed during the current study are not publicly available but are available from the corresponding author on reasonable request.
Clinical Trial Information: Clinicaltrials.gov registration no. NCT04116203.
