


Abstract
In an open-label, randomized, controlled, phase 3 trial in 61 children aged 1 to 12 years with X-linked hypophosphatemia (XLH), burosumab improved rickets vs continuing conventional therapy with active vitamin D and phosphate.
We conducted an analysis to determine whether skeletal responses differed when switching to burosumab vs continuing higher or lower doses of conventional therapy.
Conventional therapy dose groups were defined as higher-dose phosphate [greater than 40 mg/kg] (HPi), lower-dose phosphate [40 mg/kg or less] (LPi), higher-dose alfacalcidol [greater than 60 ng/kg] or calcitriol [greater than 30 ng/kg] (HD), and lower-dose alfacalcidol [60 ng/kg or less] or calcitriol [30 ng/kg or less] (LD).
At week 64, the Radiographic Global Impression of Change (RGI-C) for rickets was higher (better) in children randomly assigned to burosumab vs conventional therapy for all prebaseline dose groups: HPi (+1.72 vs +0.67), LPi (+2.14 vs +1.08), HD (+1.90 vs +0.94), LD (+2.11 vs +1.06). At week 64, the RGI-C for rickets was also higher in children randomly assigned to burosumab (+2.06) vs conventional therapy for all on-study dose groups: HPi (+1.03), LPi (+1.05), HD (+1.45), LD (+0.72). Serum alkaline phosphatase (ALP) also decreased in the burosumab-treated patients more than in the conventional therapy group, regardless of on-study phosphate and active vitamin D doses.
Prior phosphate or active vitamin D doses did not influence treatment response after switching to burosumab among children with XLH and active radiographic rickets. Switching from conventional therapy to burosumab improved rickets and serum ALP more than continuing either higher or lower doses of phosphate or active vitamin D.
X-linked hypophosphatemia (XLH) is a heritable, lifelong disease characterized by hypophosphatemia and impaired skeletal mineralization due to fibroblast growth factor 23 (FGF23)-induced renal phosphate wasting. In affected children, complications include rickets, skeletal deformities (primarily of the lower extremities), craniosynostosis, short stature, pain, and morning stiffness. In affected adults, complications include fractures, pseudofractures, enthesopathy, osteoarthritis, pain, stiffness, and impaired physical function. Despite treatment with oral phosphate and active vitamin D (conventional therapy), skeletal complications still occur both in children and adults. Treatment with conventional therapy also increases the risk of nephrocalcinosis (1, 2).
Burosumab, a fully human IgG1 monoclonal antibody to FGF23, binds and blocks FGF23 activity, leading to increased renal phosphate reabsorption and increased circulating 1,25-dihydroxyvitamin D (1,25[OH]2D), affecting intestinal phosphate absorption. These changes result in higher serum phosphorus concentrations in burosumab-treated people with XLH, resulting in improved rickets, bone deformity, and growth in affected children, and improved osteomalacia and stiffness in affected adults (3-6). Burosumab is approved to treat children and adults with XLH in multiple countries.
Herein, we determined whether skeletal responses and safety differed when switching to burosumab vs continuing higher or lower doses of conventional therapy in children with XLH.
Materials and Methods
The published pivotal trial was an open-label, active-controlled, randomized phase 3 study (UX023-CL301; NCT02915705) that compared burosumab with oral phosphate and active vitamin D (Pi/D) dosed in accordance with published guidelines (1, 7). Briefly, children with XLH, aged 1 to 12 years inclusive, were eligible if taking conventional therapy for at least 6 months (if age < 3 years) or for at least 12 months (if age ≥ 3 years) immediately preceding the study, and whose Rickets Severity Score (RSS) on a scale of 0 to 10 was 2.0 or greater based on wrist posteroanterior and knee anteroposterior radiographs. After a 1-week conventional therapy washout period, participants were randomly assigned (1:1), stratified by age (< 5 vs ≥ 5 years), RSS score (≤ 2.5 vs > 2.5), and region (Japan vs rest of the world), to receive subcutaneous burosumab starting at 0.8 mg/kg every 2 weeks or resume oral phosphate and active vitamin D as prescribed by the investigator. The dose adjustments of conventional therapy were not specified by the trial protocol and were based on investigator judgement informed by widely used published expert recommendations (1, 8, 9). The burosumab dose could be increased to 1.2 mg/kg to achieve serum phosphorus levels in the normal range (lower limit of normal for the central laboratory was 3.2 mg/dL). The randomized treatment was evaluated for 64 weeks.
Compared with continuing oral phosphate and active vitamin D therapy, switching treatment to burosumab resulted in significantly greater increases in serum phosphorus concentrations and greater improvements in rickets, lower-limb deformity (LLD), growth, mobility, and patient-reported outcomes (7, 10).
Subgroup Analyses
In this post hoc subanalysis, we assessed the response to burosumab by both the doses of oral phosphate and active vitamin D administered before study enrollment (designated prebaseline) and on-study doses during the 64 weeks of the trial (designated on-study).
Categorization of Phosphate and Active Vitamin D Using Published Dose Thresholds
The threshold categories for higher- and lower-dose oral phosphate and active vitamin D in this analysis were prespecified based on the upper end of the range of oral phosphate and active vitamin D dosing guidelines from a publication in patients with XLH (8, 9). Those receiving doses higher than this upper threshold were considered to be in the higher-dose category and those receiving doses lower than this threshold were considered to be in the lower-dose category, relative to published dosing guidelines. We used the same dosing categorizations for analysis of groups according to prebaseline and on-study dose levels. The oral phosphate and active vitamin D dose categories were designated as follows: higher-dose phosphate greater than 40 mg/kg (HPi), lower-dose phosphate 40 mg/kg or less (LPi), higher-dose alfacalcidol greater than 60 ng/kg or calcitriol greater than 30 ng/kg (HD), and lower-dose alfacalcidol 60 ng/kg or less or calcitriol 30 ng/kg or less (LD). Assignments to prebaseline HPi, LPi, HD, and LD dose categories were based on doses reported just before the study screening visit, and assignments to on-study HPi, LPi, HD, and LD dose categories were based on average daily doses administered from baseline to end of study at week 64.
Radiographs of the wrist and knee were assessed using the Radiographic Global Impression of Change (RGI-C) methodology for rickets, a 7-point comparative ordinal scale that ranges from –3 (severe worsening) to 0 (no change) to +3 (complete or near complete healing) (11, 12). Employing this methodology, baseline radiographs were directly compared with subsequent images obtained at week 40 and week 64. Three radiologists, blinded to treatment group assignment (burosumab vs conventional therapy) and prior/current doses of conventional therapy, assigned scores that were averaged for each comparative time point. The RGI-C methodology was also applied to standing lower-limb radiographs to assess LLD score.
Binary Categorization of Phosphate and Active Vitamin D Dosing Above and Below Median Dose
As a secondary approach, we also conducted analyses separating the prebaseline and on-study groups by the median dose of conventional therapy during the prebaseline and on-study time periods to further validate our original strategy given the lack of formal statistical comparisons in this substudy. This approach resulted in different dose levels being used to separate the groups in the prebaseline and on-study treatment periods. The median prebaseline oral phosphate and active vitamin D dose levels resulted in the following categories: higher-dose phosphate greater than 17 mg/kg (HPi), lower-dose phosphate 17 mg/kg or less (LPi), higher-dose alfacalcidol greater than 52 ng/kg or calcitriol greater than 19 ng/kg (HD), and lower dose alfacalcidol 52 ng/kg or less or calcitriol 19 ng/kg or less (LD). The median on-study oral phosphate and active vitamin D dose levels resulted in the following categories: higher-dose phosphate greater than 35 mg/kg (HPi), lower-dose phosphate 35 mg/kg or less (LPi), higher-dose alfacalcidol greater than 67 ng/kg or calcitriol greater than 22 ng/kg (HD), and lower dose alfacalcidol 67 ng/kg or less or calcitriol 22 ng/kg or less (LD).
Statistical Methods
As the substudy and related post hoc analyses were not powered a priori to assess differences between the conventional therapy dose groups, descriptive statistics were used to summarize the data, and results were interpreted from a clinical perspective.
Results
Radiographic Analysis by Prebaseline Conventional Therapy Doses—Divided by Published Dose Thresholds
A total of 61 patients were randomly assigned to treatment: 29 to burosumab and 32 to oral phosphate and active vitamin D. Before randomization, fewer patients received prior HPi (9/61, 15%) and HD (13/61, 21%; Table 1 and Table 2). Patients who received HPi prebaseline were younger and had lower baseline RSS in both randomized treatment groups (see Table 1). As described in the original full trial publication, adherence during the trial was high in all groups (7). On-trial compliance with conventional therapy was greater than 95% for all children during the 64-week study period, with 10 (31%) missing 1 to 2 days of dosing and 3 (9%) missing 3 to 7 full (nonconsecutive) days of dosing. In the burosumab group, 3 (10%) children each missed 1 dose.
Baseline demographics and clinical features by treatment group determined using the prebaseline oral phosphate dose
| Randomized study groups | Burosumab (N = 29) | Oral phosphate/active vitamin D (N = 32) | ||
|---|---|---|---|---|
| Prebaseline treatment categories | Higher dose Oral phosphate > 40 mg/kg (n = 6) | Lower dose Oral phosphate ≤ 40 mg/kg (n = 23) | Higher dose Oral phosphate > 40 mg/kg (n = 3) | Lower dose Oral phosphate ≤ 40 mg/kg (n = 29) |
| Age, mean (SD) (range), y | 5.2 (3.2) (1.8-10.6) | 6.0 (3.5) (0.8-12.8) | 4.6 (1.5) (2.9-5.7) | 6.5 (3.3) (1.2-11.9) |
| Male, n (%) | 3 (50) | 10 (43) | 2 (67) | 12 (41) |
| Total RSS score, mean (SD) (range) | 3.0 (1.7) (2.0-6.5) | 3.2 (0.7) (2.0-5.0) | 2.7 (0.6) (2.0-3.0) | 3.2 (1.2) (2.0-6.5) |
| ALP, % of upper limit of normal, mean (SD) | 148 (34) | 163 (47) | 159 (42) | 161 (44) |
| Standing height Z score, mean (SD) | −2.5 (0.7) | −2.3 (1.3) | −2.0 (0.5) | −2.1 (0.9) |
| Renal ultrasound score—n (%) | ||||
| 0 | 6 (100) | 18 (78) | 2 (67) | 21 (72) |
| 1 | 0 (0) | 2 (9) | 0 (0) | 3 (10) |
| 2 | 0 (0) | 2 (9) | 0 (0) | 3 (10) |
| 3 | 0 (0) | 1 (4) | 1 (33) | 2 (7) |
Abbreviations: ALP, alkaline phosphatase; RSS, Rickets Severity Score.
Baseline demographics and clinical features by treatment group determined using the prebaseline active vitamin D dose
| Randomized study groups | Burosumab (N = 29) | Oral phosphate/active vitamin D (N = 32) | ||
|---|---|---|---|---|
| Prebaseline treatment categories | Higher dose Active vitamin Da(n = 7) | Lower dose Active vitamin Db(n = 22) | Higher dose Active vitamin Da(n = 6) | Lower dose Active vitamin Db(n = 26) |
| Age, mean (SD) (range), y | 4.6 (3.1)(0.8-10.6) | 6.2 (3.5)(1.0-12.8) | 6.5 (2.9)(2.9-10.4) | 6.3 (3.4)(1.2-11.9) |
| Male, n (%) | 3 (43) | 10 (46) | 2 (33) | 12 (46) |
| Total RSS score, mean (SD) (range) | 2.7 (0.5)(2.0-3.5) | 3.3 (1.1)(2.0-6.5) | 2.6 (0.5)(2.0-3.0) | 3.3 (1.2)(2.0-6.5) |
| ALP, % of upper limit of normal, mean (SD) | 163 (41) | 159 (47) | 174 (69) | 158 (37) |
| Standing height Z score, mean (SD) | −2.6 (1.2) | −2.2 (1.2) | −2.4 (0.4) | −2.0 (0.9) |
| Renal ultrasound score—n (%) | ||||
| 0 | 7 (100) | 17 (77) | 4 (67) | 19 (73) |
| 1 | 0 (0) | 2 (9) | 0 (0) | 3 (12) |
| 2 | 0 (0) | 2 (9) | 1 (17) | 2 (8) |
| 3 | 0 (0) | 1 (5) | 1 (17) | 2 (8) |
Abbreviations: ALP, alkaline phosphatase; RSS, Rickets Severity Score.
Calcitriol greater than 30 ng/kg or alfacalcidol greater than 60 ng/kg.
Calcitriol 30 ng/kg or less or alfacalcidol 60 ng/kg or less.
At end of the study at week 64, RGI-C rickets scores were substantially higher (ie, better) if receiving burosumab vs conventional therapy, regardless of whether prebaseline phosphate doses were higher (RGI-C rickets +1.72) or lower (RGI-C rickets +2.14; Fig. 1A). Similarly, RGI-C rickets scores were higher if receiving burosumab vs conventional therapy, regardless of whether prebaseline active vitamin D doses were higher (RGI-C rickets +1.90) or lower (RGI-C rickets +2.11; Fig. 1B).
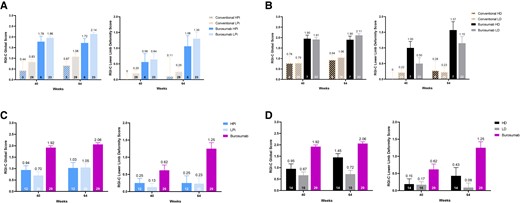
A, Mean Radiographic Global Impression of Change (RGI-C) rickets and lower-limb deformity score with burosumab vs conventional therapy stratified by prebaseline doses of oral phosphate using published dose thresholds. B, Mean RGI-C rickets and lower-limb deformity score with burosumab vs conventional therapy stratified by prebaseline doses of active vitamin D using published dose thresholds. C, Mean (SE) RGI-C rickets and lower-limb deformity scores with burosumab vs on-study doses of phosphate using published dose thresholds. D, Mean (SE) RGI-C rickets and lower-limb deformity scores with burosumab vs on-study doses of active vitamin D using published dose thresholds. Number above error bar is the mean; error bar denotes SE; number within column is number of patients contributing to the result shown.
At week 64, RGI-C LLD scores were also substantially higher if receiving burosumab vs conventional therapy, regardless of whether prebaseline phosphate doses were higher (RGI-C LLD +1.06) or lower (RGI-C LLD +1.30; see Fig. 1A). Similarly, RGI-C LLD scores were higher if receiving burosumab vs conventional therapy, regardless of whether prebaseline active vitamin D doses were higher (RGI-C LLD +1.57) or lower (RGI-C LLD +1.15; see Fig. 1B).
Radiographic Analysis by On-Study Doses of Conventional Therapy vs Burosumab—Divided by Published Dose Thresholds
On-study, fewer patients in the conventional therapy arm received HPi and HD. Baseline characteristics of patients receiving on-study HPi and LPi were generally similar regarding age, RSS, and alkaline phosphatase (ALP), while those receiving on-study HD were younger than those receiving on-study LD (Table 3).
Baseline demographics and clinical features of children receiving on-study higher- and lower-dose oral phosphate and on-study higher- and lower-dose active vitamin D
| Randomized study groups | Burosumab (N = 29) | Oral phosphate/active vitamin D(N = 32) | |||
|---|---|---|---|---|---|
| On-study treatment categories | Burosumab (N = 29) | Higher dose Oral phosphate > 40 mg/kg (n = 12) | Lower dose Oral phosphate ≤ 40 mg/kg (n = 20) | Higher doseActive vitamin Da(n = 14) | Lower doseActive vitamin Db(n = 18) |
| Age, mean (SD) (range), y | 5.8 (3.4)(0.8-12.8) | 6.0 (2.3)(1.8-9.2) | 6.6 (3.7)(1.2-11.9) | 5.2 (3.4)(1.2-11.8) | 7.3 (2.9)(2.9-11.9) |
| Male, n (%) | 13 (45) | 4 (33) | 10 (50) | 7 (50) | 7 (39) |
| Total RSS score, mean (SD) (range) | 3.2 (1.0)(2.0-6.5) | 3.0 (1.0)(2.0-4.5) | 3.3 (1.2)(2.0-6.5) | 3.2 (1.2)(2.0-6.5) | 3.2 (1.1)(2.0-6.0) |
| ALP, % of upper limit of normal, mean (SD) | 160 (45) | 171 (39) | 155 (46) | 174 (56) | 150 (29) |
| Standing height Z score, mean (SD) | −2.3 (1.2) | −2.1 (1.0) | −2.0 (0.8) | −2.3 (1.0) | −1.9 (0.8) |
| Renal ultrasound score—n (%) | |||||
| 0 | 24 (83) | 8 (67) | 15 (75) | 10 (71) | 13 (72) |
| 1 | 2 (7) | 1 (8) | 2 (10) | 0 (0) | 3 (17) |
| 2 | 2 (7) | 3 (25) | 0 (0) | 2 (14) | 1 (6) |
| 3 | 1 (3) | 0 (0) | 3 (15) | 2 (14) | 1 (6) |
Abbreviations: ALP, alkaline phosphatase; RSS, Rickets Severity Score.
Calcitriol greater than 30 ng/kg or alfacalcidol greater than 60 ng/kg.
Calcitriol 30 ng/kg or less or alfacalcidol 60 ng/kg or less.
At week 40 and week 64, RGI-C rickets and RGI-C LLD scores were substantially higher (indicating greater improvement) with burosumab than with conventional therapy, regardless of whether a higher or lower oral phosphate dose was administered during the study (Fig. 1C). Similarly, RGI-C rickets and RGI-C LLD scores with burosumab were substantially higher than with active vitamin D (Fig. 1D), regardless of whether a higher or lower active vitamin D dose was administered during the study. In the conventional therapy group, RGI-C rickets and RGI-C LLD scores at week 64 were higher in those receiving on-study HD than those receiving LD; however, as noted earlier, both were considerably lower than that observed with burosumab.
Biochemical Outcomes—Divided by Published Dose Thresholds
Serum ALP decreased more in burosumab-treated patients than in the conventional therapy group, regardless of the prebaseline or on-study doses of phosphate and active vitamin D (Fig. 2A and Fig. 3). In burosumab-treated patients, mean serum parathyroid hormone (PTH) levels transiently exceeded the normal range before week 44 in the prebaseline LPi and the prebaseline LD groups (Fig. 2B). Nevertheless, mean PTH was higher at week 52 and week 64 in the conventional therapy groups receiving on-study HPi and LD (Fig. 4). No participant had worsening nephrocalcinosis scores at week 64.
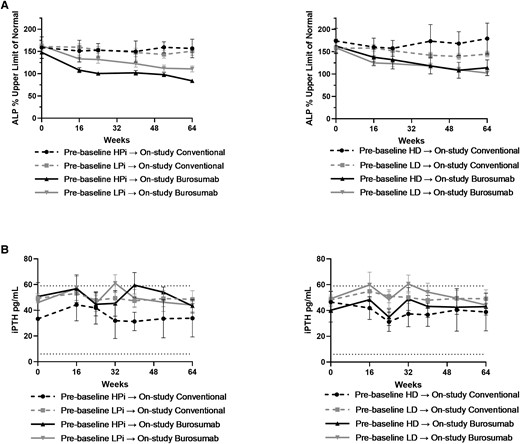
A, Mean (SE) percentage of the upper limit of normal for alkaline phosphatase (ALP) stratified by prebaseline dose of oral phosphate (left panel) and active vitamin D (right panel). B, Mean (SE) serum parathyroid hormone (iPTH) stratified by prebaseline dose of oral phosphate (left panel) and active vitamin D (right panel). Symbol represents mean for each time point; error bar denotes SE.
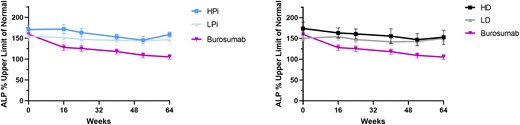
Mean (SE) percentage of the upper limit of normal for alkaline phosphatase (ALP) with burosumab vs on-study higher (HPi)/lower dose phosphate (LPi) and on-study higher (HD)/lower dose active vitamin D (LD). Symbol represents mean for each time point; error bar denotes SE.
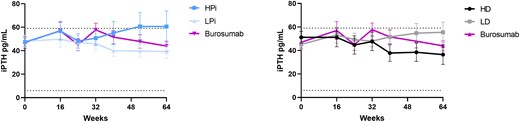
Mean (SE) serum parathyroid hormone (iPTH) with burosumab and conventional therapy by on-study doses of phosphate (left panel) and active vitamin D (right panel). Symbol represents mean for each time point; error bar denotes SE.
Analysis of Binary Categorization of Phosphate and Active Vitamin D Dosing Above and Below Median Prebaseline Doses
Creating groups based on the median dose levels resulted in some patients from the prior lower-dose groups being counted among the higher-dose groups for analysis: A total of 11 patients were recategorized from LPi to HPi, and 10 patients were recategorized from LD to HD in the prebaseline burosumab treatment categories; 9 patients were recategorized from LPi to HPi, and 7 patients were recategorized from LD to HD in the prebaseline oral phosphate/active vitamin D treatment categories.
Baseline demographics and clinical features by treatment group using the median prebaseline oral phosphate doses are shown in Supplementary Table S1 (13). Baseline demographics and clinical features by treatment group using the median prebaseline active vitamin D doses are shown in Supplementary Table S2 (13). As expected using median doses as the cutoff for separating the treatment groups, similar numbers of patients received prior HPi (29/61, 48%)/LPi (32/61, 52%), and HD (30/61, 49%)/LD (31/61, 51%; Supplementary Tables S1 and S2) (13). However, because randomization was not stratified by prebaseline dose levels, some inequalities in the distribution of prior treatment level persisted among those randomly assigned to burosumab vs ongoing conventional therapy.
Radiographic Analysis Using Binary Categorization Above and Below Median Prebaseline Conventional Therapy Doses
At the end of the study at week 64, RGI-C rickets scores were substantially higher (ie, better) if receiving burosumab vs conventional therapy, regardless of whether prebaseline phosphate doses were higher (RGI-C rickets +2.04) or lower (RGI-C rickets +2.08; Supplementary Fig. S1A) than the median (13). Similarly, RGI-C rickets scores were higher if receiving burosumab vs conventional therapy, regardless of whether prebaseline active vitamin D doses were higher (RGI-C rickets +2.06) or lower (RGI-C rickets +2.06; Supplementary Fig. S1B) than the median (13).
At week 64, RGI-C LLD scores were also substantially higher if receiving burosumab vs conventional therapy, regardless of whether prebaseline phosphate doses were higher (RGI-C LLD +0.98) or lower (RGI-C LLD +1.64; see Supplementary Fig. S1A) than the median (13). Similarly, RGI-C LLD scores were higher if receiving burosumab vs conventional therapy, regardless of whether prebaseline active vitamin D doses were higher (RGI-C LLD +1.18) or lower (RGI-C LLD +1.36; see Supplementary Fig. S1B) than the median (13).
These findings using the median dose for grouping patients confirm the findings of our main analysis that used cutoffs based on the higher dose level of conventional therapy using published doses for patients with XLH (8).
Analysis of Binary Categorization of Phosphate and Active Vitamin D Dosing Above and Below Median On-Study Doses
Grouping patients based on the on-study median doses resulted in 4 patients being recategorized from LPi to HPi and 1 patient being recategorized from LD to HD in the on-study treatment categories. Baseline demographics and clinical features by treatment group using the on-study higher and lower oral phosphate and on-study higher- and lower-dose active vitamin D based on the medians are shown in Supplementary Table S3. Consistent with using median doses for dividing the prebaseline groups, similar numbers of patients received on-study HPi (16/32, 50%) and LPi (16/32, 50%), as well as HD (15/32, 47%) and LD (17/32, 53%; see Supplementary Table S3) (13).
Radiographic Analysis Using Binary Categorization Above and Below Median On-Study Conventional Therapy Doses
Consistent with the findings from the original analysis using the cutoff points from the literature to divide groups, at week 40 and week 64, RGI-C rickets and RGI-C LLD scores were substantially higher with burosumab than with conventional therapy, regardless of whether on-study oral phosphate doses were higher or lower than the median (Supplementary Fig. S1C) (13). Similarly, RGI-C rickets and RGI-C LLD scores with burosumab were substantially higher than with active vitamin D (Supplementary Fig. S1D), regardless of whether on-study oral phosphate doses were higher or lower than the median (13). Also consistent with the original analysis, in the conventional therapy group, RGI-C rickets and RGI-C LLD scores at week 64 were higher in those receiving on-study HD than in those receiving LD; however, as noted earlier, both were considerably lower than that observed with burosumab. As such, there were no meaningful differences in results between the 2 methods of dose categorization.
Discussion
Herein, we found post hoc that among children with XLH aged 1 to 12 years with RSS of 2.0 or greater, doses of phosphate or active vitamin D received previously as conventional therapy did not influence subsequent beneficial response after switching to burosumab treatment. Those who transitioned from higher doses of conventional therapy to burosumab still had substantial improvements in rickets after 64 weeks of burosumab treatment. Burosumab therapy also led to greater improvements in rickets, LLD, and serum ALP than did conventional therapy, regardless of oral phosphate or active vitamin D doses continued during the study, though sample sizes in the conventional therapy subgroups were smaller than in the burosumab group.
With ongoing conventional therapy, changes in RGI-C rickets and RGI-C LLD scores at week 64 were similar, regardless of phosphate dose, whereas those who received HD had better RGI-C scores at week 64 than those receiving LD. Nevertheless, even in the HD- and/or HPi-dose groups, responses to therapy, assessed by rickets and LLD RGI-C scores, were less than responses to burosumab treatment.
The greater responses with burosumab, documented both by the RGI-C rickets and LLD scores, were also associated with a greater decline in serum ALP compared with continued phosphate or active vitamin D, regardless of dose. Serum ALP was higher at baseline in the HD group compared with the LD group and subsequently showed a greater decline compared with the LD group. In contrast, no decline in mean ALP occurred when analyzed by HPi and LPi groups over the 64-week treatment period. Cumulatively, these results suggest that in the conventional therapy setting, HD may be particularly beneficial.
In our main analysis, the dose thresholds used to define higher vs lower doses were selected based on ranges from a widely cited publication (cited 367 times as of January 27, 2023, per Scopus) on XLH management, which recommended calcitriol dosage of 20 to 30 ng/kg/day and phosphate dosage of 20 to 40 mg/kg/day, in divided doses (8). However, we note that other publications (1, 9) describe even higher doses used in XLH, and that in our investigators’ clinical experiences, many patients may require higher doses depending on skeletal response. Consequently, it is of clinical interest to evaluate whether doses higher than those described in Carpenter et al (8) influence response to subsequent burosumab treatment, and how those doses compare to the use of burosumab. However, this approach did result in more unequal groupings with fewer patients in the higher-dose groups.
Additionally, the study randomization was not stratified by dose level, further compounding differences in subgroup sizes among treatment arms. Using median dose levels as cutoffs for subgroups resulted in more equal group sizes, especially for the on-study conventional therapy analysis (13). However, this resulted in lowering the threshold to be counted as “higher dose” and moving several patients from lower-dose groups into higher-dose groups (13). Indeed, when using medians, now some patients that were in the lower range of the doses described by Carpenter and colleagues (8) for phosphate or calcitriol were counted as “higher dose.” Consequently, this would be expected to blunt any difference in response between groups. However, while this did result in minor changes in the resulting RGI-C for subgroups, the overall results were similar to the results from the published dose thresholds (13). The prior dose level of conventional therapy still did not appear to influence the response to subsequent burosumab for improvement in rickets or LLD. Similarly, the RGI-C after treatment with burosumab still exceeded the RGI-C after treatment with higher doses of conventional therapy (13).
Secondary and tertiary hyperparathyroidism and nephrocalcinosis can be complications of conventional therapy in XLH (8, 9, 14). With such therapy, predisposition to hyperparathyroidism in XLH is postulated to result both from the stimulatory effect of phosphate supplementation on PTH secretion and from the suppressive effect of high circulating FGF23 on renal 1,25(OH)2D biosynthesis (which normally suppresses PTH secretion). During conventional therapy, PTH levels were higher at week 52 and week 64 in the on-study HPi group and lower in the on-study active vitamin D groups, consistent with this pathophysiology.
Burosumab treatment was associated with transient increases in PTH at week 16 and week 32 that returned to baseline at week 64. In the conventional therapy group, PTH levels at week 52 and week 64 were highest in the HPi and LD groups and lowest in the LPi and HD groups. These results match the expected biological responses to normalization of serum phosphate by burosumab.
Nephrocalcinosis, present at baseline in 9 of 32 children (28%) in the conventional therapy arm and in 5 of 29 children (17%) in the burosumab group, did not worsen in any patient up to week 64. Using the same nephrocalcinosis scale we adopted, Verge et al (2) reported that among 24 children aged 1 to 16 years with XLH, 79% had nephrocalcinosis with severity positively related to phosphate dose per kilogram (r = 0.60; P = .002) but not with therapy duration. However, Verge and colleagues (2) also reported that calcitriol dose (mean dose of 25.6 ng/kg/day) was not related to nephrocalcinosis severity.
Limitations of our study include that the dose thresholds for this comparison were selected based on published recommended doses, with values higher than the upper end of these identified ranges referred to as higher-dose alfacalcidol/calcitriol or higher-dose phosphate. The sample size of those in the higher-dose ranges were therefore small; however, the findings were not substantially altered when we used the median dose levels to divide groups. Additionally, the randomized controlled trial was not designed or powered to differentiate the effects of various conventional therapy dose ranges but was instead designed to compare burosumab dosing to continuing conventional therapy. No prospective study, to our knowledge, has systematically compared differing dose levels of conventional therapy in patients with XLH to determine the optimal dose to maximize skeletal improvements and safety. In the same vein, it would be interesting to explore in future studies the determinants of physician prescription of higher oral phosphate and/or active vitamin D doses (including variables such as disease severity markers, growth, safety markers, symptoms, age, and sex).
Owing to small sample sizes, when these conventional therapy groupings were combined for this subanalysis, we were unable to retrospectively assess differences among combined high-or low-dose conventional therapy (eg, HD + HPi vs HD + LPi vs LD + HPi vs LD + LPi). We also could not assess any effect of changes in dose levels from prebaseline to on-study doses of either conventional therapy or burosumab because of insufficient numbers of patients in the different treatment categories.
Finally, the treatment regimen for conventional therapy for patients and their families is quite demanding and requires taking medicines multiple times per day for optimal skeletal effect. While compliance in this study was high for conventional therapy (> 95%) (7), regardless of dose level, the children receiving conventional therapy still had less improvement in rickets than those on burosumab. Burosumab dosing every 2 weeks may be considered more convenient and an easier regimen for patient compliance, in addition to resulting in greater skeletal benefit.
Conclusions
This analysis showed that children with XLH who changed to burosumab treatment from conventional therapy with oral phosphate and active vitamin D had greater improvements in rickets compared with continuing conventional oral phosphate and active vitamin D therapy, regardless of oral phosphate and active vitamin D doses before or during the study. Transient increases in serum PTH were observed in those receiving HPi and LD during the study at week 52 and week 64, an important consideration when monitoring treatment with conventional therapy. Radiographic rickets, LLD, and serum ALP improved more during burosumab therapy than in those continuing either higher or lower doses of phosphate or active vitamin D.
Acknowledgments
Jamie Ziobro of Ultragenyx Pharmaceutical Inc provided medical writing support in the preparation of this manuscript.
Funding
This work was supported by Ultragenyx Pharmaceutical Inc.
Disclosures
E.A.I.: research funding from Ultragenyx Pharmaceutical Inc to institution for clinical trial conduct and consulting fees from Kyowa Kirin. F.H.G.: research funding from Ultragenyx Pharmaceutical Inc to institution for clinical trial conduct. M.P.W.: research funding from Ultragenyx Pharmaceutical Inc to institution for clinical trial conduct. A.A.P.: speaker honoraria and research support paid to institution from Ultragenyx Pharmaceutical Inc. C.F.M.: research funding from Ultragenyx Pharmaceutical Inc to institution for clinical trial conduct. O.N.: speaker honoraria from Pfizer, Abbott, and Biomarin; consulting fees from Kyowa Kirin and Biomarin; and research support from Kyowa Kirin, Ultragenyx Pharmaceutical Inc, and the Swedish Research Council (project 2021-01807). J.H.S.: honoraria and research support paid to institution from Ultragenyx Pharmaceutical Inc. R.P.: honoraria and research support paid to institution from Ultragenyx Pharmaceutical Inc and Kyowa Kirin International. N.N.: consultant to, and participated in clinical trials with, Kyowa Kirin. H.I.C.: consultant and research support paid to institution from Ultragenyx Pharmaceutical Inc. P.P.: salary support from Lumos Pharma Inc. E.S.: research funding from Ultragenyx Pharmaceutical Inc to institution for clinical trial conduct. W.H.: investigator in clinical trials with, and as a consultant for, Ultragenyx Pharmaceutical Inc, and serves as a clinical investigator in clinical trials with and has received research funding from Kyowa Kirin. K.M.: no conflicts of interest. H.T.: funding from Kyowa Kirin Co Ltd. G.S.G.: consultant and research support paid to institution from Ultragenyx Pharmaceutical Inc. A.B.: research funding from Ultragenyx Pharmaceutical Inc to institution for clinical trial conduct. F.P.: research funding from Ultragenyx Pharmaceutical Inc to institution for clinical trial conduct. A.C.: employee and shareholder of Ultragenyx Pharmaceutical Inc. M.S.R.: employee and shareholder of Ultragenyx Pharmaceutical Inc at time of data collection. L.M.W.: participated in clinical trials with, and been a consultant to, Ultragenyx Pharmaceutical Inc (with funds to Dr Ward's institution).
Data Availability
All data sets generated and analyzed during the current study are not publicly available but are available from the corresponding author on reasonable request.
Clinical Trial Information
Clinicaltrials.gov identifier registration number NCT02915705 (registered September 27, 2016).
References
Abbreviations
- 1,25(OH)2D
1,25-dihydroxyvitamin D
- ALP
alkaline phosphatase
- FGF23
fibroblast growth factor 23
- HD
higher-dose alfacalcidol > 60 ng/kg or calcitriol >30 ng/kg
- HPi
higher-dose phosphate
- LD
lower-dose alfacalcidol ≤ 60 ng/kg or calcitriol ≤ 30 ng/kg
- LLD
lower-limb deformity
- LPi
lower-dose phosphate
- PTH
parathyroid hormone
- RGI-C
Radiographic Global Impression of Change
- RSS
Rickets Severity Score
- XLH
X-linked hypophosphatemia
