


Abstract
Longitudinal patterns of resting heart rate (RHR) in patients with diabetes mellitus and their association with health outcomes are not well-characterized.
We sought to explore the RHR trajectories in patients with diabetes mellitus and their association with cardiovascular disease (CVD) and all-cause mortality.
The Kailuan Study is a prospective cohort study. Participants underwent health examinations biennially starting in 2006 and were followed until December 31, 2020.
General community.
A total of 8218 diabetic participants who attended at least 3 of the examinations conducted in 2006, 2008, 2010, and 2012 were included.
CVD and all-cause mortality.
We identified 4 RHR trajectories in participants with diabetes mellitus between 2006 and 2012: low-stable (range, 66.83-64.91 beats/min; n = 1705), moderate-stable (range, 76.30-76.95 beats/min; n = 5437), high-decreasing (mean decreased from 92.14 to 85.60 beats/min; n = 862), and high-increasing (mean increased from 84.03 to 111.62 beats/min; n = 214). During an average follow-up of 7.25 years, 977 cases of CVD and 1162 deaths were identified. Compared with the low-stable trajectory, adjusted hazard ratios (HRs) for CVD were 1.48 (95% CI, 1.02-2.14; P = .04) for the high-increasing trajectory, adjusted HRs for all-cause mortality were 1.34 (95% CI, 1.14-1.58; P < .01) for the moderate-stable trajectory, 1.68 (95% CI, 1.35-2.10; P < .01) for the high-decreasing trajectory, and 2.47 (95% CI, 1.85-3.31; P < .01) for the high-increasing trajectory.
RHR trajectories were associated with the subsequent risks of CVD and all-cause mortality in patients with diabetes mellitus.
The prevalence of diabetes mellitus has increased rapidly in recent years in parallel with societal aging and the ongoing epidemic of obesity (1). Diabetes mellitus is a major metabolic disease associated with severe complications, poor quality of life, and premature mortality (1, 2). Therefore, identifying and managing risk factors is essential for reducing the health burden of diabetes mellitus.
Epidemiological studies have demonstrated that resting heart rate (RHR) is an independent predictor of cardiovascular disease (CVD) and all-cause mortality in patients with diabetes mellitus (3-5). A similar association with mortality has been observed in patients with comorbid diabetes mellitus and stable coronary artery disease (6). More recently, a higher heart rate was shown to increase the risk of albuminuria in those with diabetes (7, 8). However, the findings of the previous studies were based on a single RHR measurement, which could not characterize the association between dynamic changes in RHR and outcomes. Considering that patients with diabetes mellitus often develop dysfunction of the cardiac autonomic nervous system (a main modulator of RHR), it is reasonable to expect a change in RHR with an increasing duration of diabetes mellitus. Therefore, using a single RHR measurement for prediction of risk in patients with diabetes mellitus may produce a biased result. It has been demonstrated that long-term RHR patterns provide valuable prognostic information for assessment of risk (9-12). However, few studies have examined RHR trajectories in relation to adverse health outcomes in patients with diabetes mellitus. Given that RHR might be of greater clinical importance in individuals with diabetes mellitus than in those without diabetes mellitus (5, 6), long-term monitoring and management of RHR would be expected to have a profound impact on prevention of diabetes mellitus-related outcomes. Therefore, the aims of this study were to investigate the RHR trajectories over 6 years in patients with diabetes mellitus and to explore their associations with CVD and all-cause mortality in a large community-based cohort.
Materials and Methods
Study Design and Participants
The Kailuan Study is an ongoing longitudinal cohort study being conducted in the Kailuan community in Tangshan, China. The details of the study design and procedures have been described previously (13, 14). In brief, starting in June 2006, participants from 11 affiliated hospitals in the Kailuan community were enrolled to participate in health examinations that include a questionnaire interview (including demographic characteristics, medical history, and lifestyle factors), physical examinations, and laboratory tests. The resurveys have been conducted biennially thereafter, and records of incident CVD and all-cause mortality are reviewed annually. In the current study, trajectories of heart rate were developed using data from the 2006, 2008, 2010, and 2012 surveys. We included the 9093 participants with a diagnosis of diabetes mellitus who attended for at least 3 examinations between 2006 and 2012. Diabetes mellitus (including types 1 and 2) was defined as a single fasting plasma glucose (FPG) ≥ 7.0 mmol/L, current treatment with antidiabetic medication (including biguanides, α-glucosidase inhibitors, sulfonylureas, glinides, thiazolidinediones, and insulins), or a self-reported medical history of diabetes mellitus (15, 16). Participants were excluded if they had missing RHR data (n = 803) or died before 2012 (n = 72). We also excluded 1250 participants who had a history of CVD before 2012 from the analysis of CVD risk. Finally, we included 6968 participants in the analysis of CVD risk and 8218 in the analysis of all-cause mortality risk (Fig. 1). The study was approved by the ethics committee of Kailuan General Hospital (reference number: 2006-5) and performed in accordance with the Declaration of Helsinki. All participants provided written informed consent.
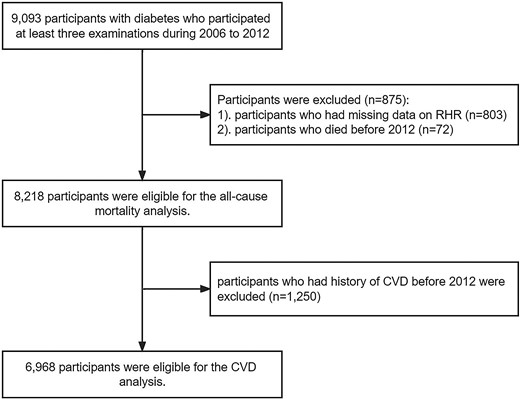
Eligibility of the study patients. The flowchart of the eligibility of study patients included in the current study. Abbreviation: CVD, cardiovascular disease.
Assessment of Heart Rate and Potential Covariates
RHR was measured on a 10-second 12-lead electrocardiogram after the participant had rested in a supine position for 5 minutes. RHR was calculated as the number of R-R intervals divided by the time difference between the first and last beat. Demographic data, including age, sex, and lifestyle factors (including smoking status and alcohol consumption), and medical history were collected using a standardized questionnaire. Height, weight, and blood pressure were measured by a trained physician or nurse during the interview. Body mass index (BMI) was calculated as dividing body weight (kilograms) by the square of height (meters). Blood pressure was measured at least 2 times after the participant had rested in a sitting position for 5 minutes. An additional measurement would be taken if the difference between the 2 measurements was ≥5 mm Hg. The average value of the multiple blood pressure measurements was used for further analysis. Blood samples were collected from the antecubital vein after an 8-hour to 12-hour overnight fast and transfused into vacuum tubes containing ethylene diamine tetra-acetic acid. All blood samples were analyzed in the central laboratory of the Kailuan General Hospital 4 hours after collection. Hemoglobin was measured using the sodium lauryl sulfate-hemoglobin method (SULFOLYSER, SYSMEX Medical Electronics Co. Ltd, Shanghai, China). Concentrations of FPG, triglycerides (TG), low-density lipoprotein cholesterol (LDL-C), high-density lipoprotein cholesterol (HDL-C), creatinine, and C-reactive protein (CRP) were measured using an autoanalyzer (Hitachi 747, Hitachi, Tokyo, Japan). FPG was measured with the hexokinase/glucose-6-phosphate dehydrogenase method. The coefficient of variation using blind quality-control specimens was <2.0%. TG, LDL-C, and HDL-C were measured with the enzymatic colorimetric method. Creatinine was measured with the sarcosine oxidase assay method. CRP was measured with a high-sensitivity particle-enhanced immunonephelometric assay. We used the Chronic Kidney Disease Epidemiology Collaboration creatinine equation (17) to calculate the estimated glomerular filtration rate (eGFR). Proteinuria was examined using dipstick urine analysis (DIRUI N-600, Changchun Dirui Medical Technology Co. Ltd, Changchun, China). Test results of “1+” and above were defined as proteinuria. Chronic kidney disease (CKD) was defined as eGFR <60 mL/min/1.73 m2 or presence of proteinuria.
Assessment of Incident CVD and Mortality
The primary outcomes in this study were CVD and all-cause mortality. Incident CVD was defined as the first occurrence of a CVD event during follow-up, including myocardial infarction, coronary revascularization, systolic heart failure, ischemic stroke, and hemorrhagic stroke. Information on CVD events was ascertained from the records of the Municipal Social Insurance Institution database, discharge registers from all 11 affiliated hospitals in the Kailuan community and questionnaire interviews in the biennial resurveys. A panel of 3 physicians validated the diagnosis of CVD by reviewing the medical records. Myocardial infarction was diagnosed based on symptoms, electrocardiographic findings, and cardiac enzymes according to the criteria of the World Health Organization's Multinational Monitoring of Trends and Determinants in Cardiovascular Disease (18). Coronary revascularization was defined as a medical record of percutaneous coronary intervention or coronary artery bypass grafting. Systolic heart failure was diagnosed based on (1) symptoms of heart failure and cardiac function classified as New York Heart Association cardiac function grade II, III, or IV or Killip II, III, or IV, and (2) left ventricular ejection fraction <50%, according to the European Society of Cardiology guideline (19). Stroke was diagnosed based on symptoms, neurological signs, and findings on computed tomography or magnetic resonance images of the brain based on the World Health Organization criteria (20). Mortality information was collected from provincial vital statistics offices. The participants were monitored for CVD and all-cause mortality until December 31, 2020.
Statistical Analysis
All statistical analyses were performed using SAS version 9.4 (SAS Institute Inc., Cary, NC, USA). A 2-sided P value of <.05 was considered statistically significant. We used RHR trajectories during the 2006 through 2012 period as the primary exposure. The RHR trajectories were identified using latent mixture modeling within the PROC TRAJ procedure in SAS (21-23). We used a censored normal model appropriate for continuous data to estimate multiple trajectories. Model fit was assessed using the Bayesian information criterion. We tested models with the number of trajectory groups ranging from 1 to 5, and the model with 4 trajectories was identified as the optimal fit. We then compared the models with different functional forms, including cubic, quadratic, and linear terms. The final optimal model had 1 trajectory of linear order term, 1 trajectory of quadratic order term, and 2 trajectories of cubic order terms.
Continuous variables were compared using ANOVA or the Kruskal-Wallis test according to distribution, and categorical variables were compared using the χ2 test. The intergroup comparison of RHR among trajectory groups was conducted using ANOVA with a post hoc test. The comparison of RHR within each trajectory was conducted using ANOVA with repeated measures.
We used a Cox proportional hazards regression model to analyze the association of the RHR trajectories with the risks of CVD and all-cause mortality. Model 1 was the crude model. Model 2 was adjusted for demographic characteristics, including age and sex. Model 3 was further adjusted for smoking status, alcohol consumption status, BMI, systolic blood pressure, diastolic blood pressure, hemoglobin, FPG, TG, LDL-C, HDL-C, eGFR, CRP, proteinuria, and use of antidiabetic medications, β-blockers, and calcium channel blockers (CCBs). We also examined the association of the RHR trajectories with subtypes of CVD, including coronary artery disease (myocardial infarction and coronary revascularization), systolic heart failure, and stroke. Our models met the proportional assumption criteria according to Schoenfeld residuals. Missing data on covariates were handled by multiple imputation.
Several sensitivity analyses were conducted to test the robustness of our results. To explore whether the association between RHR trajectories and outcomes could be attributed to the impact of a single measurement of RHR during the 2006 through 2012 period, we performed an analysis further adjusting for RHR measurement in 2006 and 2012, 1 at a time. To examine whether the results of our study could be explained by changes in covariates, we further adjusted for annual changes in BMI, systolic blood pressure, diastolic blood pressure, hemoglobin, FPG, TG, LDL-C, HDL-C, eGFR, and CRP (defined as the slope of the measurements during the 2006-2012 period). To rule out the potential effect of diseases that could influence RHR or accelerate the progression of outcome events, we excluded participants with a history of CVD, atrial fibrillation/flutter, atrial/junctional/ventricular tachycardia, frequent premature atrial/ventricular contractions, Wolff-Parkinson-White syndrome, second-degree or third-degree atrioventricular block, thyroid abnormalities (including enlarged thyroid on palpation, or self-reported history of hyperthyroidism or hypothyroidism), or cancer before the follow-up period in a sensitivity analysis. Given that β-blockers and CCBs could change the RHR trajectories, we conducted an analysis excluding participants who used a β-blocker or CCB between 2006 and 2012. To avoid potential reverse causation, we also excluded participants who had outcome events within the first year of follow-up in a sensitivity analysis.
We performed stratified analyses by age (<60 years vs ≥60 years), sex, BMI (<24 kg/m2 vs ≥24 kg/m2, the cutoff point for normal/overweight people in the Chinese population) (1), FPG (<7 mmol/L vs ≥7 mmol/L), and CKD (yes vs no) to assess for potential statistical interaction. We also examined the association of RHR in 2012, average RHR, annual change in RHR, and RHR variability (defined as the average real variability of RHR measurements during the 2006-2012 period) (24) between 2006 and 2012 as secondary exposures with CVD and all-cause mortality.
Results
Among the 8218 participants with diabetes mellitus included in this study, we identified 4 distinct RHR trajectories based on the measurement at baseline and changing patterns of RHR between 2006 and 2012 (Fig. 2): low-stable (n = 1705 [20.75%], mean RHR ranged from 66.83 to 64.91 beats/min), moderate-stable (n = 5437 [66.16%], mean RHR ranged from 76.30 to 76.95 beats/min), high-decreasing (n = 862 [10.49%], mean RHR decreased from 92.14 to 85.60 beats/min), and high-increasing (n = 214 [2.60%], mean RHR increased from 84.03 to 111.62 beats/min). The intergroup comparison of RHR among 4 trajectory groups is presented in Supplemental Tables S1–S4 (25), and the comparison of RHR within each trajectory was presented in Supplemental Tables S5–S8 (25). Compared with the participants in the moderate-stable, high-decreasing, and high-increasing groups, those with a low-stable trajectory were more likely to be physically active and use antidiabetic medication, and to have lower blood pressure, lower hemoglobin, FPG, TG, LDL-C, HDL-C, CRP levels, and lower proportion of proteinuria (Table 1).
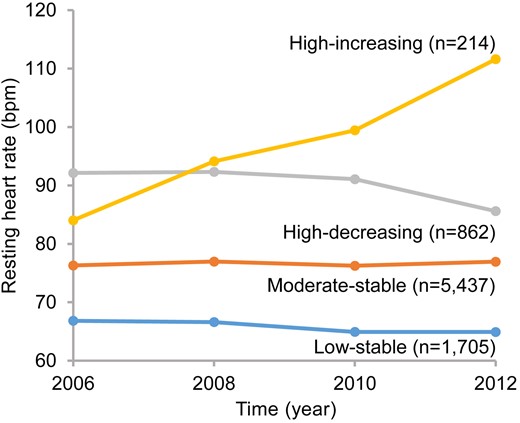
RHR trajectories of 8218 patients with diabetes mellitus during 2006 to 2012. Four trajectories of RHR from 2006 to 2012 were identified: low-stable, RHR ranged from 66.83 to 64.91 beats/min; moderate-stable, RHR ranged from 76.30 to 76.95 beats/min; high-decreasing, RHR decreased from 92.14 to 85.60 beats/min; high-increasing, RHR increased from 84.03 to 111.62 beats/min. Abbreviation: RHR, resting heart rate.
Basic characteristics of 8218 participants according to RHR trajectories
| Variables | Low-stable | Moderate-stable | High-decreasing | High-increasing | P value |
|---|---|---|---|---|---|
| No. of participants | 1705 | 5437 | 862 | 214 | |
| Age, mean ± SD, y | 55.25 ± 9.80 | 53.61 ± 9.74 | 52.83 ± 10.14 | 55.49 ± 9.89 | <.01 |
| Men, no. (%) | 1362 (79.88) | 4376 (80.49) | 703 (81.55) | 178 (83.18) | .57 |
| Ever-smokers, no. (%) | 947 (55.54) | 3197 (58.80) | 535 (62.06) | 115 (53.74) | <.01 |
| Ever-drinkers, no. (%) | 998 (58.53) | 3185 (58.58) | 514 (59.63) | 112 (52.34) | .28 |
| Physical activity < 3 times/wk, no. (%) | 882 (51.73) | 3247 (59.72) | 506 (58.70) | 131 (61.21) | <.01 |
| Use of antidiabetic medications, no. (%) | 878 (51.50) | 2564 (47.16) | 356 (41.30) | 89 (41.59) | <.01 |
| Use of β-blockers, no. (%) | 99 (5.81) | 305 (5.61) | 58 (6.73) | 22 (10.28) | .03 |
| Use of CCB, no. (%) | 269 (15.78) | 805 (14.81) | 137 (15.89) | 41 (19.16) | .26 |
| RHR in 2006, mean ± SD, beats/min | 66.83 ± 6.79 | 76.30 ± 7.94 | 92.14 ± 11.11 | 84.03 ± 15.26 | <.01 |
| RHR in 2008, mean ± SD, beats/min | 66.60 ± 6.67 | 76.97 ± 7.51 | 92.33 ± 10.71 | 94.13 ± 13.98 | <.01 |
| RHR in 2010, mean ± SD, beats/min | 64.93 ± 6.35 | 76.25 ± 7.76 | 91.08 ± 10.04 | 99.44 ± 15.38 | <.01 |
| RHR in 2012, mean ± SD, beats/min | 64.91 ± 6.45 | 76.95 ± 7.83 | 85.60 ± 8.75 | 111.62 ± 11.26 | <.01 |
| BMI, mean ± SD, kg/m2a | 25.95 ± 2.73 | 26.08 ± 3.01 | 25.90 ± 3.20 | 25.70 ± 3.05 | .07 |
| SBP, mean ± SD, mm Hga | 135.18 ± 16.02 | 138.23 ± 15.89 | 143.48 ± 16.62 | 147.22 ± 18.09 | <.01 |
| DBP, mean ± SD, mm Hga | 83.64 ± 7.92 | 86.48 ± 8.37 | 89.65 ± 8.95 | 90.50 ± 9.73 | <.01 |
| Hemoglobin, mean ± SD, g/La | 147.96 ± 11.69 | 149.74 ± 12.08 | 151.62 ± 12.82 | 152.15 ± 13.51 | <.01 |
| FPG, mean ± SD, mmol/La | 7.85 ± 1.93 | 8.61 ± 2.36 | 8.78 ± 2.59 | 9.13 ± 2.54 | <.01 |
| TG, median (IQR), mmol/La | 1.51 (1.14-2.11) | 1.67 (1.20-2.47) | 1.70 (1.27-2.65) | 1.64 (1.20-2.27) | <.01 |
| LDL-C, mean ± SD, mmol/La | 2.61 ± 0.65 | 2.67 ± 0.67 | 2.69 ± 0.63 | 2.64 ± 0.72 | .01 |
| HDL-C, mean ± SD, mmol/La | 1.44 ± 0.30 | 1.45 ± 0.31 | 1.52 ± 0.34 | 1.49 ± 0.31 | <.01 |
| eGFR, mean ± SD, mL/min/1.73 m2a | 82.44 ± 15.45 | 83.15 ± 16.11 | 84.69 ± 17.12 | 77.11 ± 16.34 | <.01 |
| CRP, median (IQR), mg/La | 1.70 (0.95-3.18) | 1.92 (1.04-3.60) | 1.76 (1.03-3.61) | 2.15 (0.97-3.96) | <.01 |
| Proteinuria, no. (%) | 348 (20.41) | 1352 (24.87) | 273 (31.67) | 78 (36.45) | <.01 |
Abbreviations: BMI, body mass index; CCB, calcium channel blocker; CRP, C-reactive protein; DBP, diastolic blood pressure; eGFR, estimated glomerular filtration rate; FPG, fasting plasma glucose; HDL-C, high-density lipoprotein cholesterol; IQR, interquartile range; LDL-C, low-density lipoprotein cholesterol; RHR, resting heart rate; SBP, systolic blood pressure; TG, triglycerides.
Average levels based on measurements during 2006-2012.
During a mean follow-up of 7.25 years, we documented 977 cases of CVD and 1162 cases of all-cause mortality. The highest incidence rates of CVD and all-cause mortality were found in the high-increasing trajectory group, followed by the high-decreasing, moderate-stable, and low-stable trajectory groups (Table 2). Figure 3 shows the Kaplan-Meier estimates for cumulative risk of CVD and all-cause mortality within the RHR trajectories. Compared with the low-stable trajectory group, the adjusted hazard ratios (HRs) for CVD were 1.02 (95% CI], .86-1.21; P = .80) for the moderate-stable trajectory group, 1.10 (95% CI, .87-1.40; P = .42) for the high-decreasing trajectory group, and 1.48 (95% CI, 1.02-2.14; P = .04) for the high-increasing trajectory group. The adjusted HRs and 95% CIs for all-cause mortality were 1.34 (95% CI, 1.14-1.58; P < .01) for the moderate-stable trajectory group, 1.68 (95% CI, 1.35-2.10; P < .01) for the high-decreasing trajectory group, and 2.47 (95% CI, 1.85-3.31; P < .01) for the high-increasing trajectory group (Table 2). Further adjustment for RHR in 2006 and for RHR in 2012 did not significantly change the results (Supplemental Table S9) (25). Sensitivity analyses with adjustment for the annual change in covariates, excluding those who had CVD, arrhythmia, thyroid abnormalities, or cancer before 2012, excluding those who used β-blockers or CCBs, or excluding outcome events that occurred within the first year of follow-up also generated consistent results (Supplementary Table S9) (25). In the subtype analyses of CVD, we found that a high-increasing trajectory was strongly associated with a higher risk of systolic heart failure. RHR trajectories during 2006 through 2012 were marginally associated with the risk of stroke but were not associated with the risk of coronary artery disease (Table 2).
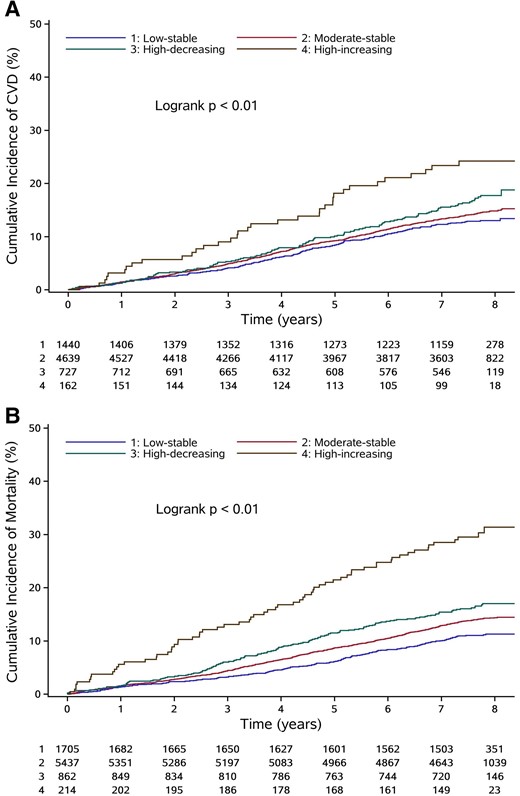
Kaplan-Meier estimates of cumulative incidence of CVD (A) and all-cause mortality (B) according to RHR trajectories. The Kaplan-Meier estimates of cumulative incidence were based on crude model. The average duration of follow-up was 7.25 years. Abbreviations: CVD, cardiovascular disease; RHR, resting heart rate.
Hazard ratios (95% CI) for CVD and all-cause mortality according to RHR trajectories
| Outcome | Low-stable | Moderate-stable | High-decreasing | High-increasing | |||
|---|---|---|---|---|---|---|---|
| HR (95% CI) | P value | HR (95% CI) | P value | HR (95% CI) | P value | ||
| CVD | |||||||
| Case/total, no. | 181/1440 | 642/4639 | 119/727 | 35/162 | |||
| Incidence rate, per 1000 person-y | 17.78 | 20.00 | 24.00 | 35.65 | |||
| Model 1 | 1 [Reference] | 1.13 (.96-1.33) | .15 | 1.36 (1.08-1.71) | .01 | 2.03 (1.41-2.92) | <.01 |
| Model 2 | 1 [Reference] | 1.19 (1.01-1.41) | .04 | 1.49 (1.18-1.88) | <.01 | 2.06 (1.44-2.96) | <.01 |
| Model 3 | 1 [Reference] | 1.02 (.86-1.21) | .80 | 1.10 (.87-1.40) | .42 | 1.48 (1.02-2.14) | .04 |
| HR (95% CI) for CADa | 1 [Reference] | .82 (.62-1.08) | .16 | .97 (.65-1.47) | .90 | 1.22 (.62-2.40) | .57 |
| HR (95% CI) for systolic heart failure a | 1 [Reference] | 1.00 (.71-1.41) | .99 | 1.02 (.62-1.69) | .94 | 2.67 (1.45-4.91) | <.01 |
| HR (95% CI) for strokea | 1 [Reference] | 1.24 (.97-1.58) | .09 | 1.39 (1.00-1.93) | .05 | 1.57 (.94-2.62) | .08 |
| All-cause mortality | |||||||
| Case/total, no. | 189/1705 | 765/5437 | 143/862 | 65/214 | |||
| Incidence rate, per 1000 person-y | 15.02 | 19.38 | 23.27 | 46.80 | |||
| Model 1 | 1 [Reference] | 1.29 (1.10-1.51) | <.01 | 1.55 (1.25-1.93) | <.01 | 3.14 (2.37-4.17) | <.01 |
| Model 2 | 1 [Reference] | 1.47 (1.26-1.73) | <.01 | 1.94 (1.56-2.41) | <.01 | 3.03 (2.29-4.02) | <.01 |
| Model 3 | 1 [Reference] | 1.34 (1.14-1.58) | <.01 | 1.68 (1.35-2.10) | <.01 | 2.47 (1.85-3.31) | <.01 |
Model 1 was a nonadjusted model. Model 2 was adjusted for age and sex. Model 3 was further adjusted for smoking status, drinking status, physical activity, antidiabetic medications use, β-blocker use, calcium channel blocker use, body mass index, systolic blood pressure, diastolic blood pressure, hemoglobin, fasting plasma glucose, triglycerides, low-density lipoprotein cholesterol, high-density lipoprotein cholesterol, estimated glomerular filtration rate, C-reactive protein, and proteinuria.
Abbreviations: CAD, coronary artery disease; CVD, cardiovascular disease; HR, hazard ratio; RHR, resting heart rate.
Adjusted for factors in model 3.
There was no significant interaction between RHR trajectories and sex, BMI, FPG, or CKD (Table 3). However, the association of RHR trajectories with CVD and all-cause mortality appeared to be stronger in participants aged <60 years (Table 3). In the secondary analyses, RHR in 2012 and average RHR were proportional to the all-cause mortality risk but failed to predict the subsequent CVD risk. A positive annual change in RHR was associated with an increased risk of CVD and all-cause mortality independent of RHR in 2006. The highest quartile of RHR variability was associated with the risk of mortality, but not with the risk of CVD (Table 4).
Stratified analyses for the association of RHR trajectories with CVD and all-cause mortality
| Outcome | Low-stable | Moderate-stable | High-decreasing | High-increasing | P-interaction | |||
|---|---|---|---|---|---|---|---|---|
| HR (95% CI) | P value | HR (95% CI) | P value | HR (95% CI) | P value | |||
| CVD | ||||||||
| Age <60 y (n = 5425) | 1 [Reference] | 1.15 (.92-1.43) | .22 | 1.25 (.93-1.67) | .13 | 1.38 (.85-2.25) | .20 | .04 |
| Age ≥60 y (n = 1543) | 1 [Reference] | .77 (.59-1.02) | .07 | .82 (.52-1.31) | .41 | 1.59 (.89-2.86) | .12 | |
| Women (n = 1353) | 1 [Reference] | 1.00 (.68-1.48) | .99 | 1.08 (.62-1.88) | .80 | .44 (.10-1.86) | .26 | .30 |
| Men (n = 5615) | 1 [Reference] | 1.03 (.85-1.24) | .77 | 1.11 (.85-1.45) | .45 | 1.73 (1.17-2.56) | <.01 | |
| BMI <24 kg/m2 (n = 1810) | 1 [Reference] | .90 (.62-1.29) | .55 | .96 (.59-1.57) | .88 | 1.93 (1.04-3.59) | .04 | .31 |
| BMI ≥24 kg/m2 (n = 5158) | 1 [Reference] | 1.05 (.87-1.27) | .61 | 1.12 (.85-1.48) | .40 | 1.20 (.75-1.94) | .45 | |
| FPG <7.0 mmol/L (n = 2107) | 1 [Reference] | 1.14 (.81-1.59) | .45 | 1.62 (1.00-2.61) | .05 | 1.60 (.62-4.11) | .33 | .60 |
| FPG ≥7.0 mmol/L (n = 4861) | 1 [Reference] | 1.03 (.84-1.25) | .80 | 1.04 (.79-1.37) | .79 | 1.50 (1.00-2.25) | .05 | |
| Non-CKD (n = 4927) | 1 [Reference] | 1.11 (.90-1.38) | .34 | 1.24 (.90-1.69) | .19 | 1.53 (.88-2.66) | .13 | .77 |
| CKD (n = 2041) | 1 [Reference] | .89 (.68-1.17) | .39 | .96 (.66-1.40) | .84 | 1.31 (.78-2.19) | .31 | |
| All-cause mortality | ||||||||
| Age <60 y (n = 6135) | 1 [Reference] | 1.63 (1.23-2.16) | <.01 | 1.77 (1.23-2.55) | <.01 | 4.12 (2.69-6.30) | <.01 | <.01 |
| Age ≥60 y (n = 2083) | 1 [Reference] | 1.13 (.92-1.38) | .25 | 1.63 (1.22-2.17) | <.01 | 1.50 (.98-2.29) | .06 | |
| Women (n = 1599) | 1 [Reference] | 1.12 (.74-1.69) | .60 | 1.26 (.71-2.24) | .43 | 1.63 (.69-3.85) | .26 | .81 |
| Men (n = 6619) | 1 [Reference] | 1.38 (1.16-1.65) | <.01 | 1.76 (1.38-2.25) | <.01 | 2.61 (1.92-3.56) | <.01 | |
| BMI <24 kg/m2 (n = 2069) | 1 [Reference] | 1.16 (.85-1.58) | .36 | 1.27 (.83-1.93) | .27 | 2.25 (1.34-3.78) | <.01 | .60 |
| BMI ≥24 kg/m2 (n = 6149) | 1 [Reference] | 1.43 (1.18-1.73) | <.01 | 1.91 (1.47-2.49) | <.01 | 2.55 (1.79-3.63) | <.01 | |
| FPG <7.0 mmol/L (n = 2439) | 1 [Reference] | 1.14 (.85-1.54) | .38 | 1.63 (1.02-2.59) | .04 | 2.63 (1.43-4.82) | <.01 | .27 |
| FPG ≥7.0 mmol/L (n = 5779) | 1 [Reference] | 1.52 (1.25-1.84) | <.01 | 1.90 (1.47-2.46) | <.01 | 2.76 (1.98-3.84) | <.01 | |
| Non-CKD (n = 5709) | 1 [Reference] | 1.38 (1.11-1.73) | <.01 | 1.42 (1.02-1.98) | .04 | 2.61 (1.69-4.02) | <.01 | .27 |
| CKD (n = 2509) | 1 [Reference] | 1.28 (1.01-1.62) | .04 | 1.89 (1.38-2.57) | <.01 | 2.46 (1.65-3.65) | <.01 | |
Models were adjusted for age (as appropriate), sex (as appropriate), smoking status, drinking status, physical activity, antidiabetic medications use, β-blocker use, calcium channel blocker use, BMI (as appropriate), systolic blood pressure, diastolic blood pressure, hemoglobin, FPG (as appropriate), triglycerides, low-density lipoprotein cholesterol, high-density lipoprotein cholesterol, estimated glomerular filtration rate (as appropriate), C-reactive protein, and proteinuria (as appropriate).
Abbreviations: BMI, body mass index; CKD, chronic kidney disease; CVD, cardiovascular disease; FPG, fasting plasma glucose; HR, hazard ratio; RHR, resting heart rate.
Hazard ratios (95% CI) for CVD and all-cause mortality according to secondary exposures of long-term RHR
| Secondary Exposures | Group 1 | Group 2 | Group 3 | Group 4 | |||
|---|---|---|---|---|---|---|---|
| HR (95% CI) | P value | HR (95% CI) | P value | HR (95% CI) | P value | ||
| RHR in 2012 | |||||||
| Range, beats/min | <70 | 70-74 | 75-79 | ≥80 | |||
| HR (95% CI) for CVD | 1 [Reference] | .93 (.77-1.13) | .48 | .99 (.81-1.22) | .95 | .98 (.82-1.16) | .77 |
| HR (95% CI) for all-cause mortality | 1 [Reference] | 1.19 (.98-1.43) | .08 | 1.23 (1.00-1.50) | .05 | 1.52 (1.29-1.80) | <.01 |
| Average RHR 2006-2012 | |||||||
| Range, beats/min | <70 | 70-74 | 75-79 | ≥80 | |||
| HR (95% CI) for CVD | 1 [Reference] | 1.12 (.92-1.36) | .26 | 1.04 (.85-1.27) | .72 | 1.04 (.86-1.26) | .66 |
| HR (95% CI) for all-cause mortality | 1 [Reference] | 1.29 (1.07-1.55) | <.01 | 1.39 (1.15-1.68) | <.01 | 1.71 (1.43-2.05) | <.01 |
| Annual change of RHR during 2006 to 2012 | |||||||
| Range, beats/min | <−1.40 | −1.40 to −.05 | −.04 to 1.24 | ≥1.25 | |||
| HR (95% CI) for CVDa | 1 [Reference] | 1.01 (.83-1.23) | .94 | 1.15 (.94-1.40) | .17 | 1.27 (1.04-1.55) | .02 |
| HR (95% CI) for all-cause mortalitya | 1 [Reference] | 1.08 (.90-1.30) | .40 | 1.21 (1.01-1.46) | .04 | 1.51 (1.26-1.80) | <.01 |
| RHR variability 2006-2012 | |||||||
| Range, beats/min | <4.57 | 4.57-7.44 | 7.45-11.33 | ≥11.34 | |||
| HR (95% CI) for CVDb | 1 [Reference] | .86 (.71-1.03) | .10 | .92 (.77-1.11) | .38 | 1.08 (.90-1.29) | .40 |
| HR (95% CI) for all-cause mortalityb | 1 [Reference] | 1.04 (.87-1.24) | .67 | 1.04 (.88-1.24) | .64 | 1.20 (1.01-1.42) | .04 |
Models were adjusted for age, sex, smoking status, drinking status, physical activity, antidiabetic medications use, β-blocker use, calcium channel blocker use, body mass index, systolic blood pressure, diastolic blood pressure, hemoglobin, fasting plasma glucose, triglycerides, low-density lipoprotein cholesterol, high-density lipoprotein cholesterol, estimated glomerular filtration rate, C-reactive protein, and proteinuria.
Abbreviations: CVD, cardiovascular disease; HR, hazard ratio; RHR, resting heart rate.
Further adjusted for RHR in 2006.
Further adjusted for average RHR from 2006 to 2012.
Discussion
RHR has been demonstrated to be associated with adverse health outcomes in patients with diabetes mellitus. The findings of our study add to the understanding of this association by examining the long-term patterns of RHR and subsequent risks of CVD and all-cause mortality. We included 8218 participants with diabetes mellitus and identified 4 heterogeneous RHR trajectories during the 2006 through 2012 period. The risk of all-cause mortality was higher in the moderate-stable and high-decreasing trajectory groups than in the low-stable trajectory group, and the risks of both CVD and all-cause mortality were higher in the high-increasing trajectory group than in the other 3 trajectory groups. Moreover, we observed that RHR in 2012, average RHR, annual change in RHR, and RHR variability were associated with the risk of all-cause mortality but only annual change in RHR was associated with the risk of CVD.
Previous studies have revealed associations of RHR with CVD, diabetic target organ damage, and all-cause mortality in patients with diabetes mellitus (3-8, 26). Of note, most of these studies were based on a single measurement of RHR. Another cohort study that analyzed annual RHR measurements over 22 years in patients with type 1 diabetes mellitus found that a 10-beat/min increase in RHR was associated with a 9% higher risk of CVD (27). However, this previous study only examined the time-dependent effect of RHR, which could not characterize the additional impact of a changing RHR pattern. Considering that lifelong management is essential in patients with diabetes mellitus, examining long-term changes in RHR could be more informative and clinically relevant in this population. A changing RHR pattern has been demonstrated to be associated with adverse health outcomes in the general population (9-12). A prospective cohort study in general population of Norway found that an elevated RHR trajectory was associated with higher risks of myocardial infarction and all-cause mortality (9), whereas we found that a high-increasing trajectory had the highest risks of CVD and mortality among the four trajectories. Another cohort study from Norway found a U-shaped association between a change in RHR and ischemic heart disease mortality (12), whereas Floyd et al did not observe a significant association of change in RHR with myocardial infarction or mortality in individuals without CVD (28). However, in our study, which included participants with diabetes mellitus, the risks of CVD and mortality were proportional to the annual change in RHR, and an upward trend in RHR indicated a worse prognosis. Taken together, the findings of our present study provide novel information regarding the association of longitudinal RHR patterns with health conditions in patients with diabetes mellitus and underscore the importance of maintaining a low RHR in patients with diabetes mellitus.
Several potential mechanisms may explain the association of RHR trajectories with CVD and mortality in diabetes mellitus. An elevated RHR increases myocardial oxygen consumption, encourages greater oxidative stress, promotes longitudinal myocardial dysfunction, causes endothelial dysfunction, and accelerates the progression of arterial stiffness, thereby contributing to the incidence of CVD and death (10, 29-31). Meanwhile, an elevated RHR increases the exposure of the glomerulus to mechanical stimuli, thereby causing a decline in renal function, which may mediate the association between the RHR trajectory and health outcomes (7, 26, 32). Moreover, an increased RHR is associated with enhanced systemic inflammation and could further amplify the adverse impact of inflammation (31, 33). We consistently found a higher concentration of CRP in the high-increasing trajectory group, although further adjustment for CRP did not materially change the result. Finally, elevated RHR might be a marker of cardiac autonomic dysfunction, which is common in patients with diabetes mellitus. Cardiac autonomic dysfunction is associated with at least a 3-fold higher risk of mortality in patients with diabetes mellitus (34). The potential mechanisms are unclear but may include cardiac autonomic dysfunction-related QT prolongation, renal dysfunction, and asymptomatic myocardial ischemia.
The findings of this study have important clinical implications. We found that participants with a consistently low RHR had the lowest risk of CVD and all-cause mortality. We also observed that an increase in RHR over time was associated with a higher risk of these outcomes. Our findings suggest that maintaining a low RHR could be of great value in primary prevention of CVD and avoiding mortality in patients with diabetes mellitus. Our findings also lend support to efforts that encourage lifestyle changes that potentially lower RHR, for example, regular exercise, weight loss, and smoking and alcohol cessation. Furthermore, our study highlights the importance of long-term monitoring of RHR in patients with diabetes mellitus. Early identification of patients with a high-risk RHR trajectory contributes to early warning of adverse health outcomes, which can then be targeted with interventions to improve the prognosis. With the popularization of mobile health technology, long-term monitoring of RHR is now low-cost and readily accessible. These features make long-term RHR monitoring one of the simplest risk assessment methods and easier for patients to accept.
A strength of this study is that it was conducted in a well-characterized, community-based cohort and includes high-quality data. Furthermore, we identified the RHR trajectories using at least 3 measurements over 6 years and examined their association with a wide spectrum of diabetes mellitus outcomes. This enabled us to provide a more precise and profound insight into the role of RHR in patients with diabetes mellitus. This study also has several limitations. First, different types of diabetes mellitus could not be distinguished; however, more than 90% of participants would have had type 2 diabetes mellitus according to the diabetes mellitus survey of China. Second, all our study participants were from the Kailuan community; therefore, our findings may not be completely generalizable to patients with diabetes mellitus in other geographic regions. Third, we only used a single measurement of FPG for diagnosing diabetes mellitus. Additionally, data on glycated hemoglobin, oral glucose tolerance test, and random plasma glucose were not available. These may have introduced bias into the diagnosis of diabetes mellitus. The glycemic control could not be assessed because of the lack of data on glycated hemoglobin. However, the stratified analysis by FPG may partly demonstrate that the association between RHR trajectories and outcomes was not modified by the status of glycemic control. Fourth, the diagnosis of heart failure only included systolic heart failure. Thus, the association between RHR trajectories and heart failure with preserved ejection fraction still needs further investigation. Fifth, we assessed the urine albumin using the dipstick method instead of a quantitative assessment (eg, urine albumin-to-creatinine ratio) because of the limited facilities. Finally, this study was based on an observational design and could not determine causality. Further trials are warranted to confirm the beneficial effect of RHR-lowering therapy in patients with diabetes mellitus and to identify the optimal RHR level.
In conclusion, we identified 4 discrete RHR trajectories in individuals with diabetes mellitus over a 6-year period. Higher and increasing RHR trajectories are associated with increased risks of subsequent CVD and all-cause mortality. These findings highlight the importance of maintaining low RHR in patients with diabetes mellitus. Stringent RHR management may further reduce the health burden in patients with diabetes mellitus.
Acknowledgments
We sincerely thank all the survey teams of the Kailuan Study Group for their contribution and the study participants who contributed their information.
Funding
The study was supported by the grants from the National Natural Science Foundation of China (No. 81570383 and No. 82070433).
Author Contributions
C.W., Q.X., S.W., and H.X. contributed to the conceptualization and study design. M.Z., S.L., and S.C. contributed to the data curation. C.W. performed the statistical analysis and wrote the first draft of the manuscript. Q.X., S.Y., Y.L., Z.F., L.T., M.W., and M.Z. contributed to the review and editing of the manuscript. All authors reviewed and approved the final version of the manuscript.
Disclosures
The authors have nothing to disclose.
Data Availability
The datasets generated during the current study are not publicly available because of privacy and ethical restrictions but are available from the corresponding author on reasonable request.
References
Abbreviations
- BMI
body mass index
- CCB
calcium channel blocker
- CKD
chronic kidney disease
- CRP
C-reactive protein
- CVD
cardiovascular disease
- eGFR
estimated glomerular filtration rate
- FPG
fasting plasma glucose
- HDL-C
high-density lipoprotein cholesterol
- HR
hazard ratio
- LDL-C
low-density lipoprotein cholesterol
- RHR
resting heart rate
- TG
triglyceride
