


Abstract
The American Diabetes Association (ADA) recommends a 3-day preparatory diet prior to a diagnostic oral glucose tolerance test (OGTT), a test often recommended in postpartum individuals with a history of gestational diabetes (GDM).
Evaluate the relationship between carbohydrate intake and OGTT glucose in 2 cohorts of postpartum individuals.
We performed analyses of postpartum individuals from 2 prospective studies with recent GDM (Balance after Baby Intervention, BABI, n = 177) or risk factors for GDM (Study of Pregnancy Regulation of INsulin and Glucose, SPRING, n = 104) .We measured carbohydrate intake using 24-hour dietary recalls (SPRING) or Food Frequency Questionnaire (BABI) and performed 2-hour 75-g OGTTs. The main outcome measure was 120-minute post-OGTT glucose.
There was no relationship between carbohydrate intake and 120-minute post-OGTT glucose level in either study population (SPRING: β = 0.03, [−5.5, 5.5] mg/dL, P = .99; BABI: β = −3.1, [−9.5, 3.4] mg/dL, P = .35). Adding breastfeeding status to the model did not change results (SPRING β = −0.14, [−5.7, 5.5] mg/dL, P = .95; BABI β = −3.9, [−10.4, 2.7] mg/dL, P = .25). There was, however, an inverse relationship between glycemic index and 120-minute post OGTT glucose (BABI: β = −1.1, [−2.2, −0.03] mg/dL, P = .04).
Carbohydrate intake is not associated with post-OGTT glucose levels among postpartum individuals. Dietary preparation prior to the OGTT may not be necessary in this population.
It is recommended that individuals with recent gestational diabetes (GDM) undergo an oral glucose tolerance test (OGTT) at 4 to 12 weeks' postpartum to determine whether diabetes or prediabetes is present outside of the pregnant state (1). The assessment of hyperglycemia is dependent upon this test in the postpartum state because changes to glycemic physiology and red blood cell kinetics in pregnancy limit the validity of hemoglobin A1c (2). The American Diabetes Association (ADA) 2023 guidelines recommend that a preparatory diet contain at least 150 grams of carbohydrate for 3 days prior to any diagnostic OGTT (1). Other societies do not currently include such recommendations in their guidelines (3, 4).
The idea of a preparatory OGTT diet can be in part attributed to a historical study where it was observed that a carbohydrate-restricted diet was associated with impaired glucose tolerance as measured by an OGTT (5). These data were the basis of the recommendation from the Fourth International Workshop-Conference on GDM for a 3-day preparatory diet prior to an OGTT in pregnancy to contain at least 150 grams of carbohydrate daily (6). Other studies evaluating the relationship between dietary carbohydrate content and OGTT glucose among nonpregnant adults have shown varying results (7–15). These studies have varied in the carbohydrate content of the diet, the amount of time for which diets have been implemented (hours, days, weeks), and the glucose load used during the OGTT. We have previously shown that among pregnant women, lower dietary carbohydrate intake in the 24 hours prior to an OGTT is associated with higher post-OGTT blood glucose levels (16). No studies, to our knowledge, have evaluated the impact of carbohydrate intake on an OGTT in postpartum women, a population that is one of the few in which this test is routinely recommended.
We tested for a relationship between carbohydrate intake and post-OGTT glucose results among postpartum women.
Materials and Methods
Data for this project were derived from two studies, the Study of Pregnancy Regulation of Insulin and Glucose (SPRING) (16–18), a longitudinal prospective study designed to examine insulin physiology and glucose metabolism in pregnant women at high risk for GDM, and the Balance after Baby Intervention (BABI) (19, 20), a randomized interventional trial evaluating the impact of a web-based lifestyle intervention on weight loss in women with a recent history of GDM.
SPRING Participants
We recruited pregnant individuals, 18-44 years old, from the obstetric practice at Massachusetts General Hospital (MGH) and in the Boston area between 2016 and 2020. We separately recruited a group of nonpregnant, nonpostpartum individuals. Participants completed a survey reporting their past medical history, past pregnancy history, and family history and had their height and weight measured. Participants enrolled in the study had risk factors for GDM (eg, overweight body mass index [BMI] plus the presence of 1 additional risk factor as described by the ADA or, regardless of BMI, GDM in a previous pregnancy or family history of diabetes) (21). Those with a history of bariatric surgery, pre-existing diabetes mellitus, with a HbA1c ≥ 6.5% at the first trimester study visit or taking medications that affect glucose were excluded. The Partners Committee on Human Research (institutional review board) approved the study, and all participants gave written informed consent.
BABI Participants
Pregnant and postpartum individuals at Brigham and Women's Hospital in Boston, MA, and at the University of Colorado in Denver, CO, were recruited into the study from 2016 to 2018. Participants included in the study had GDM in their most recent pregnancy, identified after a 100-g OGTT (Carpenter Coustan Criteria), a 50-g glucose loading test of ≥200 mg/dL, or by clinical diagnosis as documented in the medical record. Additional inclusion criteria included a prepregnancy BMI ≥18 and ≤50 mg/m2, a 6-week postpartum BMI ≥24 mg/m2 (≥22 mg/m2 in self-identified Asian women), no history of bariatric surgery or other medical conditions known to affect glucose tolerance, and no use of medications known to affect glucose tolerance at the time of the baseline study visit (∼6 weeks' postpartum). Participants were randomized after the completion of the baseline study visit included in the present analysis.
SPRING Study Procedures
SPRING participants underwent a standardized 2-hour 75-g OGTT at 7-14 weeks of gestation (visit 1), 24-32 weeks of gestation (visit 2), and 6-24 weeks' postpartum (visit 3). Data from the visit at 6-24 weeks' postpartum (visit 3) were used for the primary analysis in the current study. The target date for the postpartum visit was 6-12 weeks' postpartum, but the window was expanded to improve retention in the setting of the COVID-19 pandemic.
We performed 24-hour dietary recalls at the time of the OGTT using the Automated Self-Administered 24-Hour Dietary Assessment Tool (ASA24), a validated self-administered web-based dietary recall tool from the National Cancer Institute (22–25). The ASA24 provides an analysis of 65 nutrients and 37 food groups. The system is based upon the United States Department of Agriculture's Automated Multiple-Pass Method; the food code assignments are linked to the United States Department of Agriculture Food and Nutrient Database for Dietary Studies (26). The ASA24 has been validated in healthy individuals across the body weight/BMI spectrum (22–25). Participants recalled their food intake from the previous day during the OGTT. Participants were asked to fast (other than water) for at least 8 hours prior to the OGTT but were not given other dietary or physical activity instructions. Blood samples were drawn fasting, 30, 60, and 120 minutes following consumption of the 75-g oral glucose load during the OGTT. Participants included in our analysis underwent an OGTT at the postpartum visit (visit 3) and completed the ASA24.
BABI Study Procedures
BABI participants underwent a standardized 2-hour 75-g OGTT at 6-9 weeks postpartum. Participants arrived fasting (nothing except water for 10 hours prior to the study visit). Blood samples were drawn fasting and at 120 minutes following consumption of the 75-g oral glucose load during the OGTT. Height, weight, and waist circumference were measured twice by research coordinators.
We performed dietary intake using the 2005 Block Food Frequency Questionnaire (FFQ), a validated instrument to assess food intake over a finite period. BABI participants were instructed to report their diet from the past 6 weeks. The original Block FFQ was developed at the National Cancer Institute and has since been updated. The FFQ provides a list of dietary items with a frequency response section to determine how often the item is eaten. The Block FFQ has been validated in both male and female populations (27, 28).
We excluded individuals with incomplete dietary recalls and outlier data (those with very high or very low dietary reports, <500 kcal/day and >5000 kcal/day).
SPRING and BABI Laboratory Analyses
Blood samples for glucose were collected in sodium fluoride tubes. Glucose was measured using the hexokinase method (Cobas analyzer: SPRING and BABI at Brigham and Women's Hospital; Beckman Coulter: BABI in Colorado).
Statistical Analyses
To describe baseline characteristics in participants in each study, participants were grouped by median carbohydrate intake into a “low-carbohydrate intake” and a “high-carbohydrate intake” group. We compared continuous variables between the low- and high-carbohydrate intake groups using a Wilcoxon rank-sum test and categorical variables using a chi-squared test. We used linear regression models to assess the relationship between the primary exposure variable, total daily carbohydrate intake in grams (as measured by the ASA24 or the FFQ), and the prespecified primary outcome variable, 120-minute post-OGTT blood glucose. For the SPRING dataset, secondary outcomes included 30-minute post-OGTT blood glucose, 60-minute post-OGTT blood glucose, and glucose area under the curve. We also included the diagnosis of either prediabetes or diabetes as a secondary outcome in both datasets. We assessed the relationship between total carbohydrate intake in grams and both primary and secondary outcomes using linear regression (or logistic regression for the prediabetes/diabetes outcome).
For each analysis, we created 3 regression models with different sets of covariates: (1) no adjustment, (2) adjustment for total caloric intake over 24 hours (kcal/24 hours), and (3) adjustment for age, BMI (measured at the study visit), days postpartum, race/ethnicity, education (completion of college), and total caloric intake over 24 hours (kcal/24 hours). In additional models, we also adjusted for breastfeeding status at the time of the OGTT. In relevant models, the exposure variable, total carbohydrate intake (in grams) (over the 24 hours preceding the OGTT for SPRING, and an average of daily carbohydrate intake over the 6 weeks preceding the OGTT for BABI) were divided by 50 to assist with model interpretation.
We then conducted a series of exploratory and post hoc analyses. In BABI, we explored the relationship between glycemic index and glycemic load with post-OGTT blood glucose. We ran an identical analysis to the primary analysis in the nonpregnant SPRING participants evaluating the relationship between carbohydrate intake measured by the ASA24 and post-OGTT blood glucose levels. We also tested the association of carbohydrate intake in the 24 hours leading up to the OGTT and 2 hour post-OGTT blood glucose level among pregnant women in SPRING at a median of 26 weeks’ gestation (visit 2), evaluating a slightly larger population from our previous work (16).
Statistical analyses were conducted in STATA/IC version 16 (College Station, TX).
Results
Participant Characteristics
Table 1 displays participant characteristics in both study populations. All participants were cis-gendered women. Because of study inclusion criteria, 100% of BABI participants had GDM in their recent pregnancy, whereas only 32% of participants in SPRING had recent GDM. In both cohorts, most participants completed college. BABI had a larger Hispanic population than SPRING. BABI participants were more likely to have a family history of diabetes than SPRING participants. Eighty-five percent of individuals (SPRING) and 73% of individuals (BABI) were breastfeeding at the time of the study visit. SPRING and BABI data were also grouped by carbohydrate intake (above or below the median). In both study populations, women in the high-carbohydrate group had significantly higher total caloric intake than women in the low carbohydrate group. In BABI, significantly more women in the low-carbohydrate group were primiparous (P = .02). Individuals with a higher carbohydrate diet had a diet that was significantly higher in glycemic index (P = .005) and glycemic load (P < .001) in BABI.
Baseline characteristics for SPRING and BABI participants
| Variable | SPRING participants (n = 104) Median (IQR), n (%) | BABI participants (n = 177) Median (IQR), n (%) |
|---|---|---|
| Age | 34 (32, 37) | 33 (30, 36) |
| Family history of diabetes | 40 (38) | 121 (68) |
| Race/Ethnicity | ||
| Hispanic | 16 (15) | 59 (33) |
| Non-Hispanic Asian | 10 (10) | 32 (18) |
| Non-Hispanic Black | 12 (11) | 21 (12) |
| Non-Hispanic White | 63 (61) | 57 (32) |
| Non-Hispanic and none of the above | 3 (3) | 6 (3) |
| Education | ||
| Completed college | 93 (89) | 98 (55) |
| Days postpartum | 63 (52, 92) | 54 (46, 64) |
| Prepregnancy BMI (kg/m2) | 27.4 (23.4, 30.9) | 28.4 (25.5, 32.9) |
| BMI at study visit | 29.4 (25.8, 32.7) | 30.1 (26.5, 34.5) |
| Primiparous | 34 (33) | 74 (42) |
| GDM this pregnancy | 33 (32) | 177 (100) |
| Diagnosis of prediabetes or overt diabetes postpartum | 11 (11) | 50 (28) |
| Total kcala | 1887.4 (1455.9, 2479.8) | 1897 (1406, 2394) |
| Total carba | 226.0 (166.7, 288.3) | 200 (141, 253) |
Abbreviations: ASA24, Automated Self-Administered 24-hour Dietary Assessment Tool; BABI, Balance After Baby Intervention; BMI, body mass index; GDM, gestational diabetes; IQR, interquartile range; SPRING, Study of Pregnancy Regulation of INsulin and Glucose.
In SPRING, 24-hour dietary information was collected using the ASA24. In BABI, habitual dietary intake over the previous 6 weeks was gathered using the Food Frequency Questionnaire.
Primary Outcome
While there was a trend toward lower 120-minute post OGTT glucose in both SPRING and BABI in unadjusted analyses, there was no significant relationship between carbohydrate intake and the 120-minute post-OGTT blood glucose level in adjusted models (Table 2). In both cohorts, we added breastfeeding status to the model, and this had no impact on our results (SPRING β = −0.14, [−5.7, 5.5] mg/dL, P = .96; BABI β = −3.9, [−10.4, 2.7] mg/dL, P = .25).
Association between carbohydrate intake and 120-minute post-OGTT glucose
| SPRING 120-minute post OGTT glucose (n = 104) | BABI 120-minute post OGTT glucose (n = 177) | |||
|---|---|---|---|---|
| Model | Coefficient (mg/dL), 95% CI | P value | Coefficient (mg/dL), 95% CI | P value |
| Unadjusted | −2.3 (−5.1, 0.58) | .12 | −2.4 (−4.8, 0.04) | .05 |
| Caloric intake | 0.52 (−4.7, 5.7) | .84 | −3.1 (−9.2, 3.0) | .32 |
| Adjusted | 0.03 (−5.5, 5.5) | .99 | −3.1 (−9.5, 3.4) | .35 |
In linear regression models described here, the primary exposure was total reported carbohydrate intake in the 24 hours (ASA24, SPRING) and 6 weeks (FFQ, BABI) preceding the OGTT (grams). The coefficient for outcome, 120-minute postload glucose, is given per 50-g increase in carbohydrate intake.
Unadjusted model: no adjustments. Caloric intake model: adjustment for total caloric intake (kcal/24 hours). Adjusted model: adjustment for age, BMI, time postpartum, race/ethnicity, education, total caloric intake (kcal/24 hours).
Abbreviations: ASA24, Automated Self-Administered 24-Hour Dietary Assessment Tool; BABI, Balance after Baby Intervention; FFQ, Food Frequency Questionnaire; OGTT, oral glucose tolerance test; SPRING, Study of Pregnancy Regulation of INsulin and Glucose.
Secondary Outcomes
In SPRING, lower carbohydrate intake was not associated with 30-minute post-OGTT blood glucose (adjusted β=−3.73 mg/dL, P = .14), 60-minute post-OGTT blood glucose (adjusted β=0.32 mg/dL, P = .93), or glucose area under the curve (adjusted β=−15, P = .96). Figure 1 displays the predicted glucose levels across the OGTT for the fully adjusted models in women with carbohydrate intake at the 25th percentile and at the 75th percentile in SPRING.
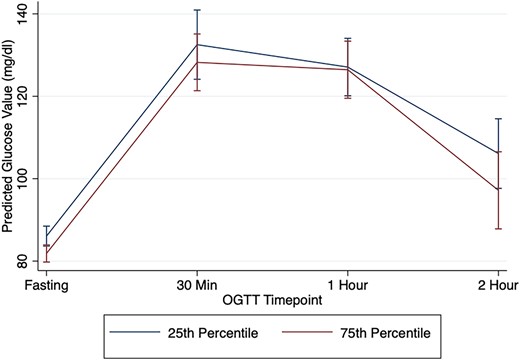
Predicted OGTT glucose values in SPRING by carbohydrate intake. This figure displays the predicted glucose values at each OGTT timepoint (fasting, 30, 60, 120 minutes) adjusting for age, BMI, time postpartum, race/ethnicity, education, and total caloric intake (kcal/24 hours) for women enrolled in SPRING at the 25th percentile for carbohydrate intake and at the 75th percentile for carbohydrate intake.
There was no relationship between carbohydrate intake and the diagnosis of prediabetes or diabetes in either cohort (SPRING: adjusted OR 1.53 mg/dL, P = .38, BABI: adjusted OR 1.15, P = .61).
Additional Analyses
Glycemic index and glycemic load were both associated with post-OGTT glucose levels in BABI (unadjusted β=−1.4 mg/dL, P = .02; unadjusted β=−0.11 mg/dL, P = .02). In our adjusted model, the relationship between glycemic index and post-OGTT glucose levels remained significant (adjusted β=−1.1 mg/dL, P = .04) (Table 3).
Association between glycemic index and glycemic load and 120-minute post OGTT glucose in the BABI cohort
| Glycemic index | Glycemic load | |||
|---|---|---|---|---|
| 120-minute post OGTT glucose (n = 177) | 120-minute post OGTT glucose (n = 177) | |||
| Model | β (mg/dL) 95% CI | P value | β (mg/dL) 95% CI | P value |
| Unadjusted | −1.4 (−2.5, −0.32) | .01 | −0.11 (−0.21, −0.019) | .02 |
| Caloric intake | −1.3 (−2.4, −0.24) | .02 | −0.19 (−0.39, 0.015) | .07 |
| Adjusted | −1.1 (−2.2, −0.03) | .04 | −0.17 (−0.39, 0.03) | .096 |
In linear regression models described here, the exposures were glycemic index and glycemic load reported over the previous 6 weeks (FFQ, BABI).
Unadjusted model: no adjustments. Caloric intake model: adjustment for total caloric intake (kcal/24 hours). Adjusted model: adjustment for age, body mass index, time postpartum, race/ethnicity, education, total caloric intake (kcal/24 hours).
Abbreviations: BABI, Balance after Baby Intervention; FFQ, Food Frequency Questionnaire; OGTT, oral glucose tolerance test.
Among pregnant participants in SPRING (n = 122) at a median of 26 weeks’ gestation, there was a significant inverse relationship between carbohydrate intake and 120-minute post-OGTT blood glucose level (adjusted β=−5.2 mg/dL, P < .05).
In a population of nonpregnant adults in SPRING (n = 58), there was no relationship between carbohydrate intake and post-OGTT blood glucose levels or area under the curve (120-minute post-OGTT glucose, adjusted β=2.3 mg/dL, P = .62).
Discussion
In two study populations of postpartum individuals, we found no relationship between dietary carbohydrate intake (either habitual or in the 24 hours leading up to the OGTT) and post-OGTT glucose levels. This finding was not altered when we adjusted for breastfeeding status. In a group of nonpregnant, nonpostpartum adult females, there was also no relationship between carbohydrate intake on the day before the OGTT and post-OGTT glucose levels, standing in contrast to our previous findings in pregnant individuals (16). While carbohydrate amount was not associated with OGTT results in postpartum individuals, glycemic index had an inverse relationship with 120-minute post OGTT glucose in the cohort in which it was measured. We are unaware of other studies that have assessed the relationship between carbohydrate intake and OGTT glucose levels specifically among postpartum women, in whom OGTTs are often recommended to assess glycemic status due to lack of reliability of hemoglobin A1c in this time period (2).
In contrast to our findings, other limited studies seem to suggest a relationship between carbohydrate intake and OGTT glucose in nonpregnant individuals. In a recently published case report that is cited in the 2023 ADA guidelines, a single participant was diagnosed with diabetes based on an OGTT after eating a low-carbohydrate dinner, but was found to have normal glucose tolerance after engaging in a preparatory diet and having a dinner with at least 50 g of carbohydrate (7). Other older studies are similarly limited by small sample size. In two small interventional trials (n = 9 to 18), Numao et al (9) and Wilkerson et al (12) found that postload glucose levels were higher after a very low carbohydrate diet for 3 to 5 days when compared with a high-carbohydrate diet. Similarly, Kaneko et al (10) and Wang et al (11) found that postload glucose levels were higher after a very low–carbohydrate meal the evening prior to a diagnostic OGTT compared with a high carbohydrate meal. In a study evaluating the impact of long-term diet (>6 months) on glucose tolerance, healthy male athletes on a low carbohydrate diet (mean 50 g/day carbohydrate) had higher post-OGTT glucose levels than healthy male athletes on a mixed diet (mean 394 g/day carbohydrate) (8). Our findings among our nonpregnant and postpartum cohorts are not in line with these prior studies, but we note that we evaluated the relationship between carbohydrate intake in real life and OGTT glucose as opposed to prescribed diets, which are extreme in content and may prove a biologic effect; these diets may not be applicable to most individuals undergoing an OGTT. In addition, there are several other studies that, consistent with our own, have not demonstrated a clear link between carbohydrate intake and OGTT glucose levels in nonpregnant adults (13–15).
In contrast to our findings in the postpartum state, in the same pregnant participants in SPRING, we found an inverse relationship between carbohydrate intake 24 hours before a diagnostic OGTT and post-OGTT glucose (16). Our pregnancy findings are consistent with other studies that have demonstrated a relationship between carbohydrate intake and OGTT results in pregnant women (29–32). The lack of a relationship between carbohydrate intake and OGTT glucose levels among our postpartum populations and our nonpregnant, nonpostpartum population reported here suggest that there may be something unique about the physiology of pregnancy that contributes to the phenomenon we observed. It is possible that because of the rise in insulin resistance seen during gestation, any reduction in insulin secretion that may be seen after a low-carbohydrate diet, will have a greater impact on glycemia, leading to higher post-OGTT glucose levels after a low-carbohydrate diet.
While our data did not show a relationship between carbohydrate intake and OGTT glucose levels in the postpartum period, there was a relationship between glycemic index and post-OGTT glucose levels. Having a diet with lower glycemic index was associated with higher 120-minute post-OGTT glucose. It is plausible that a diet enriched with low glycemic index foods may lead to higher postprandial glucose levels following a glucose load because some studies have demonstrated reduced insulin secretion along with higher glucose levels following a carbohydrate-restricted diet (8–11, 33). One may posit that just as a low-carbohydrate diet leads to lower secretory insulin response, a diet with a low glycemic index may act similarly. It is important to note that although glucose is thought of as the primary macronutrient driving glycemia, studies in healthy individuals and in individuals with type 1 and type 2 diabetes have demonstrated that protein and fat also impact glucose and insulin physiology (34–37). It is also known that when individuals increase or decrease their carbohydrate intake, fat intake is altered in an inverse manner (38). Therefore, it is possible that some of the physiology responsible for our findings may be related to other macronutrients or dietary components.
Our study has several strengths. While the use of the OGTT has fallen out of favor in general clinical practice, guidelines recommend its use specifically in postpartum individuals with recent GDM. Therefore, we evaluated our research question in two clinically relevant populations: women with a history of GDM and women with risk factors for GDM. We also had the benefit of looking at dietary intake assessed by both the ASA24 and the FFQ, which allowed us to determine associations with dietary carbohydrate over a short (24-hour) and longer (6-week) time period. Some data have suggested that longer periods of carbohydrate preparation may be needed prior to an OGTT, as more habitual carbohydrate intake may impact OGTT results (39). We had access to two different postpartum populations, allowing for confirmation of findings in two independent cohorts. We accounted for appropriate covariates such as total caloric intake as well as BMI, age, and education.
Limitations do exist. We were only able to assess glycemic index and glycemic load in the BABI group as this information was not collected in SPRING. It is possible that we are missing some key information by looking at carbohydrate as a whole as opposed to carbohydrate quality. Because the ASA24 and the FFQ are self-reported questionnaires, carbohydrate intake could have been over- or under-reported. Our dietary data was limited to 24 hours prior to the OGTT and 6 weeks before the OGTT, while an OGTT preparatory diet has been recommended for 3 days. We likely did not have adequate statistical power to test the hypothesis of carbohydrate intake and its relationship with the diagnosis of prediabetes or diabetes. We also did not have statistical power to determine if our findings differ in certain subgroups including those delineated by age, BMI, socioeconomic status, race/ethnicity, or other factors.
In conclusion, the 2023 ADA guidelines recommend a preparatory diet of at least 150 g before a diagnostic OGTT in all individuals (1). Our prior data suggest that among pregnant women, carbohydrate intake prior to an OGTT has a relationship with OGTT glycemia (16), while the current study indicates that among postpartum women, recent carbohydrate intake does not have a relationship with OGTT glycemia. Low glycemic index diets may raise OGTT glucose levels in postpartum women. These data underscore the importance of developing new diagnostic methods for diabetes in pregnancy that are not susceptible to variability based on recent dietary intake. Nevertheless, our primary analysis implies that a preparatory diet focused on carbohydrate content may not be necessary in the postpartum setting.
Funding
E.A.R. was supported by F32K126343. C.E.P. and the SPRING cohort are supported by NIH K23DK113218, the Robert Wood Johnson Foundation's Harold Amos Medical Faculty Development Program, and the Massachusetts General Hospital Claflin Award. Grant numbers 1UL1TR001102-01 and 8 UL1 TR000170-05, Harvard Clinical and Translational Science Center, from the National Center for Advancing Translational Science provided support for data collection. The BABI study was funded by the Centers of Disease Control and Prevention (grant #: HHSD2002013M53968B).
Disclosures
C.E.P. has received fees and royalties from Mediflix and UpToDate (Wolters Kluwer), respectively, for presentations and articles related to diabetes over which she had full control of content.
Data Availability
Some or all datasets generated during and/or analyzed during the current study are not publicly available but are available from the corresponding author on reasonable request.
Clinical Trial Information
ClinicalTrials.gov identifier: NCT02763267 (registered May 5, 2016), NCT02744300 (registered April 20, 2016).
References
Abbreviations
- ADA
American Diabetes Association
- ASA24
Automated Self-Administered 24-Hour Dietary Assessment Tool
- BABI
Balance after Baby Intervention
- BMI
body mass index
- FFQ
Food Frequency Questionnaire
- GDM
gestational diabetes
- OGTT
oral glucose tolerance test
- SPRING
Study of Pregnancy Regulation of INsulin and Glucose
