


Abstract
The aims of the study are to compare characteristics of subacute thyroiditis (SAT) related to different etiologies, and to identify predictors of recurrence of SAT and incident hypothyroidism.
This nationwide, multicenter, retrospective cohort study included 53 endocrinology centers in Turkey. The study participants were divided into either COVID-19–related SAT (Cov-SAT), SARS-CoV-2 vaccine–related SAT (Vac-SAT), or control SAT (Cont-SAT) groups.
Of the 811 patients, 258 (31.8%) were included in the Vac-SAT group, 98 (12.1%) in the Cov-SAT group, and 455 (56.1%) in the Cont-SAT group. No difference was found between the groups with regard to laboratory and imaging findings. SAT etiology was not an independent predictor of recurrence or hypothyroidism. In the entire cohort, steroid therapy requirement and younger age were statistically significant predictors for SAT recurrence. C-reactive protein measured during SAT onset, female sex, absence of antithyroid peroxidase (TPO) positivity, and absence of steroid therapy were statistically significant predictors of incident (early) hypothyroidism, irrespective of SAT etiology. On the other hand, probable predictors of established hypothyroidism differed from that of incident hypothyroidism.
Since there is no difference in terms of follow-up parameters and outcomes, COVID-19– and SARS-CoV-2 vaccine–related SAT can be treated and followed up like classic SATs. Recurrence was determined by younger age and steroid therapy requirement. Steroid therapy independently predicts incident hypothyroidism that may sometimes be transient in overall SAT and is also associated with a lower risk of established hypothyroidism.
Subacute thyroiditis (SAT) is inflammation of the thyroid gland caused by follicle damage that presents with neck pain and tenderness of the thyroid gland (1). People with certain human leukocyte antigen (HLA) types, particularly the HLA-B 35 allele, have a genetic predisposition. SAT is thought to occur as a result of autoimmunity and inflammatory mechanisms that are triggered after viral infections (2). Many viruses, such as ECHO viruses, coxsackie viruses, adenoviruses, and influenza viruses, are associated with SAT (3). Today, SARS-CoV-2 infection is thought of as the most common viral infection worldwide because of the COVID-19 pandemic. Several cases of COVID-19–related SAT have been reported previously (3-14). The transmembrane protease TMPRSS2 and angiotensin-converting enzyme 2 (ACE2), which SARS-CoV-2 uses to enter the cell, are expressed in the thyroid tissue (3, 15). Therefore, the thyroid gland has been one of the target organs that may be affected by SARS-CoV-2 infection (16). In addition, SAT can be observed after vaccination, especially after vaccination against swine flu, influenza virus, human papillomavirus, and hepatitis B (17). An increasing number of SARS-CoV-2 vaccine–related SAT cases have been reported in the literature during the pandemic (17-33). The pathogenesis of SARS-CoV-2 vaccine–related SAT has not been thoroughly explored because of various SARS-CoV-2 vaccine characteristics according to vaccine type, such as messenger RNA (mRNA), viral vector adenovirus, or inactive virus. A possible mechanism is that adjuvant-induced autoimmune/inflammatory syndrome (ASIA syndrome) in genetically susceptible individuals may cause SAT through thyroid destruction by disrupting the immunological balance of the host (34, 35). Another possible mechanism is that antibodies developed against SARS-CoV-2 proteins could cross-react against thyroid antigens because of molecular mimicry (35). Antibodies against thyroid antigens due to this immunologic cross-reaction could be a common mechanism in the SAT pathophysiology after COVID-19 and SARS-CoV-2 vaccination (17).
COVID-19– and SARS-CoV-2 vaccine–related cases of SAT have been reported as case series in the literature, and few studies with few cases investigated the differences between them (4, 23,24). Our study, which is the largest-volume study of COVID-19– and SARS-CoV-2 vaccine–related cases of SAT, aimed to compare the clinical features, laboratory findings, treatment response, and course of SAT cases nationwide and to determine the difference, if any, between COVID-19–related and SARS-CoV-2 vaccine–related and classic SATs.
Materials and Methods
Study Design and Participants
The study of subacute THYROiditis related to SARS-CoV-2 VAccine and COVID-19 infection (THYROVAC) was designed as a nationwide, multicenter, observational, retrospective cohort study by the Thyroid Study Group of the Society of Endocrinology and Metabolism of Turkey. Data of SAT cases were retrospectively collected from 53 centers in Turkey from January 1 to April 1, 2022. Ethical approval has been obtained from the local ethical committee of Koc University (project No. 2021.438.IRB1.127).
SAT diagnosis was evaluated by symptomatology, physical examination, laboratory results, and imaging findings according to the guidelines of the American Thyroid Association (36). All study participants were monitored and treated by endocrinologists according to international guidelines (36). All patients' laboratory tests and ultrasound examinations were performed at the time of SAT diagnosis, at remission assessment, and at SAT recurrence. After treatment initiation, symptoms and inflammatory signs (C-reactive protein [CRP] and erythrocyte sedimentation rate [ESR]) were evaluated every 2 weeks, and thyroid function tests were conducted monthly until remission. After remission, the patients were evaluated for hypothyroidism every 2 months. Nonsteroidal anti-inflammatory drugs (NSAIDs) were preferred in patients with mild symptoms and mild laboratory findings immediately after the SAT diagnosis. Steroid therapy was preferred in those with severe symptoms and/or those who did not respond to NSAIDs within 1 to 2 weeks. Resolution of symptoms, discontinuation of medications, recovery of thyrotoxicosis, and resolution of inflammation in laboratory values (CRP and ESR) were considered remission criteria. Remission was accepted if all of these findings were present. Recurrence was determined as reappearance of symptoms (neck pain and tenderness), increased inflammatory markers (CRP and ESR), and ultrasound findings after remission. During follow-up, patients with thyrotropin (TSH) levels above the upper limit (> 4.5 mIU/L) and normal or low free triiodothyronine (FT3) and free thyroxine (FT4) levels were considered to have hypothyroidism. In the present study, incident hypothyroidism was considered if diagnosed in patients with a follow-up period of more than 30 days, and established hypothyroidism if it was diagnosed after more than 180 days of follow-up. When the hypothyroidism was also captured later than 1 year from the follow-up period, it was considered as permanent hypothyroidism (37).
The THYROVAC study included patients who were older than 18 years and diagnosed with SAT. Patients with COVID-19 infection and SAT diagnosis within 3 months after being tested polymerase chain reaction positive were included in the Cov-SAT group, patients with SAT within 3 months after the SARS-CoV-2 vaccination were included in the Vac-SAT group, and patients with classic SAT without a history of COVID-19 infection and SARS-CoV-2 vaccination were included in the Cont-SAT group. Patients who met the criteria between March 2020, when the first case of COVID-19 was observed in Turkey, and April 2022 were included in the Cov-SAT group. In the Vac-SAT group, patients who met the criteria from January 2021, when vaccination started in Turkey, to April 2022 were included. Cases in the Cont-SAT group were diagnosed between November 2011 and March 2022. Patients with a follow-up period of more than 30 days and available follow-up thyroid function tests (n = 653) were analyzed for comparison of treatment, follow-up, and presence of incident hypothyroidism; patients with a follow-up period of 47 days or more, the duration during which the first recurrence case had been captured, were evaluated for recurrence (n = 623); and all patients with a follow-up period of 180 days or more (n = 236) were evaluated for established hypothyroidism. A minority of the cases (n = 97) had been followed up for 1 year or more and were evaluated for permanent hypothyroidism (Fig. 1). Some of the cases included in our study were previously published as case series in the literature (4, 19, 20, 22-24, 26).
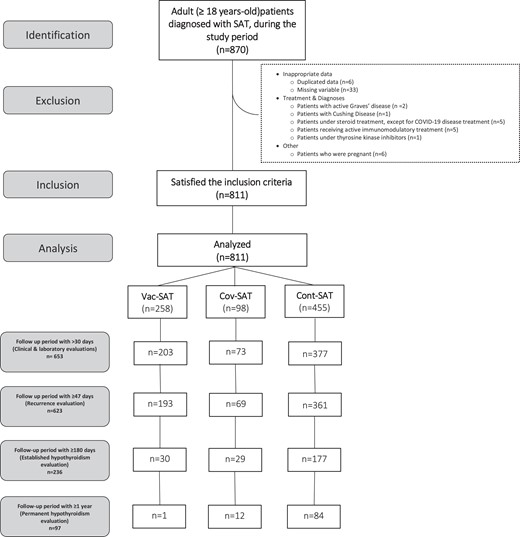
STROBE (Strengthening the Reporting of Observational Studies in Epidemiology) diagram of the study. *Cont-SAT, classic subacute thyroiditis; Cov-SAT, COVID-19–related subacute thyroiditis; Vac-SAT, SARS-CoV-2 vaccine–related subacute thyroiditis. *Patients with a follow-up period of more than 30 days and follow-up thyroid function tests available (n = 653) were analyzed for treatment evaluation and follow-up comparisons, patients with a follow-up period of 47 days or more (n = 623) were evaluated for recurrence, and all patients with a follow-up period of 180 days or more (n = 236) were evaluated for established hypothyroidism.
Patients who had COVID-19 after SARS-COV-2 vaccination were not included in this study. Patients with pregnancy, with Graves disease, with toxic nodular goiter, taking active therapy with tyrosine kinase inhibitors or immunomodulatory drugs, diagnosed with malignant disease, and receiving active chemotherapy, diagnosed with Cushing syndrome, using chronic steroid therapy (with the exception of a short course for a mild to moderate COVID-19 infection that was treated in the outpatient clinic but did not require hospitalization), or who had received active radiation therapy to the neck in the past 3 months, with a history of severe active infection, multiorgan failure, and hospitalization in the intensive care unit were excluded. In addition, patients with a history of another vaccination (human papillomavirus, influenza, pneumonia, and hepatitis B vaccination) were excluded from the study (see Fig. 1).
Procedures
Data for all study participants were obtained from clinical examination records, hospital digital data systems, and telephone patient interviews. Patients’ demographic data, history of thyroid disease, history of SAT, history of familial thyroid disease, smoking, and symptomatology were evaluated. Patients with positive antithyroid peroxidase (TPO) and/or antithyroglobulin (TG) antibodies and findings consistent with chronic thyroiditis on ultrasonography were considered to have chronic autoimmune thyroiditis. A patient who had been diagnosed with Graves disease in the past, but was cured and no longer in need of medical treatment for Graves disease and when evaluated at SAT diagnosis did not satisfy the criteria for active Graves disease, was defined as having inactive Graves disease. The biochemical and imaging studies of such patients who were defined as having inactive Graves disease, but had clinical and laboratory findings consistent with SAT, were considered as SAT case patients. Typical symptoms such as neck pain, neck swelling, tenderness, tremor, fever, weight loss, sweating, fatigue, and signs such as goiter and tachycardia were also evaluated. Neck tenderness was both reported by the patient and clinically confirmed by the clinician. TSH, FT4, FT3, CRP, ESR levels, and white blood cell (WBC) count at the time of diagnosis were documented. In addition, anti-TG, anti-TPO, and TSH receptor antibody (TRAB) values were added, if available. All assays were studied in laboratories affiliated with the National Ministry of Health of Turkey, and the units were equalized in the laboratory data. The reference values of laboratory tests used in this study were as follows: CRP, 0 to 5 mg/dL; TSH, 0.38 to 4.50 mIU/L; FT4, 11 to 22 pmol/L; FT3, 3.1 to 6.8 pmol/L; ESR, 0 to 20 mm/h; and WBC, 4 to 10 × 109/L. All assays used in this study were uploaded to the journal submission system as Supplementary Table 1A and 1B (38). Ultrasound examination was performed by endocrinologists of (all the authors of the study) with at least 3 years of experience in ultrasound examination with a 13-MHz linear probe. SAT-related findings such as heterogeneity and hypoechoic areas were examined. Thyroid gland vascular flow was evaluated by Doppler sonography. The ultrasonography, Doppler vascularization, and scintigraphy (if available) findings of the patients were also noted. The patients’ therapies were all evaluated. Steroid dose was determined as the initial dose given to the patient, and it was typically tapered and stopped approximately within 6 to 8 weeks. The treatment responsiveness and outcomes of incident hypothyroidism, established hypothyroidism, permanent hypothyroidism, or recurrence during the follow-up period were all documented.
Statistical Analysis
All statistical analyses were conducted using IBM SPSS Statistics for Windows version 26 (IBM Corp) and R version 4.0.5 (R Core Team) software. The normality of data distribution was checked using the Kolmogorov-Smirnov test. Baseline characteristics are summarized as mean ± SD or median (Q1-Q3), and categorical variables are presented as numbers and percentages. Pearson chi-square test or Fisher exact test are used for categorical variables. After the chi-square test, post hoc test with Bonferroni adjustment was applied for some variables to determine the significant group (39). Continuous variables were analyzed using the Kruskal-Wallis test with Dunn post hoc test or the Mann-Whitney test. Both statistically significant variables in univariate analysis and clinically possible associated variables (TSH, FT4, FT3, CRP, sex, age, SAT etiology, time between exposure to probable cause and onset of symptom(s), and steroid treatment requirement), which are considered factors that are closely related to recurrence, were used as predictors in the Cox proportional-hazards model. Similarly, statistically significant variables in univariate analysis and clinically possible associated variables (TSH, FT3, FT4, CRP, sex, age, anti-TPO positivity, anti-TG positivity, SAT etiology, time between exposure to probable cause and onset of symptom(s), and steroid therapy) were included when performing the model for predicting factors associated with incident hypothyroidism. In Cox regression analyzes, besides the Cov-SAT and Vac-SAT groups, the control SAT group solely included cases diagnosed before the COVID-19 pandemic (n = 129) to exclude possible asymptomatic COVID-19 cases. A forward-conditional variable selection was applied to the predictors in the Cox proportional-hazards model to eliminate statistically nonsignificant predictors and prevent multicollinearity problems. Additionally, the follow-up time was limited to between 47 days and 1 year for recurrence; this time was confined to between 30 days and 1 year for incident hypothyroidism to prevent the effect of outliers on the model. Furthermore, such an upper limit of follow-up duration aimed to avoid selection bias that may be caused by other SAT etiologies, since a longer follow-up duration was impossible for the new entities (Vac-SAT and Cov-SAT) in the present study (see Fig. 1). Finally, the linearity assumption and proportional-hazard assumption with SAT strata were checked by Martingale and Schoenfeld residual plots for the model. The hazard ratio (HR) with a 95% CI was calculated for each independent variable and the statistically significant variables visualized in forest plots. A 2-sided P value of less than .05 was considered statistically significant, except for post hoc tests where the P value of .008 was accepted as statistically significant.
Results
The study included 811 of 870 patients who were diagnosed with SAT and satisfied the inclusion criteria (see Fig. 1). Of these, 258 (31.8%) were clustered in the Vac-SAT, 98 (12.1%) in the Cov-SAT, and the remaining 455 (56.1%) in the Cont-SAT group. Of the 455 patients diagnosed with Cont-SAT, 129 (28.4%) had been diagnosed in the pre–COVID-19 era, and the remaining 326 patients (71.6%) were diagnosed during the COVID-19 pandemic. All of the COVID-19 case patients who had been hospitalized for severe COVID-19 infection were excluded because of a variety of confounding factors. Patients who had been managed in the outpatient clinic for mild to moderate COVID-19 disease and had received steroids for a short-time (≤ 7 days) were not excluded (n = 5) from the analysis of Cov-SAT. Of the cases in the Vac-SAT group, 203 (78.7%) were recognized as messenger RNA (mRNA) vaccines (Pfizer/BioNTech), 54 (20.9%) as inactivated vaccines (Synovac/CoronaVac), and 1 (0.4%) as a viral vector vaccine (AstraZeneca). No statistical difference was found between the SAT etiology groups in terms of age, sex, thyroid disease in the past, smoking, and familial thyroid disease history. The time between SARS-CoV-2 vaccine and SAT diagnosis in the Vac-SAT group was 20 days (range, 10-40 days), the time between polymerase chain reaction positivity and diagnosis in the Cov-SAT group was 21 days (range, 5-39 days), and the time between viral infection and diagnosis in the Cont-SAT group was 13 days (range, 3-22 days), which was statistically significantly lower in the Cont-SAT group (P < .001). The most common symptoms in all groups were neck pain and tenderness (Table 1). Neck pain was less frequent in the Cov-SAT group (P = .016) than in the other groups. No statistically significant difference was found between the groups regarding laboratory parameters, TSH, FT4, FT3, CRP, ESR, WBC, anti-TPO positivity, anti-TG positivity, and TRAB positivity at baseline. No statistically significant difference was observed in imaging findings, including ultrasonography, Doppler vascularization, and scintigraphy (see Table 1).
Comparison of demographic data and clinical characteristics of the groups at time of subacute thyroiditis diagnosis (n = 811)
| Parameters (Q1-Q3 or %) | Vac-SAT (n = 258) | Cov-SAT (n = 98) | Cont-SAT (n = 455) | P |
|---|---|---|---|---|
| Male sex, n (%) | 71 (27.5%) | 34 (34.7%) | 117 (25.7%) | .195 |
| Age, y | 42 (36-49) | 41 (36-50) | 42 (37-49) | .643 |
| Thyroid disease, n (%) | 22 (9.3%) | 8 (8.2%) | 38 (8.4%) | .244 |
| Chronic autoimmune thyroiditis, n (%) | 3 (1.2%) | 1 (1.0%) | 14 (3.1%) | |
| Nodular goiter, n (%) | 18 (7%) | 7 (7.1%) | 24 (5.3%) | |
| Inactive Graves, n (%) | 1 (0.4%) | N/A | N/A | |
| History of SAT, n (%) | 4 (1.6%) | 2 (2.0%) | 13 (2.9%) | .529 |
| Family history of thyroid disease, n (%) | 53 (20.5%) | 19 (19.4%) | 95 (20.9%) | .946 |
| Smoking, n (%) | ||||
| Never | 202 (78.3%) | 78 (79.6%) | 381 (83.7%) | .190 |
| Past | 21 (8.1%) | 10 (10.2%) | 23 (5.1%) | |
| Current | 35 (13.6%) | 10 (10.2) | 51 (11.2%) | |
| Symptoms | ||||
| Time between exposure to probable cause and onset of symptom(s), d | 20 (10-40) | 21 (5-39) | 13 (3-22) | < .001a,b |
| Duration of symptoms, d | 30 (20-48) | 30 (20-60) | 35 (20-50) | .303 |
| Neck pain, n (%) | 250 (96.9%) | 88 (89.8%) | 435 (95.6%) | .016a,c |
| Tenderness, n (%) | 235 (91.1%) | 85 (86.7%) | 400 (87.9%) | .160 |
| Swelling in the neck, n (%) | 117 (45.3%) | 49 (50%) | 168 (36.9%) | .064 |
| Fever, % | 94 (36.4%) | 42 (42.9%) | 170 (37.4%) | .696 |
| Sweating, n (%) | 101 (39.1%) | 43 (43.9%) | 163 (35.8%) | .732 |
| Tremor, n (%) | 69 (26.7%) | 24 (24.5%) | 96 (21.2%) | .466 |
| Weight loss, n (%) | 73 (28.3%) | 20 (20.4%) | 124 (27.3%) | .204 |
| Fatigue n (%) | 126 (48.8%) | 53 (54.1%) | 250 (54.9%) | .060 |
| Signs | ||||
| Goiter, n (%) | 57 (22.1%) | 23 (23.5%) | 92 (20.2%) | .965 |
| Tachycardia, n (%) | 110 (42.6%) | 48 (49.0%) | 190 (41.8%) | .547 |
| Laboratory and imaging findings | ||||
| TSH, mIU/L | 0.02 (0.01-0.10) | 0.03 (0.01-0.14) | 0.02 (0.01-0.12) | .829 |
| FT4, pmol/L | 25.5 (20-37) | 23.6 (17.4-31.3) | 24.7 (17.4-34.5) | .273 |
| FT3, pmol/L | 7.1 (5.5-10.4) | 7.1 (5.8-9.3) | 6.9 (5.4-9.3) | .309 |
| FT4/FT3 ratio | 3.5 (2.9-4) | 3.2 (2.8-3.8) | 3.4 (2.9-4) | .258 |
| CRP, mg/dL | 44 (18.9-75) | 46 (18.7-84.8) | 43 (15.2-85.2) | .985 |
| ESR, mm/h | 50 (32-72) | 53 (31-71.5) | 56 (34.8-78) | .128 |
| WBC, ×109/L | 8.7 (7.2–10.6) | 8.6 (6.5–11) | 8.9 (7.3-10.4) | .589 |
| Anti-TPO positivity, n (%) (n = 617) | 23/190 (12.1%) | 4/79 (5.1%) | 32/348 (9.2%) | .210 |
| Anti-TG positivity (n (%) (n = 552) | 50/174 (28.7%) | 14/69 (20.3%) | 61/309 (19.7%) | .068 |
| TRAB positivity, n (%) (n = 194) | 2/83 (2.4%) | N/A | 5/111 (4.5%) | .659 |
| Ultrasonography (n = 774) | (n = 245) | (n = 93) | (n = 436) | |
| Heterogeneous parenchyma, n (%) | 177/245 (72.2%) | 71/93 (76.3%) | 310/436 (71.1%) | .586 |
| Hypoechoic areas, n (%) | 232/245 (94.7%) | 89/93 (95.7%) | 415/436 (95.2%) | .916 |
| Doppler (n = 367) | (n = 148) | (n = 38) | (n = 181) | .093 |
| Decreased vascularity, n (%) | 94 (63.5%) | 25 (65.8%) | 90 (49.7%) | |
| Thyroid scintigraphy (n = 117) | (n = 42) | (n = 16) | (n = 59) | .409 |
| Decreased scintigraphic uptake, n (%) | 40 (95.2%) | 15 (93.8%) | 53 (89.8%) | |
Parameters presented as median and interquartile ranges (25%-75%) or percentage.
Abbreviations: Cont-SAT, classic subacute thyroiditis; Cov-SAT, COVID-19–related subacute thyroiditis; CRP, C-reactive protein; ESR, erythrocyte sedimentation rate; FT3, free triiodothyronine; FT4, free thyroxine; N/A, not available; SAT, subacute thyroiditis; TG, thyroglobulin; TPO, thyroid peroxidase; TRAB, thyrotropin receptor antibody; TSH, thyrotropin; Vac-SAT, SARS-CoV-2 vaccine–related subacute thyroiditis; WBC, white blood cell.
P less than .05 is statistically significant.
According to post hoc tests, statistically significant difference was found between the pairs Cont-SAT/Cov-SAT (P = .001) and Cont-SAT/Vac-SAT in terms of the time between exposure to probable cause and onset of symptom(s) (P < .001).
According to post hoc tests, neck pain was statistically significantly lower in the Cov-SAT group than in the other groups (P = .005).
A total of 653 patients with more than 30 days of follow-up were analyzed for the treatment and follow-up findings. The median follow-up time was 120 days (range, 60-239 days) in the Cov-SAT group and 150 days (range, 70-300 days) in the Cont-SAT group, which was statistically lower in the Vac-SAT group with 90 days (range, 60-120 days) (P < .001), as expected. The rates of steroid treatment (defined as the number of patients who required steroid treatment within the specified group) both in the Cov-SAT and Vac-SAT groups were statistically lower than that in the Cont-SAT group (P = .049). The rate of patients followed up without treatment and NSAID medication therapy, NSAID treatment duration, steroid treatment duration, steroid treatment dose, time of achievement of remission, and recovery of thyrotoxicosis within the first 30 days of follow-up demonstrated no differences between the SAT etiology groups (Table 2). Most cases achieved remission approximately within 4 to 8 weeks of treatment.
Comparison of the treatment and follow-up findings of the groups (n = 653)
| Parameters (Q1-Q3 or %) | Vac-SAT (n = 203) | Cov-SAT (n = 73) | Cont-SAT (n = 377) | P |
|---|---|---|---|---|
| Treatment (n = 653) | ||||
| Steroid therapy, n (%) | 100 (49.3%) | 39 (53.4%) | 225 (59.7%) | .049a,e |
| NSAID therapy, n (%) | 154 (75.9%) | 52 (71.2%) | 252 (66.8%) | .075 |
| None, n (%) | 8 (3.9%) | 6 (8.2%) | 20 (5.3%) | .366 |
| NSAID treatment duration, d | 15 (10-28) | 15 (10-26) | 15 (10-28) | .679 |
| Steroid treatment duration, d | 42 (30-56) | 39 (30-60) | 42 (30-56) | .614 |
| Steroid treatment dose, mg/df | 32 (32-32) | 32 (29-32) | 32 (24-32) | .448 |
| Follow-up (n = 653) | ||||
| Follow-up time, d | 90 (60-120) | 120 (60-239) | 150 (70-300) | <.001a,g |
| Time of achievement of remission, d | 30 (20-50) | 30 (20-60) | 35 (22-53) | .234 |
| Recovery of thyrotoxicosis within first 30 d of follow-up | 129 (63.5%) | 49 (67.1%) | 215 (57%) | .136 |
| Incident hypothyroidism, n (%) | 73 (36%) | 20 (27.4%) | 127 (33.7) | .414 |
| Recurrence, n (%) (n = 623)b | 23/193 (11.9%) | 14/69 (20.3%) | 56/361 (15.5%) | .219 |
| Established hypothyroidism, n (%) (n = 236)c | 7/30 (23.3%) | 6/29 (20.7%) | 42/177(23.7%) | .938 |
| Permanent hypothyroidism, n (%), (n = 97)d | 0/1 (0%) | 4/12 (33.3%) | 23/84 (27.4%) | .750 |
Parameters presented as median and interquartile range (25%-75%) or percentage.
Abbreviations: Cont-SAT, classic subacute thyroiditis; Cov-SAT, COVID-19–related subacute thyroiditis; NSAID, nonsteroidal anti-inflammatory drug; Vac-SAT, SARS-CoV-2 vaccine–related subacute thyroiditis.
P less than .05 is statistically significant.
Patients with a follow-up of 47 days or more (n = 623).
Patients with a follow-up of 180 days or more (n = 236).
Patients with a follow-up of 1 year or more (n = 97).
According to post hoc tests, steroid therapy was statistically significantly higher in the Cont-SAT than in the other groups (P = .006)
Steroid treatment was calculated at an equivalent dose of methylprednisolone
According to post hoc tests, statistically significant difference was observed between the pairs Vac-SAT/Cov-SAT (P = .004) and Vac-SAT/Cont-SAT in terms of follow-up time (P < .001).
A total of 623 patients with a follow-up duration of 47 days or more were examined for SAT recurrence. No statistically significant difference was found between the SAT etiology groups in terms of SAT recurrence rates (see Table 2). A total of 653 patients with more than a 30-day follow-up duration were analyzed for incident hypothyroidism, 236 patients with 180 days or more of follow-up were examined for established hypothyroidism, and 97 patients with 1 year or more outcome for permanent hypothyroidism. While the rate of incident hypothyroidism was 33.7% (220/653) in patients followed up for more than 30 days, it decreased to 23.3% (55/236) in those followed up for 180 days or more (P = .003). The rate of permanent hypothyroidism was 27.8% (27/97) in patients with more than 1 year of follow-up. No difference was noted between the groups in terms of the rate of incident, established, or permanent hypothyroidism (see Table 2). When the Cont-SAT group was subanalyzed separately for SAT timing and compared with classic SAT before the COVID-19 pandemic (n = 129) and classic SATs during the COVID-19 pandemic (n = 326), no statistical difference was observed in recurrence rate and incident, established, or permanent hypothyroidism (Supplementary Table S2) (40).
Patients with more severe symptoms and who had been more thyrotoxic at baseline tended to comply with follow-up visits for a longer time than patients with fewer symptoms. Other parameters were similar between the patients who had been followed up for shorter or longer durations (Supplementary Table S3A and 3B) (41).
The mRNA vaccine–related SAT (mRNA Vac-SAT) and inactivated vaccine–related SAT (inactivated Vac-SAT) subgroups are compared in Table 3. Between these subgroups, no difference was observed with respect to age, sex, time between exposure to probable cause and onset of symptom(s), and rates of vaccination dose, which were probably responsible for SAT onset. The rate of SAT was observed most frequently after the second dose of vaccination in both groups (66.5% and 74.1%). No statistically significant difference was found in terms of the follow-up period, steroid and NSAID treatment rates, time of achievement of remission, and thyrotoxic period duration. Moreover, no statistically significant difference was found in terms of recurrence or incident, established, or permanent hypothyroidism outcomes.
Comparison of demographic data, treatment, and follow-up outcomes of messenger RNA vaccine–related subacute thyroiditis (SAT) and inactivated vaccine–related SAT (n = 257f)
| Parameters (Q1-Q3 or %) | mRNA Vac-SAT (n = 203) | Inactivated Vac-SAT (n = 54) | Pa |
|---|---|---|---|
| Age, y | 42 (36-49) | 43.5 (38-61) | .083 |
| Male sex, n (%) | 57 (28.1%) | 14 (25.9%) | .787 |
| Time between onset of vaccine and symptoms, d | 20 (10-40) | 19 (9-37) | .426 |
| Vaccine dose rate | .559 | ||
| First dose, n (%) | 50 (24.6%) | 12 (22.2%) | |
| Second dose, n (%) | 135 (66.5%) | 40 (74.1%) | |
| Third dose, n (%) | 14 (6.9%) | 2 (3.7%) | |
| Treatment and follow-up (n = 202)b | n = 157 | n = 45 | |
| Follow-up time, d | 90 (60-120) | 100 (60-180) | .135 |
| Treatment | |||
| Steroid therapy, n (%) | 78 (49.7%) | 22 (48.9%) | .925 |
| NSAID therapy, n (%) | 116 (73.9%) | 37 (82.2%) | .250 |
| None, n (%) | 7 (4.5%) | 1 (2.2%) | .498 |
| Time of achievement of remission, d | 30 (19-50) | 39 (21-58) | .169 |
| Recovery of thyrotoxicosis within first 30 d of follow-up | 99/157 (63.1%)) | 29/45 (64.1%) | .865 |
| Incident hypothyroidism, n (%) | 55 (35%) | 18 (40%) | .541 |
| Recurrence, n (%) (n = 192)c | 16/150 (10.7%) | 7/42 (16.7%) | .290 |
| Established hypothyroidism, n (%) (n = 30)d | 6/17 (35.3%) | 1/13 (7.7%) | .077 |
| Permanent hypothyroidism, n (%)e | 0/1 (0%) | N/A | N/A |
Parameters presented as the median and interquartile range (25%-75%) or percentage.
Abbreviations: Inactivated Vac-SAT, inactivated vaccine (Synovac/CoronaVac)-related subacute thyroiditis; mRNA Vac-SAT, messenger RNA vaccine (Pfizer/BioNTech)-related subacute thyroiditis; N/A, not available; NSAID, nonsteroidal anti-inflammatory drug.
P less than .05 is statistically significant.
Patients with a follow-up of more than 30 days (n = 202).
Patients with a follow-up of 47 days or more (n = 192).
Patients with a follow-up of 180 days or more (n = 30).
Patients with a follow-up of 1 year or more (n = 1)
Viral vector vaccine (AstraZeneca) (n = 1) is not included in this table.
No difference was found between the groups with and without recurrence in terms of SAT etiology. With regard to laboratory values at the time of diagnosis, TSH (P < .001) was higher, whereas FT4 (P < .001), FT3 (P < .001), FT4/FT3 ratio (P = .009), CRP (P = .015), and ESR (P = .006) values were lower in patients with recurrence. Steroid therapy had been more frequently prescribed in the recurrence group (89.2% vs 52.5%; P < .001) (Supplementary Table S4) (42).
The characteristics and comparisons of patients with established hypothyroidism at follow-up are shown in Table 4. No difference was found between the groups in terms of SAT etiology. Neck pain was reported less frequently by patients in the group with established hypothyroidism (P = .012). Anti-TPO positivity was higher (P = .003), whereas the rate of steroid therapy (66.3% vs 43.6%) was lower in the hypothyroid group (P = .003).
Comparison of clinical and follow-up parameters of patients with subacute thyroiditis according to established hypothyroidism (patients with follow-up of ≥ 180 days, n = 236)
| Parameters (Q1-Q3 or %) | Established hypothyroidism (−) (n = 181) | Established hypothyroidism (+) (n = 55) | P |
|---|---|---|---|
| SAT etiology | .938 | ||
| Vac-SAT | 23 (76.7%) | 7 (23.3%) | |
| Cov-SAT | 23 (79.3%) | 6 (20.7%) | |
| Cont-SAT | 135 (76.3%) | 42 (23.7%) | |
| Age, y | 41 (37-48) | 43 (38-52) | .240 |
| Male sex, n (%) | 45 (24.9%) | 10 (18.2%) | .305 |
| Thyroid disease, n (%) | 19 (10.5%) | 6 (10.9%) | .931 |
| Family history of thyroid disease, n (%) | 42 (23.2%) | 15 (27.3%) | .537 |
| Time between exposure to probable cause and onset of symptom(s), d | 14 (5-32) | 10 (3-30) | .509 |
| Neck pain, n (%) | 176 (97.2%) | 49 (89.1%) | .012a |
| Fever, n (%) | 76 (42%) | 21 (38.2%) | .713 |
| TSH, mIU/Lb | 0.03 (0.01-0.28) | 0.02 (0.01-0.05) | .059 |
| FT4, pmol/Lb | 23.4 (16.7-34.1) | 28.3 (18-35.5) | .314 |
| FT3, pmol/Lb | 6.6 (5.3-9) | 7.4 (5.4-9.3) | .331 |
| FT4/FT3 ratiob | 3.3 (2.9-4.1) | 3.5 (3.1-4.1) | .231 |
| CRP, mg/dLb | 43.4 (16.4-70.4) | 30.7 (11-70.8) | .230 |
| ESR, mm/hb | 54 (31.5-73.8) | 47 (28.5-77) | .795 |
| WBC, ×109/Lb | 8.7 (7.2–10.1) | 8.1 (6.8–10.1) | .156 |
| Anti-TPO positivity, n (%)b | 7/115 (6.1%) | 16/80 (19.8%) | .003a |
| Anti-TG positivity, n (%)b | 20/99 (20.2%) | 18/73 (24.7%) | .486 |
| NSAID, n (%) | 119 (65.7%) | 40 (72.7%) | .333 |
| NSAID treatment duration, d | 15 (10-30) | 20 (10-28) | .627 |
| Steroid therapy, n (%) | 120 (66.3%) | 24(43.6%) | .003a |
| Steroid treatment dose, mg/dc | 32 (24-32) | 32 (30.5-32) | .569 |
| Recovery of thyrotoxicosis within first 30 d of follow-up (n = 225) | 30/54 (55.6%) | 91/171 (53.2%) | .764 |
Parameters presented as the median and interquartile range (25%-75%) or percentage.
Abbreviations: Cont-SAT, classic subacute thyroiditis; Cov-SAT, COVID-19–related subacute thyroiditis; CRP, C-reactive protein; ESR, erythrocyte sedimentation rate; FT3, free triiodothyronine; FT4, free thyroxine; NSAID, nonsteroidal anti-inflammatory drug; SAT, subacute thyroiditis; TG, thyroglobulin; TPO, thyroid peroxidase; TSH, thyrotropin; Vac-SAT, SARS-CoV-2 vaccine–related subacute thyroiditis; WBC, white blood cell.
P less than .05 is statistically significant.
At time of SAT diagnosis.
Steroid treatment was calculated at an equivalent dose of methylprednisolone.
Owing to an inadequate number of patients with a follow-up period of 180 days or greater in the Vac-SAT and Cov-SAT groups, Cox regression analysis for predicting risk factors associated with established hypothyroidism could not be performed. Instead, regression analysis was performed to predict risk factors associated with incident hypothyroidism (Table 5) and SAT recurrence (Table 6). To avoid any conflict of undiagnosed (asymptomatic) Cov-SAT cases fitted in the Cont-SAT group, the regression analysis included Cont-SAT cases diagnosed before the COVID-19 pandemic only, as well as the entire Vac-SAT and Cov-SAT groups. CRP levels at SAT diagnosis (HR: 1.010; 95% CI, 1.002-1.019; P = .013), male sex (HR: 0.336; 95% CI, .163-.693; P = .003), anti-TPO positivity (HR: 0.086; 95% CI, 0.012-.636; P = .027), and steroid therapy (HR: 0.511; 95% CI, 0.282-0.926; P = .001) were statistically significant predictors of incident hypothyroidism. Steroid therapy requirement (HR: 9.682; 95% CI, 2.239-41.865; P = .002) and age (HR: 0.954; 95% CI, 0.910-1.000; P = .048) were statistically significant predictors of SAT recurrence.
Predictors of incident hypothyroidism between 30 days’ and 1 year’s follow-up duration
| β estimates with SE | Hazard ratio (95% CI) | Wald | P | |
|---|---|---|---|---|
| Univariate | ||||
| Male sex | −0.120 ± 0.249 | 0.887 (0.545-1.445) | 0.231 | .630 |
| Age, y | −0.008 ± 0.011 | 0.992 (0.971-1.014) | 0.503 | .478 |
| Time between exposure to probable cause and onset of symptom(s), d | 0.001 ± 0.005 | 0.999 (0.988-1.010) | 0.035 | .852 |
| Vac-SAT | 0.771 ± 0.335 | 2.161 (1.122-4.161) | 5.307 | .021a |
| Cov-SAT | −0.250 ± 0.443 | 0.779 (0.327-1.855) | 0.319 | .572 |
| TSH, mIU/L | −3.069 ± 1.792 | 0.046 (0.001-1.558) | 2.933 | .087 |
| FT4, pmol/L | 0.008 ± 0.008 | 1.008 (0.993-1.024) | 1.106 | .293 |
| FT3, pmol/L | 0.042 ± 0.022 | 1.043 (1.000-1.088) | 3.792 | .047a |
| CRP, mg/dL | 0.001 ± 0.003 | 1.001 (0.995-1.008) | 0.174 | .676 |
| Anti-TPO positivity | −0.152 ± 0.347 | 0.859 (0.435-1.696) | 0.192 | .661 |
| Anti-TG positivity | −0.297 ± 0.321 | 0.743 (0.396-1.395) | 0.854 | .355 |
| Steroid therapy | −0.772 ± 0.246 | 0.462 (0.285-0.748) | 9.869 | .001a |
| Multivariate | ||||
| CRP, mg/dL | 0.010 ± 0.004 | 1.010 (1.002-1.019) | 6.105 | .013a |
| Male sex | −1.091 ± 0.369 | 0.336 (0.163-0.693) | 8.718 | .003a |
| Anti-TPO | −2.452 ± 1.020 | 0.086 (0.012-0.636) | 5.781 | .027a |
| Steroid therapy | −0.671 ± 0.303 | 0.511 (0.282-0.926) | 4.896 | .001a |
Reference for sex: female; reference for Anti-TPO: negative; reference for Anti-TG: negative; reference for SAT: Cont-SAT, classic subacute thyroiditis; reference for steroid therapy: no.
Abbreviations: Cont-SAT, classic subacute thyroiditis; Cov-SAT, COVID-19–related subacute thyroiditis; CRP, C-reactive protein; FT3, free triiodothyronine; FT4, free thyroxine; TG, thyroglobulin; TPO, thyroid peroxidase; TSH, thyrotropin; Vac-SAT, SARS-CoV-2 vaccine–related subacute thyroiditis.
P less than .05 is statistically significant.
Predictors of recurrence between 47 days’ and 1 year’s follow-up duration
| β estimates with SE | Hazard ratio (95% CI) | Wald | P | |
|---|---|---|---|---|
| Univariate | ||||
| Male sex | −0.381 ± 0.513 | 0.683 (0.250-1.869) | 0.550 | .458 |
| Age, y | −0.045 ± 0.024 | 0.956 (0.912-1.002) | 3.489 | .062 |
| Time between exposure to probable cause and onset of symptom(s), d | 0.008 ± 0.015 | 1.008 (0.980-1.038) | 0.327 | .568 |
| Vac-SAT | 0.678 ± 0.685 | 1.970 (0.515-7.537) | 0.981 | .322 |
| Cov-SAT | 0.924 ± 0.695 | 2.520 (0.646-9.835) | 1.770 | .183 |
| TSH, mIU/L | 0.044 ± 2.170 | 1.045 (0.015-73.651) | 0.000 | .984 |
| FT4, pmol/L | −0.037 ± 0.023 | 0.963 (0.921-1.008) | 2.634 | .105 |
| FT3, pmol/L | 0.060 ± 0.066 | 0.942 (0.828-1.073) | 0.811 | .368 |
| CRP, mg/dL | −0.001 ± 0.006 | 0.999 (0.987-1.012) | 0.010 | .920 |
| Steroid therapy requirement | 2.270 ± 0.747 | 9.682 (2.239-41.865) | 9.150 | .002a |
| Multivariate | ||||
| Age, y | −0.047 ± 0.024 | 0.954 (0.910-1.000) | 3.904 | .048a |
| Steroid therapy requirement | 2.270 ± 0.747 | 9.682 (2.239-41.865) | 9.235 | .002a |
Reference for sex: female; reference for SAT: Cont-SAT, classic subacute thyroiditis; reference for steroid therapy: no.
Abbreviations: Cont-SAT, classic subacute thyroiditis; Cov-SAT, COVID-19–related subacute thyroiditis; CRP, C-reactive protein; FT3, free triiodothyronine; FT4, free thyroxine; TG, thyroglobulin; TPO, thyroid peroxidase; TSH, thyrotropin; Vac-SAT, SARS-CoV-2 vaccine–related subacute thyroiditis.
P less than .05 is statistically significant.
Discussion
This study is the first nationwide study that revealed no difference in SAT etiology (COVID-19– or SARS-CoV-2 vaccine–associated SAT or classic SAT) in terms of recurrence, incident hypothyroidism, and probable established hypothyroidism. No difference was found between mRNA SARS-CoV-2 vaccine– and inactivated SARS-CoV-2 vaccine–related SAT cases in terms of clinical features, treatment, or outcomes. Recurrence was determined by younger patient age and steroid therapy requirement. While more severe inflammation (determined by higher CRP levels) at the time of SAT diagnosis increased the risk of incident hypothyroidism, steroid therapy decreased the risk. Although anti-TPO positivity inversely predicted incident (early) hypothyroidism, the opposite was associated with later (established) hypothyroidism. All these associations were independent of SAT etiology.
In our country, with a population of 85 million, approximately 17 million people had COVID-19 and approximately 102 000 people died. During this pandemic, a total of more than exceedingly 152 000 000 vaccine doses have been administered to date, and the rate of 2-dose vaccination is 85.7% (43). One study found that SAT cases were generally observed in the 30- to 50-year-old age group and predominantly affected the female sex (37). Consistent with the literature, our study found that COVID-19– and SARS-CoV-2 vaccine–related SAT were more common in women and were more frequently observed in the fourth decade of life, similar to classic SAT (3-14, 17-33). Although neck pain was statistically slightly less common in COVID-19–related SAT cases, it was the most common symptom and occurred in almost the entire study population (773/811, 95.3%). Considering the subjective nature of these symptoms, we think this small difference between groups is not clinically important. A comparative study revealed more intense neck pain and a higher fever incidence in COVID-19–related SAT cases, and it also was based on subjective evaluations (44). Our study revealed no difference in either other symptoms nor laboratory data and imaging findings between the SAT etiology groups. The causative agents are different, but SAT mechanism and immune response are thought to be similar. No difference was found between the groups in terms of symptom duration in the present study, but a previous study stated that the Vac-SAT group lasted longer than the classic SAT group (23). This may be due to the low number of cases observed early in the pandemic, which was probably related to the lower awareness and late diagnosis of the disease at that time. As the recognition and the number of vaccine-related SAT cases increased in the later stages of the pandemic, it can be observed in their series that symptom duration was close to the median SAT time we observed.
The need for steroid treatment was lower in the present study both in the Cov-SAT and Vac-SAT groups. No laboratory or imaging differences were found between the groups, but the Cov-SAT and Vac-SAT groups were probably clinically milder than the Cont-SAT because of the lower need for steroids. The need for steroid therapy was evaluated by endocrine fellows or specialists as homogeneously as possible in all centers nationwide. Patients with more severe disease were more likely to be treated with steroids. A small case study (4) revealed a similar need for steroids in COVID-19– or SARS-CoV-2 vaccine–related SAT groups and classic SATs. In our study, under pandemic conditions, physicians responsible for SAT management may have hesitated to use steroids because of the risk of immunosuppression after recent COVID-19 or SARS-CoV-2 vaccination due to unestablished knowledge about the disease in that time. In addition, although patients have been followed up by endocrinologists at 53 centers, there may be variations in the prescription of steroids beyond objective criteria. No difference was found between the groups in terms of recurrence, although at baseline the need for steroid treatment was lower both in the Cov-SAT and Vac-SAT groups. The present study also revealed a higher trend (25.5%) of SAT recurrence rate in the COVID-19–related SAT group than in the other 2 groups; however, the difference was not statistically significant. This observation may also support the hypothesis of hesitance in the initiation of steroid treatment during the pandemic because the recurrence rate in classic SAT ranged from 10% to 19% (37, 44). The causes of recurrence remain unknown, although short-term steroid therapy and HLA haplotype(s) are thought to be associated with recurrence (45). The present study demonstrated that steroid treatment requirement was found to be associated with an approximately 10-fold increased risk of recurrence, despite the lack of difference in the dosage of steroid treatment in those with or without recurrence. We suggest that this association between steroid therapy and SAT recurrence does not necessarily represent causality. This could be due to the presence of a more severe disease. In other words, patients who start treatment with steroids already have more severe disease at baseline, and more severe disease may require longer treatment with steroids. In some studies, a higher recurrence rate was observed in patients with SAT who received steroid therapy (37, 44-46). Recurrence was observed to be higher in patients with SAT who received steroid therapy than in those who received NSAID therapy (45) and higher in SAT patients who received high-dose steroid therapy than in patients who received low-dose steroid therapy (47). Another likely mechanism is that steroids may impair the immune response of SAT. Also, some publications have reported contradictory findings (48). Younger patient age was found to be a predictor of recurrence in this study. In studies evaluating recurrence, it has been observed that SAT cases generally occur during middle age (45-47). A meta-analysis stated that there was no difference between those with and without recurrence when evaluated in terms of age (49). Therefore, these findings must be supported by longer follow-up studies.
The frequency of incident hypothyroidism was 33.7% among patients who were followed up for more than 30 days. This frequency decreased to 23.3% in those who followed up for 180 days or more. When a minority of patients who had been followed up for 1 year or longer were analyzed separately, it decreased to 27.8%. Regarding these outcomes, there was no statistically significant difference observed between the SAT etiology groups. The rate of permanent hypothyroidism has been approximately 5% to 23% in classic SATs (37, 48, 50). In an Italian study, the rate of hypothyroidism at 3 months was 87% (13/15) in patients with COVID-19–related SAT, and it was statistically higher than classic SAT (44). In a study by Christensen et al (3), the rate of hypothyroidism was 29.4% (5/17). In the literature, hypothyroidism was observed between 34.8% and 40% in SARS-CoV-2–vaccine-related SAT (17, 23). Since patients with more symptoms complied more with the follow-up visits, and patients with no symptoms were lost to follow-up, the incidence of permanent hypothyroidism in the entire group of SAT cases is probably lower than among patients who had been followed up for 1 year or longer in our study population. To document the frequency of transient and permanent hypothyroidism, longitudinal studies with longer follow-ups are desirable.
The etiology of SAT did not appear to affect the development of hypothyroidism in our study. In regard to anti-TPO positivity, in the early course of the disease, it inversely predicted incident hypothyroidism (see Table 5). On the other hand, anti-TPO positivity changed to a positive association with established hypothyroidism during the longer-follow-up period (see Table 4). Studies have reported inconsistent results regarding anti-TPO as a risk factor for incident hypothyroidism following SAT (45, 51). These seemingly contradictory findings are probably due to a clinical picture resembling transient thyrotoxicosis that is seen in inflammatory thyroiditis cases such as Hashimoto thyroiditis and postpartum thyroiditis. The thyrotoxicosis usually lasts 1 to 3 months, then reverts to euthyroidism, and later to permanent hypothyroidism after 6-month follow-up durations (52). We propose that the association of anti-TPO positivity with long-term (established) hypothyroidism is clinically more relevant than the association of early course. In our study, each 10-mg/dL increment in CRP levels at SAT onset increased the risk (by 10%) of incident hypothyroidism independently. In a study by Tang et al (51), a high CRP value was observed as a risk factor for hypothyroidism. Another study suggested that this may cause hypothyroidism by affecting the thyroid gland because of severe inflammation in SAT patients with high CRP values during the symptomatic period. Steroid therapy was a negative indicator of incident hypothyroidism in our cohort. A 2-year follow-up study of SAT revealed a lower trend in the hypothyroidism rate in the group that was given steroids, although it was not statistically significant (53). We think that the steroid treatment contributed to the maintenance of the functional capacity of the thyroid tissue as a consequence of suppressing the destructive process of thyrocytes, thereby reducing inflammation and the systemic immune response. The occurrence of SAT is more common in women, but it has not been observed in many studies as a predictor of hypothyroidism (45, 51, 53). Although Görges et al (50) reported that women developed hypothyroidism at a higher rate during 3-year follow-ups, from the existing literature the long-term effect of sex on hypothyroidism in SAT remains indefinite.
Our study revealed that Vac-SAT was more frequently (78.7%) caused by mRNA-based vaccines than by inactive vaccines. However, it cannot be precisely inferred that mRNA-based vaccines led to more Vac-SATs compared to inactive virus-based vaccines, since the proportion of each vaccine among vaccinations were not known. A recent large case series study observed that SARS-CoV-2 vaccine–related thyroid test abnormality is generally due to mRNA-based vaccines. This study examined 83 patients with thyroid dysfunctions after SARS-CoV-2 vaccination and observed that the most common thyroid disease (60.2%) related to this vaccination was SAT. Overall, vaccinations with mRNA-based vaccines constituted the majority (68.7%) of these cases (21).
There is currently no clear explanation for the etiopathogenesis of vaccine-induced subacute thyroiditis. The adjuvants contained in the vaccines may cause ASIA syndrome by stimulating immunity (34, 54). The mRNA vaccines (Pfizer/BioNTech) are among the newer vaccine technologies and contain polyethylene glycol and mRNA that encode the SARS-CoV-2 spike protein. A study showed that lipid nanoparticles in mRNA vaccines can induce an immune response (55). In addition, the immune response created by SARS-CoV-2 vaccines may target thyroid tissue because follicle cells express ACE2 mRNA (56). Triggering the autoimmune/inflammatory response as a result of cross-reaction and immune response of these molecules with thyroid tissue antigens appears to be a possible pathophysiological mechanism (57, 58). Genetic predisposition may play an important role in the etiopathology, as in classic SATs. In relation to this, Chatzi et al (29) reported SARS-CoV-2 vaccine-related SAT in 2 sisters. Some studies have observed that the mRNA vaccines (Pfizer/BioNTech) show stronger humoral responses than inactive virus-based vaccines (Synovac/CoronaVac), suggesting a greater immune response involving the thyroid tissues (59). Data similar to our study exist in the literature reporting case series (23, 24). Our study revealed no difference in the treatment and follow-up of SARS-CoV-2 vaccine–associated SAT cases according to vaccine type. Interestingly, in our study, SAT formation was observed at a higher rate after the second dose both in the mRNA Vac-SAT and inactivated Vac-SAT groups. Consistent with our study, in the case study by García et al (60), Pfizer/BioNTech-related SAT cases were more frequent after the second dose.
The strength of this large-volume, multicenter study is related to the inclusion of patients who were homogeneously followed by endocrinologists and the exclusion of probable confounding factors. However, some limitations should be acknowledged because of the retrospective nature of the study. First, documenting the precise etiology of SAT is difficult; however, SARS-CoV-2 vaccine and COVID-19 were considered the possible etiological factors in our study. The viral etiology of the patients with upper respiratory tract infection could not be evaluated in the Cont-SAT group. Second, although the COVID-19 tests at the time of SAT onset were negative in classic SATs diagnosed during the COVID-19 pandemic, asymptomatic COVID-19 within 90 days before SAT diagnosis in this subgroup cannot be excluded definitively. On the other hand, it should be emphasized that there was no difference in terms of clinical outcomes between Cont-SAT subgroups whether diagnosed during or before the pandemic. Furthermore, when considering the regression analysis, we included solely cases diagnosed before the COVID-19 pandemic in the control SAT group to exclude possible asymptomatic COVID-19 cases. Third, the difference in the rates of patients with 47 days or more of follow-up, 180 days or more of follow-up, and total follow-up periods between the groups may have created a bias in terms of incident hypothyroidism and recurrence outcomes. Fourth, established hypothyroidism outcomes in the 180-day or longer follow-up group were analyzed in this study, whereas only a minority of our cohort had long-term follow-up to be analyzed for permanent hypothyroidism. In the follow-up of these patients for more than 1 year, the rates of permanent hypothyroidism may change over time. We acknowledge this as a limitation of our study when interpreting the hypothyroidism outcome, since the regression analysis could be performed during the early course of the disease (incident hypothyroidism), but not during established or permanent hypothyroidism because of an insufficient number of Vac-SAT and Cov-SAT cases to be included in such models. Fifth, hypothyroidism and recurrence predictive statistical analysis specific to the Vac-SAT and Cov-SAT groups could not be performed because an adequate number of patients with a follow-up period 180 days or longer could not be reached during the analysis. Sixth, exclusion of severe COVID-19 cases might have skewed the presentation of SAT related to COVID-19. Last, there is an ongoing debate whether thyrotoxicosis is a necessary criterion for the definition of recurrence; in the presence of subjective symptoms and ultrasonography findings, in addition to increased inflammatory markers (CRP and ESR), it may be handled as a more objective criterion. In our study, thyrotoxicosis was not considered as an essential criterion for the evaluation of SAT recurrence, whereas it was a necessary criterion for the definition of SAT during the first episode. The explanation for this discrepancy between the onset of SAT (the first episode) and recurrence could be related to the number of destructed thyrocytes. In the first episode, owing to the presence of more functional thyroid cells, an increase in thyroid hormone levels (thyrotoxicosis) is to be expected and this may be a prominent clinical feature. However, in case of disease recurrence, the increase in serum thyroid hormone levels may not be sufficient to cause thyrotoxicosis because of incompletely recovered thyroid functions after the first episode. According to our protocol, patients were examined for hypothyroidism every 2 months after the first remission. Therefore, unfortunately, we did not have all patients evaluated for thyroid functions during recurrence onset to be able to evaluate if biochemical recurrence (thyrotoxicosis) is an essential criterion for SAT recurrence definition.
In conclusion, no difference between SAT etiology groups has been detected in our follow-up both in clinical characteristics and in hypothyroidism or recurrence outcomes. Similarly, no difference was found between mRNA SARS-CoV-2 vaccine– and inactivated SARS-CoV-2 vaccine–related SAT cases in terms of clinical presentation, treatment modalities, and outcome parameters. In patients who require steroid treatment, the recurrence risk is increased, whereas steroid treatment appears to reduce the incidence of hypothyroidism. Thus, clinicians should follow patients closely so as not to apply a rapid reduction regimen when steroid treatment is given in severe SAT cases, and not to discontinue steroid treatment during the early period. CRP levels at disease onset may provide a clue for the disease course. In line with the previous literature, it may be useful to follow patients with anti-TPO positivity for a longer period of time for the development of permanent hypothyroidism. We suggest that the treatment and follow-up of patients diagnosed with SAT related to COVID-19 and SARS-CoV-2 vaccine is not different from classic SAT.
Acknowledgments
The authors acknowledge all physicians and health care professionals who contributed to patient data collection and treatment at each of the THYROVAC study centers. We thank Susan J. Mandel for her contribution and suggestions to our study. Preparation for publication of this article is supported by the Society of Endocrinology and Metabolism of Turkey.
Author Contributors
A.B., D.Y., and M.S. conceived the study. A.B., E.S., I.D., and N.B. managed the data and conducted the statistical analysis. All the authors collaborated in the interpretation of the results and drafting of the manuscript. A.B. and K.A. revised the manuscript and organized the final form. A.B., D.Y., O.D., and M.S. had access to, and verified, the raw data. All authors had the final responsibility for the decision to submit for publication.
Disclosures
The authors have nothing to disclose. There is no financial or non-financial conflict of interest to declar.
Data Availability
The data that support the findings of this study are available from the corresponding author, on a reasonable request.
References
Abbreviations
- ACE2
angiotensin-converting enzyme 2
- Cont-SAT
classic subacute thyroiditis
- Cov-SAT
COVID-19–related subacute thyroiditis
- CRP
C-reactive protein
- ESR
erythrocyte sedimentation rate
- FT3
free triiodothyronine
- FT4
free thyroxine
- HLA
human leukocyte antigen
- mRNA
messenger RNA
- NSAID
nonsteroidal anti-inflammatory drug
- SAT
subacute thyroiditis
- TG
thyroglobulin
- TPO
thyroid peroxidase
- TRAB
thyrotropin receptor antibody
- TSH
thyrotropin
- Vac-SAT
SARS-CoV-2 vaccine–related subacute thyroiditis
- WBC
white blood cell
