


Abstract
The evidence of whether hypothyroidism increases mortality in the elderly population is currently inconsistent and conflicting.
The objective of this meta-analysis is to determine the impact of hypothyroidism on mortality in the elderly population.
PubMed, Embase, Cochrane Library, Scopus, and Web of Science databases were searched from inception until May 10, 2019.
Studies evaluating the association between hypothyroidism and all-cause and/or cardiovascular mortality in the elderly population (ages ≥ 60 years) were eligible.
Two reviewers independently extracted data and assessed the quality of the studies. Relative risk (RR) was retrieved for synthesis. A random-effects model for meta-analyses was used.
A total of 27 cohort studies with 1 114 638 participants met the inclusion criteria. Overall, patients with hypothyroidism experienced a higher risk of all-cause mortality than those with euthyroidism (pooled RR = 1.26, 95% CI: 1.15-1.37); meanwhile, no significant difference in cardiovascular mortality was found between patients with hypothyroidism and those with euthyroidism (pooled RR = 1.10, 95% CI: 0.84-1.43). Subgroup analyses revealed that overt hypothyroidism (pooled RR = 1.10, 95% CI: 1.01-1.20) rather than subclinical hypothyroidism (pooled RR = 1.14, 95% CI: 0.92-1.41) was associated with increased all-cause mortality. The heterogeneity primarily originated from different study designs (prospective and retrospective) and geographic locations (Europe, North America, Asia, and Oceania).
Based on the current evidence, hypothyroidism is significantly associated with increased all-cause mortality instead of cardiovascular mortality among the elderly. We observed considerable heterogeneity, so caution is needed when interpreting the results. Further prospective, large-scale, high-quality studies are warranted to confirm these findings.
Hypothyroidism is defined as a deficiency in thyroid hormones and is a common disease worldwide. It can be further categorized into overt and subclinical hypothyroidism, with a prevalence of approximately 0.1% to 2% and 4% to 10%, respectively. Such prevalence is increased in women and those with advanced age (1–5).
Systemic hypometabolism associated with hypothyroidism results in numerous well-characterized metabolic changes and morbidities, such as hyperlipidemia, hypertension, and cardiovascular disease (CVD) (6–11). Hypothyroidism is also linked to high risks of cardiac mortality and all-cause mortality in the general population (11). However, in the older population, the association between hypothyroidism and mortality is far less convincing, and the current evidence is still inconsistent and conflicting. Grossman et al found that elevated serum thyrotropin is associated with increased mortality risks in the elderly (12). However, Gussekloo and colleagues indicated that increased thyrotropin levels lead to a decreased risk of cardiovascular and all-cause mortalities in elderly patients (13). However, the association between hypothyroidism and mortality risks in the elderly population was insignificant in some studies (14–18). Clinical manifestations of hypothyroidism or subclinical hypothyroidism are generally less severe in elderly patients (13, 19), and the benefit of thyroxine replacement on mortality in elderly individuals with hypothyroidism has limited evidence (20). Current clinical guidelines recommend not to routinely treat elderly patients, except those with symptoms of hypothyroidism or increased vascular risk (21, 22).
However, no meta-analysis is available to assess the association between hypothyroidism and mortality specifically for the elderly population despite the inconsistency among prior studies. Herein, we conducted a systemic review with meta-analysis focusing on the elderly population to determine whether hypothyroidism increases all-cause mortality as well as cardiovascular mortality.
Materials and Methods
Data sources and searches
We conducted the present systematic review and meta-analysis according to the PRISMA (Preferred Reporting Items for Systematic Reviews and Meta-Analyses) guidelines (23). We searched the PubMed, Embase, Cochrane Library, Scopus, and Web of Science databases for articles that have evaluated the association between hypothyroidism and mortality in the elderly population from inception until May 10, 2019. In brief, we searched for articles using a combination of the following terms: “hypothyroidism,” “thyroid,” “aged,” “elder,” “older,” and “mortality.” The details of the search strategy are shown in the supplementary materials (24). No language restriction was set. Furthermore, we examined the reference lists from the available bibliographies, review articles, and relevant meta-analyses for additional articles. The PROSPERO registration number is CRD42019131398.
Study selection and outcomes
Studies were included in the systematic review if (1) the participants were older than 60 years, (2) the outcome measurements included all-cause mortality and/or cardiovascular-related mortality with sufficient data to calculate the risk estimates comparing hypothyroidism and euthyroidism, and (3) the studies were published as original articles. We excluded animal studies or those conducted in laboratory settings. We also excluded review articles, case reports, editorials, or letters to the editor that did not report original findings. Three reviewers (T.Y.T., C.C.P., and H.K.H.) independently screened all titles and abstracts and evaluated relevant articles.
The primary outcome was all-cause mortality. The secondary outcome was cardiovascular mortality, including deaths caused by ischemic heart disease, progressive heart failure, arrhythmia, cardiac arrest, or other diseases of the circulatory system.
Data extraction and quality assessment
Data were extracted independently by 2 authors (T.Y.T. and C.C.P.) using a standardized data extraction form. Extracted data included the name of the first author, publication year, geographic location, mean/median follow-up years, study design, study population, number of participants, sex, age, categories and definitions of hypothyroidism, risk estimates, and covariates adjusted for in multivariable analyses. If the data were not readily available for analysis, we contacted the corresponding authors to obtain further information. Hypothyroidism was categorized into overt hypothyroidism and subclinical hypothyroidism as defined in the included studies; the definitions of these categories varied across studies. In general, overt hypothyroidism was defined biochemically as having a decreased free thyroxine (FT4) with elevated thyrotropin level, whereas subclinical hypothyroidism was defined as having a normal FT4 but with an elevated thyrotropin level.
The quality of these studies was assessed independently by 2 reviewers (T.Y.T. and C.C.P.) using the Newcastle–Ottawa Scale (25). Studies with a total score of 7 or more points were regarded as high-quality studies. When discrepancies arose between the 2 reviewers, another reviewer (H.K.H.) participated in the data extraction and quality assessment, and a mutually agreeable conclusion was achieved.
Data synthesis and statistical analysis
The available risk estimates that we extracted were mostly hazard ratios. However, rate ratios, incidence rate ratios, or odds ratios were also presented in some studies. The most properly adjusted estimates in the reports were used. For studies that did not report the adjusted estimates for our outcomes, we contacted the authors and requested the adjusted effect size and relevant information. If the information could still not be obtained, we calculated the crude effect sizes (crude risk ratios) and their CIs from the available data for analyses by using the website provided by MedCalc Software (https://www.medcalc.org/calc/relative_risk.php) (26). We further performed a sensitivity analysis, excluding those studies with only a crude effect size.
Between-study heterogeneity was evaluated using the I2 and τ 2 statistics (27, 28). Considering the heterogeneity of the study populations, we calculated the pooled relative risks (RRs) and their CIs using the DerSimonian and Laird random-effects model (29). The heterogeneity was considered low, moderate, and high for I2 of less than 50%, 50% to 75%, and greater than 75%, respectively. The τ 2 was interpreted in the same unit as the pooled effect (logarithm of RR).
To determine if the results of pooled estimates would be influenced by different study-level factors and to explore potential sources of heterogeneity, we conducted several predefined subgroup analyses. These subgroup analyses were conducted according to the degree of hypothyroidism (overt or subclinical), study designs (prospective or retrospective), mean age at entry, quality of studies (Newcastle–Ottawa Scale ≥ 7 or < 7 points), study population, geographic location, the proportion of women, mean follow-up years, and CVD risk at baseline. High CVD risk was defined as the baseline presence of any of the following diseases: underlying coronary, cerebral, or peripheral artery disease, cardiomyopathy, heart failure, atrial fibrillation, venous thromboembolism, diabetes mellitus, or chronic kidney disease (30). When sufficient studies (n ≥ 10) were available, meta-regressions were performed.
Potential publication bias was assessed by conducting the Egger regression asymmetry test and Begg adjusted rank correlation test (31, 32). If more than 10 studies were included in each outcome of the meta-analysis, we used a funnel plot to assess publication bias or small-study bias. We also conducted a sensitivity analysis to evaluate the influence of each study on the overall pooled estimate (by omitting each study individually). Other sensitivity analyses, such as including studies with patients aged 65 years and older and excluding those that were unavailable for adjusted estimates, were performed. All statistical tests were 2-sided, and the significance level was set at a level of 5%. All statistical analyses were performed using the statistical software package Stata, version 15.1 (StataCorp).
Results
Search results
A total of 13 923 relevant studies were identified in the initial search. After excluding duplicate studies, nonrelevant studies, and other studies that met the exclusion criteria based on a screening of article titles and abstracts, 260 potentially relevant studies were retrieved for a full review. A diagram of article selection for meta-analysis is shown in Figure 1.
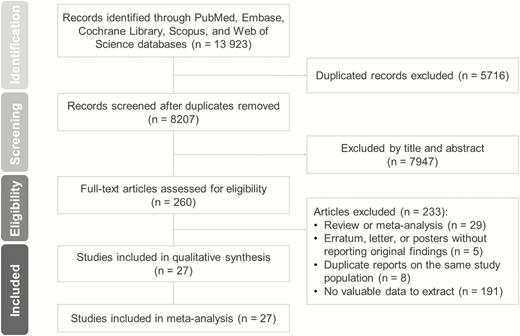
Literature search and article selection.
The Cardiovascular Health Study database was used in 3 studies conducted by Waring et al (14), Hyland and colleagues (33), and Cappola et al (34). Only the Cappola study was included in the meta-analysis because of its representative data (34), whereas the other 2 studies were excluded (14, 33).
After a careful review process, 27 published articles met all of the eligibility criteria (12, 13, 15–18, 34–54). A total of 1 114 638 participants were included in this meta-analysis. Moreover, 15 articles were prospective cohort studies, and 12 were retrospective. Further information, such as follow-up years, study design, number of participants, and degree and definition of hypothyroidism, is summarized in supplementary Table S1 (24). In addition, supplementary Tables S2 and S3 present quality assessment results by the Newcastle–Ottawa Scale, and the covariates that have been adjusted in each study, respectively (24).
Hypothyroidism and all-cause mortality
A total of 26 studies evaluated the association between hypothyroidism and all-cause mortality for the elderly population. Overall, patients with hypothyroidism experienced a higher risk of all-cause mortality than those with euthyroidism (pooled RR = 1.26, 95% CI: 1.15-1.37, P < .001), with high heterogeneity (I2 = 86.2%) (Figure 2). No evidence of publication bias was found according to the Egger test (P = .088) and the Begg test (P = .895); the funnel plot is shown in supplementary Figure S6 (24).
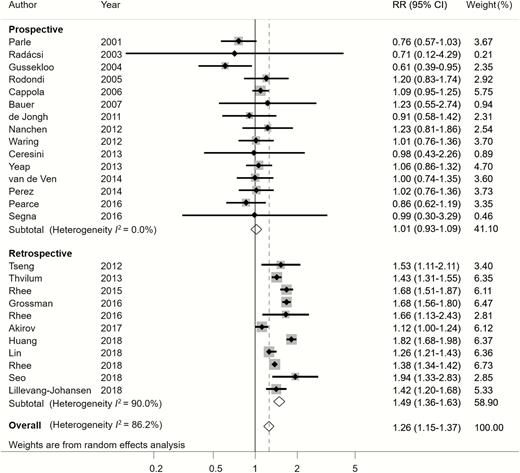
Relative risk (RR) of all-cause mortality associated with hypothyroidism compared with euthyroidism.
Subgroup analyses and sensitivity analyses for all-cause mortality
Regarding the degree of hypothyroidism, overt hypothyroidism was associated with an increased all-cause mortality (pooled RR = 1.10, 95% CI: 1.01-1.20, P = .033). However, subclinical hypothyroidism was not significantly associated with all-cause mortality (pooled RR = 1.14, 95% CI: 0.92-1.41, P = .239) (Table 1, supplementary Figures S1 and S2) (24).
Subgroup and heterogeneity analyses of pooled relative risks of all-cause mortality
| All-cause mortality | Meta-Regression | |||||
|---|---|---|---|---|---|---|
| Subgroups | No. of Studies | Pooled RR (95%CI) | P | I2 (%) | τ2 | P |
| Overall | 26 | 1.26 (1.15-1.37)b | <.001 | 86.2 | 0.055 | NA |
| Degree of hypothyroidism | 0.050 | .382 | ||||
| Subclinical hypothyroidism | 13 | 1.14 (0.92-1.41) | .239 | 93.0 | ||
| Overt hypothyroidism | 5 | 1.10 (1.01-1.20)a | .033 | 0.0 | ||
| Mixed or undefined | 16 | 1.28 (1.15-1.41)b | < .001 | 87.7 | ||
| Study design | 0.018 | < .001 | ||||
| Prospective | 15 | 1.01 (0.93-1.09) | .802 | 0.0 | ||
| Retrospective | 11 | 1.49 (1.36-1.63)b | < .001 | 90.0 | ||
| Risk of bias | 0.058 | .503 | ||||
| Newcastle–Ottawa Scale ≥ 7 | 16 | 1.23 (1.10-1.36)b | < .001 | 88.8 | ||
| Newcastle–Ottawa Scale < 7 | 10 | 1.30 (1.12-1.53)b | .001 | 78.6 | ||
| Study population | 0.059 | .715 | ||||
| Population-based | 18 | 1.25 (1.13-1.37)b | < .001 | 86.3 | ||
| Convenience sample | 8 | 1.27 (1.01-1.60)a | .039 | 87.7 | ||
| Mean age at entry, y | 0.042 | .013 | ||||
| 60-79 | 24 | 1.30 (1.20-1.41)b | < .001 | 85.6 | ||
| ≥ 80 | 2 | 0.75 (0.54-1.04) | .087 | 33.9 | ||
| Geographic location | 0.048 | .032 | ||||
| Europe | 12 | 1.02 (0.85-1.23) | .819 | 75.3 | ||
| North America | 7 | 1.33 (1.15-1.52)b | < .001 | 80.0 | ||
| Asia | 6 | 1.50 (1.25-1.80)b | < .001 | 93.7 | ||
| Oceania | 1 | 1.06 (0.86-1.31) | .594 | NA | ||
| Proportion of women (%) | 0.059 | .812 | ||||
| ≥ 50 | 18 | 1.23 (1.09-1.39)b | .001 | 88.3 | ||
| < 50 | 8 | 1.27 (1.10-1.47)b | .001 | 80.0 | ||
| Mean follow-up, y | 0.059 | .845 | ||||
| ≥ 5 | 15 | 1.25 (1.13-1.39)b | < .001 | 88.6 | ||
| < 5 | 11 | 1.26 (1.07-1.47)b | .005 | 80.4 | ||
| Baseline CVD risk | 0.053 | .128 | ||||
| Low CVD risk | 18 | 1.16 (1.02-1.32)b | .028 | 88.9 | ||
| High CVD risk | 8 | 1.40 (1.26-1.56)b | < .001 | 73.4 | ||
Pooled RR greater than 1 indicates hypothyroidism is associated with higher mortality than euthyroidism.
Abbreviations: CVD, cardiovascular disease; NA, not applicable; RR, relative risk.
aP < .05. bP < .01.
Subgroup analyses found that the large heterogeneity was partially related to study design. Notably, the subgroup of 15 studies with a prospective design was less heterogeneous (I2 = 0%), whereas the other 11 studies with a retrospective design remained highly heterogeneous (I2 = 90%) (Figure 2). Hypothyroidism was significantly associated with increased all-cause mortality in retrospective studies, but significant association was not observed in prospective studies (Figure 2). Interestingly, results according to different continents were inconsistent. In the subgroups from North America and Asia, patients with hypothyroidism were significantly associated with high all-cause mortality risk compared with those with euthyroidism; such a significant association was not found in European and Oceania subgroups (Figure 3). Moreover, studies that included only patients aged 80 years and older showed no significant association between hypothyroidism and all-cause mortality (Table 1).
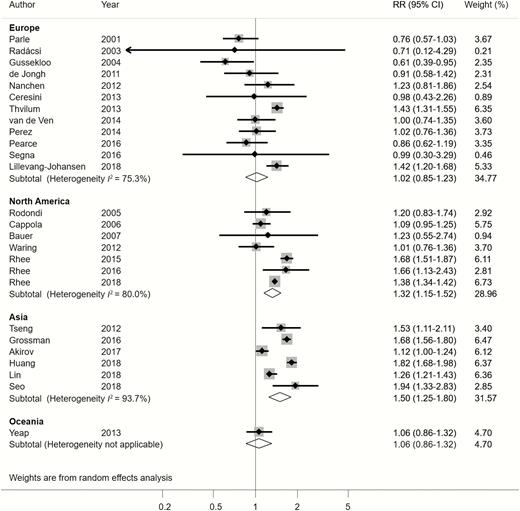
Relative risk (RR) of all-cause mortality associated with hypothyroidism according to subgroups of different geographic locations.
The meta-regression revealed that the study design explained 68% of the between-study variance (P < .001), geographic location explained 12% (P = .032), and mean age at entry explained 25% (P = .013). Detailed results of all subgroup analyses and meta-regression are shown in Table 1.
We performed sensitivity analyses after omitting each study one at a time, and the pooled RR was robust with few changes (supplementary Figure S4) (24). Additionally, the sensitivity analyses, which included only studies with patients aged 65 years and older and excluded those with unavailable adjusted estimates, gave results similar to those of our primary analysis (supplementary Table S4) (24).
Hypothyroidism and cardiovascular mortality
Twelve studies evaluated the association of hypothyroidism and cardiovascular mortality. Overall, no significant difference in cardiovascular mortality risk was observed between patients with hypothyroidism and those with euthyroidism (RR of 1.10, 95% CI: 0.84-1.43, P = .492), with moderate heterogeneity (I2 = 73.6%) (Figure 4). The Egger test (P = .01) indicated a possible small-study bias. Whereas in most meta-analyses small studies tend to report larger and more significant results, the funnel plot and Egger test suggested that studies with small size in this meta-analysis tended to report small, nonsignificant results (supplementary Figure S7) (24). Nevertheless, the trim and fill test did not suggest exclusion or imputation of any study. Therefore, the small-study bias toward a potential underestimation of the hypothyroidism effect on cardiovascular mortality needs to be interpreted cautiously.
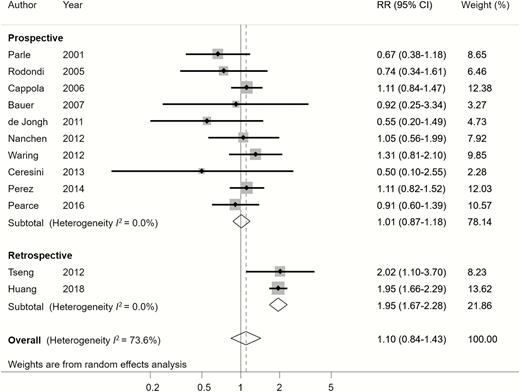
Relative risk (RR) of cardiovascular mortality associated with hypothyroidism compared with euthyroidism.
Subgroup analyses and sensitivity analyses for cardiovascular mortality
Cardiovascular mortality did not increase either in the overt hypothyroidism or subclinical hypothyroidism subgroup (Table 2 and supplementary Figure S3) (24).
Subgroup and heterogeneity analyses of pooled relative risks of cardiovascular mortality
| Cardiovascular Mortality | Meta-Regression | |||||
|---|---|---|---|---|---|---|
| Subgroups | No. of Studies | Pooled RR (95%CI) | P | I2 (%) | τ2 | P |
| Overall | 12 | 1.10 (0.84-1.43) | .492 | 73.6 | 0.094 | NA |
| Degree of hypothyroidism | 0.082 | .878 | ||||
| Subclinical hypothyroidism | 7 | 1.14 (0.89-1.46) | .301 | 24.9 | ||
| Overt hypothyroidism | 1 | 0.97 (0.49-1.92) | NA | NA | ||
| Mixed or undefined | 6 | 1.11(0.77-1.60) | .564 | 84.2 | ||
| Study design | 0 | < .001 | ||||
| Prospective | 10 | 1.01 (0.87-1.18) | .864 | 0.0 | ||
| Retrospective | 2 | 1.96 (1.67-2.28)b | < .001 | 0.0 | ||
| Risk of bias | 0.102 | .534 | ||||
| Newcastle–Ottawa Scale ≥ 7 | 10 | 1.14 (0.84-1.54) | .412 | 74.7 | ||
| Newcastle–Ottawa Scale < 7 | 2 | 0.93 (0.51-1.69) | .801 | 41.7 | ||
| Study population | 0.110 | .945 | ||||
| Population-based | 10 | 1.09 (0.79-1.50) | .617 | 76.4 | ||
| Convenience sample | 2 | 1.10 (0.83-1.45) | .508 | 0.0 | ||
| Mean age at entry, y | 0.102 | .595 | ||||
| 60-79 | 11 | 1.12 (0.85-1.49) | .422 | 73.3 | ||
| ≥ 80 | 1 | 0.91 (0.60-1.39) | .660 | NA | ||
| Geographic location | 0.004 | < .001 | ||||
| Europe | 6 | 0.94 (0.76-1.16) | .563 | 0.0 | ||
| North America | 4 | 1.11 (0.88-1.39) | .377 | 0.0 | ||
| Asia | 2 | 1.96 (1.67-2.28)b | < .001 | 0.0 | ||
| Oceania | NA | NA | ||||
| Proportion of women (%) | 0.114 | .758 | ||||
| ≥50 | 10 | 1.05 (0.75-1.47) | .765 | 76.9 | ||
| <50 | 2 | 1.17 (0.90-1.51) | .248 | 0.0 | ||
| Mean follow-up, y | 0.102 | .610 | ||||
| ≥ 5 | 9 | 1.13 (0.81-1.58) | .485 | 77.3 | ||
| < 5 | 3 | 1.05 (0.81-1.36) | .713 | 0.0 | ||
| Baseline CVD risk | 0.110 | .945 | ||||
| Low CVD risk | 10 | 1.09 (0.79-1.50) | .617 | 76.4 | ||
| High CVD risk | 2 | 1.10 (0.83-1.45) | .508 | 0.0 | ||
Pooled RR greater than 1 indicates hypothyroidism is associated with higher mortality than euthyroidism.
Abbreviations: CVD, cardiovascular disease; NA, not applicable; RR, relative risk.
bP < .01.
Subgroup analyses found that the different study designs and geographic locations were possible sources of heterogeneity. Heterogeneity substantially decreased after dividing studies into prospective and retrospective study designs (I2 = 0% for both subgroups) (Figure 4). Hypothyroidism was significantly associated with high cardiovascular mortality in the retrospective study subgroup, but such an association was not observed in the prospective study subgroup (Figure 4). Moreover, heterogeneity decreased after subgrouping the studies according to geographic locations (I2 = 0% for each location subgroup, including Europe, North America, and Asia) (Figure 5). Studies from Asia showed that hypothyroidism was significantly associated with high cardiovascular mortality; such an association was not found in studies from Europe and North America. In addition, meta-regression revealed that the study design and geographic location accounted for between-study variance (P < .001). The other subgroup analyses for cardiovascular mortality did not reveal significant association between hypothyroidism and cardiovascular mortality (Table 2).

Relative risk (RR) of cardiovascular mortality associated with hypothyroidism according to subgroups of different geographic locations.
The pooled result in the sensitivity analysis that omits each study at a time was robust (supplementary Figure S5) (24). The sensitivity analyses of studies with patients aged 65 years and older and studies with only adjusted estimates revealed similar results (supplementary Table S4) (24).
Discussion
To our knowledge, this meta-analysis is the first to evaluate the association between hypothyroidism and mortality specifically focusing on the elderly population, thereby addressing the current knowledge gap. In this large-scale meta-analysis with 1 114 638 participants from 27 cohort studies, we found that hypothyroidism increased all-cause mortality by 26% in the elderly population of individuals aged 60 years and older. The subgroup analyses revealed that compared with patients with euthyroidism, higher all-cause mortality was observed only in those with overt hypothyroidism, but not in those with subclinical hypothyroidism. Meanwhile, hypothyroidism was not significantly associated with cardiovascular mortality. Meta-regression found that the heterogeneity was partly explained by different study designs and geographic locations. A significantly increased risk of all-cause mortality was found in retrospective studies but not in prospective studies and in those from Asia and North America.
Although previous studies have proposed underlying mechanisms of the association between hypothyroidism and mortality (55), the controversy remains. Subclinical hypothyroidism and overt hypothyroidism are both associated with numerous well-characterized comorbidities, such as dyslipidemia, CVD, and coagulopathy. These effects are in general associated with increased morbidity and could contribute to increased mortality (55). Meanwhile, low metabolic rate is related to increased survival in several species, including humans (56). Moreover, caloric restriction is associated with prolonged life (57–59). Thus, mortality may be decreased by hypothyroidism due to a low metabolic rate and low caloric intake (13). To date, the evidence for the association between hypothyroidism and mortality has remained inconsistent for elderly individuals. Some studies indicated increased mortality in the elderly with hypothyroidism (12, 35, 39–42, 44–47, 50, 51, 53, 54), whereas another study obtained a contrasting result (13). Furthermore, other studies have found no significant association between hypothyroidism and mortality (15–18, 34, 36–38, 43, 48, 49, 52). A previous meta-analysis based on observational studies revealed that patients with hypothyroidism had a higher risk of all-cause mortality and cardiac mortality than those with euthyroidism (11). However, that meta-analysis focused on the general population and not specifically on the elderly (11). Another previous meta-analysis focused merely on subclinical hypothyroidism and revealed that subclinical hypothyroidism was associated with increased all-cause mortality risk in an all-age population (30). That study’s subgroup analysis did not find such a significant association after pooling the studies with a mean age of 65 years and older. However, such meta-analyses used the mean age provided in various studies to classify the age subgroups (11, 30). Hence, a considerable proportion of young patients would still be included in their old-age subgroup. The current evidence suggested that the association between hypothyroidism and higher mortality in the younger population was more certain and convincing (11); therefore, including some younger patients in an analysis specifically targeting an elderly population might give inaccurate results for an elderly population.
Our meta-analysis, which specifically evaluated a pure elderly population (aged > 60 years), should provide more convincing results specifically for the elderly population. Additionally, along with the aforementioned studies in the meta-analysis (11, 30), we further pooled several recently published studies (41, 42, 44, 47, 50, 53) to update and increase the evidence on this issue in an elderly population. Several subgroup analyses and meta-regressions were also performed to identify and explain the sources of heterogeneity among studies that had not been specifically conducted in elderly populations previously. Furthermore, we not only evaluated overall hypothyroidism but also overt and subclinical hypothyroidism individually in our subgroup analyses. The significant association between hypothyroidism and increased all-cause mortality was found in patients with overt hypothyroidism. However, we found no evidence that subclinical hypothyroidism is associated both with all-cause and cardiovascular mortality. This finding supported the current consensus that recommends not to routinely treat elderly patients with subclinical hypothyroidism (21, 22). However, the heterogeneity of the studies that evaluated the association between subclinical hypothyroidism and mortality remained high. The definition of subclinical hypothyroidism also differed among studies. This heterogeneity and inconsistency may have biased the results and contributed to a nonsignificant association between subclinical hypothyroidism and mortality, which prevents drawing a definite conclusion on this issue. Further studies are still needed to accurately determine the effect of subclinical hypothyroidism on mortality.
The prevalence of hypothyroidism and hypothyroidism-related mortalities differed between races (60, 61). The most common etiology of subclinical hypothyroidism is chronic autoimmune thyroiditis (62). Higher prevalence of hypothyroidism and autoimmune thyroiditis has been reported in populations with higher than the required iodine intake (63, 64), whereas lower prevalence has been reported in areas deficient in iodine (65). Interestingly, our subgroup analyses revealed that the pooled results differed between geographic location subgroups, which may be related to different iodine intake. The significantly higher all-cause mortality in patients with hypothyroidism was found in North America and Asia but not in Europe and Oceania. Furthermore, higher cardiovascular mortality was observed only in Asian studies. In the North American group, all the included studies were conducted in the United States. The general US population has more than the required iodine intake (66). In a recent large, observational study using the National Health and Nutrition Examination Survey in the United States, the population with high iodine intake was associated with significantly higher all-cause and cardiovascular mortalities when compared with the population with adequate iodine intake (67). These results are consistent with our findings. Europe comprises several countries that vary in their iodine intake levels, according to the World Health Organization report (66). The best example was reported by Laurberg et al demonstrating different patterns of thyroid disorders in Iceland (with high iodine intake) and in East-Jutland Denmark (with low iodine intake) (68). The heterogeneity in iodine intake within Europe probably can explain why hypothyroidism was not associated with either increased all-cause or cardiovascular mortalities. The Asian group comprises studies from Taiwan and Korea, where national or subnational iodine statuses are more than the required level (66). However, the reported iodine status results in Israel are conflicting (69, 70). The 2 studies from Taiwan had very large sample sizes and were therefore assigned very large weights in the Asian group (42, 44). This possibly explains why hypothyroidism was associated with higher all-cause and cardiovascular mortalities in the Asian group. Further studies are necessary to confirm such a hypothesis for the different associations across geographical areas and to investigate the underlying mechanisms.
Our subgroup analyses that pooled data from 15 prospective-design studies showed minimal between-study heterogeneity (I2 = 0%) and indicated no significant association between hypothyroidism and all-cause mortality. Such minimal heterogeneity (I2 = 0%) was also found for cardiovascular mortality among 10 prospective-design studies. Moreover, both in the overt and subclinical hypothyroidism subgroups, heterogeneity was minimal among the prospective studies (I2 = 0%). Of note, the significant association between hypothyroidism and higher mortality was found only in the retrospective study subgroup, not in the prospective study subgroup. Previous evidence has suggested that measurements collected prospectively might be more accurate and consistent than those collected retrospectively (71–73). Additionally, a prospective cohort study design may provide evidence more similar to that obtained from randomized controlled trials (74). Generally, the major strength of a prospective cohort study is the accuracy of data collection regarding exposures, confounders, and end points. On the other hand, retrospective studies take less time to complete and have lower costs; however, researchers have no choice other than to work with what has been measured in the past, often for another purpose (eg, patient care or insurance reimbursement), and thus, some important information may be unavailable from existing data (71–73). For instance, in this present meta-analysis, some retrospective studies used only diagnostic codes (eg, International Classification of Diseases [ICD]-8, ICD-9, or ICD-10 codes) to identify and define the hypothyroidism diagnosis (42, 44, 51), without obtaining the detailed data of thyroid function tests (in contrast, all studies with prospective designs had obtained data from thyroid function tests for each participant). These differences may have influenced the study quality and may also be related to outcome discrepancies. However, there are still some factors that may confound the subgroup effect of different study designs we observed. We recognize that most of the Asian studies were retrospective designs (12, 41, 42, 44, 50, 54), and thus, Asian studies account for the highest proportion of studies in the retrospective study subgroup. Additionally, most of the studies in the retrospective subgroup were published more recently than those in the prospective subgroup. Although there is no well-known evidence explaining how discrepancies may be caused by when the study was conducted, it is hard to rule out the possibility that differences in study years might have partially contributed to the observed discrepancy in the subgroup analyses of the prospective and retrospective designs. Therefore, unfortunately, based on the currently available evidence, we could not confirm whether the subgroup effect of study design (prospective vs retrospective) was truly because of the design itself or was confounded by the other factors mentioned above. Considering that randomized controlled trials were unavailable to evaluate this issue, further large-scale, well-designed, prospective, observational studies are still needed to evaluate and confirm the exact association between hypothyroidism and mortality.
The main strengths of this meta-analysis are its large-scale design, which consisted of multiple studies and large study-sample sizes. However, it also has some limitations. First, although most of the studies measured thyrotropin and FT4 levels, the cutoff values for defining overt or subclinical hypothyroidism varied between studies. Further, some studies did not even obtain data related to the thyroid function test because claims-based data were used instead. Thus, such studies could not distinguish subclinical hypothyroidism from overt hypothyroidism by merely using the ICD codes (21) and could not be pooled to evaluate the effects of overt and subclinical hypothyroidism separately on mortality in the elderly. Second, although the heterogeneity could be partially explained by different study designs, explanations of the discrepancies between different study design subgroups are insufficient. The subgroup effect of study design we observed may also have been confounded by other factors, as discussed above. Thus, caution should be exercised when interpreting our findings from this subgroup analysis. Third, our meta-analysis did not demonstrate an association between hypothyroidism and cardiovascular mortality. However, our target population was elderly patients, and there is a higher prevalence of death from any cause in the elderly than in younger populations. Thus, the existence of competing risks (the other causes of mortality instead of cardiovascular mortality) is a substantial concern and may have caused bias. Fourth, although we predominantly obtained the effect size from the results of multivariable models with adjusting confounders, the adjusted covariates differed between the studies. Some unknown or unmeasured confounders also may have existed because of the observational design. Moreover, because the adjusted estimates were not available in some studies (summary in supplementary Table S4) (24), their crude RR was used for data synthesis, which may suffer confounding bias. However, the sensitivity analyses that excluded studies with unavailable adjusted estimates showed similar results as our primary analysis, thereby suggesting our study findings are robust.
Conclusion
This systemic review and meta-analysis showed that hypothyroidism is significantly associated with higher all-cause mortality in the elderly population, but not with cardiovascular mortality. The subgroup analyses revealed that increased all-cause mortality is observed solely in patients with overt hypothyroidism and not in those with subclinical hypothyroidism. Additionally, the pooled results also vary between studies with different designs and geographic locations. Owing to the between-study heterogeneity, these study results should be interpreted cautiously, and further prospective, large-scale high-quality studies are necessary to confirm our findings.
Abbreviations
Acknowledgments
We thank Carrie Price, MLS, at Johns Hopkins University for her expert reference search.
Financial Support: The authors received no specific funding.
Author Contributions: Study conception and design: Tu-Yuan Tsai, Carol Chiung-Hui Peng, and Huei-Kai Huang. Acquisition of data: Tou-Yuan Tsai, Carol Chiung-Hui Peng, and Huei-Kai Huang. Analysis and interpretation of data: Tou-Yuan Tsai, Yu-Kang Tu, Carol Chiung-Hui Peng, and Huei-Kai Huang. Preparation of manuscript: Tou-Yuan Tsai, Yu-Kang Tu, Carol Chiung-Hui Peng, and Huei-Kai Huang. Critical revisions: Tou-Yuan Tsai, Yu-Kang Tu, Kashif M. Munir, Shu-Man Lin, Rachel Huai-En Chang, Sheng-Lun Kao, Ching-Hui Loh, Carol Chiung-Hui Peng, and Huei-Kai Huang. All authors have read and approved the final version of the manuscript for publication.
Additional Information
Disclosure Summary: The authors have nothing to disclose.
Data Availability: Data sharing is not applicable to this article as no datasets were generated or analyzed during the current study.
Sponsor’s Role: The sponsor had no role in conducting the research.
Ethical Approval: The institutional review board of Dalin Tzu Chi Hospital, Buddhist Tzu Chi Medical Foundation, Taiwan, approved the protocol.
References
Author notes
These authors contributed equally to this work.
