


Abstract
Gynecomastia (defined by proliferation of glandular elements) and pseudogynecomastia (defined by adipose tissue) are frequent in pubertal boys. An association with sex hormones and the growth hormone axis has been discussed.
The objective of this work is to compare sex hormones, insulin-like growth factor 1 (IGF-1), and insulin-like growth factor binding protein 3 (IGFBP-3) between boys with gynecomastia and pseudogynecomastia (separation by ultrasound).
An observational study was performed.
The setting of this study was an outpatient clinic.
A total of 124 pubertal boys (mean age 14 ± 2 years) with breast enlargement and 84 healthy boys (mean age 14 ± 2 years) without breast enlargement participated in this study.
No interventions were performed.
Measurements were taken for sex hormones (progesterone, estradiol [E2], estriol, estrone, androstendione, testosterone [T], dihydrotestosterone) measured by liquid chromatography–tandem mass spectrometry, as well as gonadotropins, prolactin, IGF-1, and IGFBP-3.
Eighty-six boys suffered from gynecomastia and 38 from pseudogynecomastia. In boys with gynecomastia, the E2/T ratio (median 22, interquartile range [IQR] 8-75) was significantly (P < .05) higher compared to boys with pseudogynecomastia (median 12, IQR 5-21) or healthy controls without breast enlargement (median 18, IQR 6-44) even after adjustment for testes volume. T concentrations were significantly (P < .05) lower in boys with gynecomastia (median 1.8, IQR 0.7-4.2 nM/L) compared to boys with pseudogynecomastia (median 4.3, IQR 1.4-6.9 nM/L) or healthy controls without breast enlargement (median 3.1, IQR 0.6-7.6 nM/L). Boys with gynecomastia did not differ from boys with pseudogynecomastia according to other sex hormones, prolactin, IGF-1, or IGFBP-3 concentrations.
True gynecomastia is characterized by a relative T deficiency to E2 concentrations in contrast to pseudogynecomastia.
Physiological gynecomastia is a common, usually self-limiting, condition affecting 20% to 70% of pubertal boys (1-8). The onset of gynecomastia occurs usually at around age 13 years at Tanner stage of genital or pubes development 3 to 4 (1, 4, 5, 9-11), which is characterized by an increase of sex hormones. True gynecomastia is defined as a benign glandular proliferation in the male breast and has to be differentiated from pseudogynecomastia (a proliferation of adipose rather than glandular tissue), which is commonly seen in obese males (1). The two forms can be differentiated by ultrasound (12).
The etiology of pubertal gynecomastia is discussed to be an imbalance in the estrogen to androgen ratio (in particular estradiol to testosterone ratio [E2/T]) favoring estrogen, because gynecomastia is observed in disorders known to influence this E2/T balance, like Klinefelter syndrome (47,XXY), partial androgen insensitivity syndrome (13), and aromatase excess syndrome (14). However, the findings of imbalances in sex steroids in boys with gynecomastia are controversial in the literature (6-8, 11, 15, 16). This might be because previous studies did not differentiate between pseudogynecomastia and true gynecomastia. Furthermore, sex hormones were measured with radioimmune assays in the majority of these studies. This has been shown to be less accurate in measuring androgens or estrogens at low levels compared to liquid chromatography–mass spectrometry (LC-MS)-based methods (17).
In addition, the growth hormone (GH)/insulin-like growth factor 1 (IGF-1) axis has been postulated to be involved in gynecomastia because peak height velocity and gynecomastia occur during a similar period of life, suggesting a relationship between them (5). IGF-1 and GH reach maximum levels at Tanner stage 3 to 4 (5). IGF-1 is postulated to stimulate breast tissue proliferation through its receptors located in breast tissue (5). Furthermore, higher levels of IGF-1 have been reported by one research group in boys with gynecomastia compared to controls (5, 7). However, there are no confirming studies.
As only contradicting data exist on sex hormones and only scarce data on IGF-1 in pubertal boys with breast enlargement, we analyzed gonadotropins, IGF-1, insulin-like growth factor binding protein 3 (IGFBP-3), and a comprehensive serum profile of sex steroid hormones and their precursors, using a liquid chromatography–tandem mass spectrometry (LC-MS/MS) steroid profiling method (18). The new aspect of our study is separating boys with gynecomastia from boys with pseudogynecomastia. We hypothesized that the relationship between estrogens and androgens differs between boys with gynecomastia, pseudogynecomastia, and healthy boys without breast enlargement.
Methods
This study was approved by the local ethics committee of the Vestische Kinder- und Jugendklinik, University of Witten/Herdecke in Germany. Written informed consent was obtained from all boys and parents of the participants.
All boys presenting with breast enlargement at the Vestische Kinder- und Jugendklinik Datteln, University of Witten Herdecke in the time period between January 10, 2013 and February 5, 2019 were included in this study. Boys with gynecomastia due to syndromes (eg, Klinefelter syndrome) or disorders of sexual development or taking any medication were excluded from the study.
As reference cohort for sex hormone metabolism, a cohort of 84 healthy boys of similar age without breast enlargement and known Tanner stages was used, which has been published earlier (19). Anonymized leftover samples from blood checks before minor surgery (eg, inguinal hernia repair, circumcision, tonsillectomy) or for exclusion of endocrine and other diseases (eg, presumed growth disorder or presumed hypothyroidism) were used. The participants had no active signs of endocrine or systemic disease (including absence of gynecomastia) and were not on medication.
Measurements
We analyzed pubertal stage, height, weight, breast diameter on each side, and serum sex steroid hormones (progesterone, E2, estriol, estrone [E1], androstendione, testosterone [T], and 5-dihydrotestosterone [DHT]) in boys with breast enlargement and in normal-weight, healthy boys without breast enlargement. Gonadotropins, prolactin, IGF-1, and IGFBP-3 were determined in the 124 boys with breast enlargement.
Height was measured to the nearest millimeter using a rigid stadiometer. Weight was measured unclothed to the nearest 0.1 kg using a calibrated balance scale. Body mass index (BMI) was calculated as weight in kilograms (kg) divided by the square of height in meters (m2). The degree of overweight was quantified using Cole’s least mean square method, which normalized the BMI skewed distribution and expressed BMI as an SD score (BMI-SDS) (20). Reference data for German boys were used (21). Obesity was defined by a BMI greater than the 97th percentile according to the definition of the International Obesity Task Force (22).
Pubertal stage was determined according to Marshall and Tanner (23), and testes volumes were evaluated by palpation performed by 2 experienced pediatric endocrinologists. The interobserver variability was 3%. The diameter of breast enlargement on each site was measured in centimeters.
Ultrasound measurements were performed by one well-trained investigator using a transportable Siemens Logic E ultrasound system with a 12-MHz linear transducer. Adipose tissue is characterized in the ultrasound as hypoechoic or anechoic, whereas ultrasound signs of breast tissues are retroareolar ovoid hyperechoic tissue and branched duct development flame-shaped with finger-like extensions into the surrounding tissue presenting as central hypoechoic star-shaped areas encircled by a hyperechoic peripheral rim (12, 24-26). If any sign of breast tissue was detected in ultrasound, the boy was classified as having true gynecomastia even if there were also hints of adipose tissue.
Except estrogens, all sex hormones were determined in a parallel assay by LC-MS/MS as previously described (18). In brief, 0.1 mL serum was extracted using Oasis SPE system (Waters). The steroid measurements were carried out using an UPLC Quattro Premier/Xe system (Waters). Estrogens were determined in a separate LC-MS/MS assay using the same UPLC Quattro Premier/Xe system. Intra-assay and interassay coefficients of variation (CVs) were less than 5% for all measurements.
Concentrations of gonadotropins (luteinizing hormone [LH] and follicle-stimulating hormone [FSH]) were determined by high-specific chemiluminescence-immunoassays (ADVIA, Immulite, intra-assay and interassay CV < 5%, sensitivity 0.1 IU/L). IGF-1 and IGFBP-3 concentrations were measured with high-specific chemiluminescence immunoassays (IGF-1-, IGFBP-3- Immulite 2000, Siemens Healthcare Diagnostics) without any cross-reactions to proinsulin, insulin, and IGF-2. Prolactin was determined by a commercial enzyme-linked immunosorbent assay (Astra Biotech GmbH). The normal range is less than 25 ng/mL for boys in the analyzed age range. Intra-assay and interassay CVs were less than 10% in all methods.
To interpret the relationship between E2 and T, we calculated the E2 to T ratio also as an indirect parameter of aromatase activity.
To account for possible different pubertal development, we matched boys with gynecomastia to boys with pseudogynecomastia according to testes volumes and age. The matching process was performed as follows: Of all boys in the pseudogynecomastia group with the same testes volume, the boy with the age that was most similar to the age of the respective boy with true gynecomastia was chosen to make a matched pair.
Statistics
Statistical analyses were performed using the Winstat software package (R. Fitch Software). Normal distribution was tested by the Kolmogorov-Smirnov test. To compare variables, Fisher exact test, student t test for unpaired observations, Mann-Whitney U test, and Kruskal-Wallis test were used as appropriate. A P value less than .05 was considered significant. Data were presented as mean and SD for normally distributed variables or as median and interquartile range (IQR) for not normally distributed variables.
Results
A total of 128 boys with breast enlargement were identified. Four boys were excluded for Klinefelter syndrome (n = 2), Bardet-Biedl syndrome (n = 1), or medication (n = 1: GH treatment). A total of 124 boys with breast enlargement were included in this study. According to ultrasound, 86 boys suffered from bilateral gynecomastia and 38 from bilateral pseudogynecomastia (Table 1).
Comparison of boys with gynecomastia, pseudogynecomastia, and healthy boys without breast enlargement
| I Gynecomastia | II Pseudogynecomastia | III Healthy Controls | P Overall | P I vs III | P II vs III | P I vs II | |
|---|---|---|---|---|---|---|---|
| No. | 86 | 38 | 84 | ||||
| Age, y | 13.8 ± 2.1 | 13.9 ± 2.0 | 13.7 ± 2.4 | NS | NS | NS | NS |
| BMI-SDS | 0.91 ± 1.18 | 1.91 ± 0.68 | 0.73 ± 0.33 | < .001 | NS | < .001 | < .001 |
| Obese | 42% | 86% | 0% | < .001 | < .001 | < .001 | < .001 |
| Breast diameter left, cm | 9.7 ± 7.2 | 14.9 ± 6.5 | – | < .001 | < .001 | < .001 | .001 |
| Breast diameter right, cm | 9.9 ± 7.1 | 14.3 ± 7.3 | – | < .001 | < .001 | < .001 | .006 |
| Testis volume right, mL | 8.7 ± 5.4 | 11.4 ± 6.3 | ND | – | – | – | .038 |
| Testis volume left, mL | 9.0 ± 5.3 | 11.5 ± 6.2 | ND | – | – | – | .043 |
| Tanner stage P | 3.3 ± 1.6 | 4.0 ± 1.3 | 3.3 ± 1.4 | .042 | NS | NS | .019 |
| LH, mU/mL | 3.3 ± 1.8 | 3.7 ± 2.6 | ND | – | – | – | .017 |
| FSH, mU/mL | 3.2 ± 2.7 | 3.4 ± 2.4 | ND | – | – | – | NS |
| E1, pM/L | 20 (11-47) | 20 (11-57) | 10 (10-33) | < .001 | < .001 | < .001 | NS |
| E2, pM/L | 39 (20-70) | 31 (11-77) | 41 (10-77) | NS | NS | NS | NS |
| E3, pM/L | 10 (10-10) | 10 (10-10) | 10 (10-10) | NS | NS | NS | NS |
| E2/T | 22 (8-75) | 12 (5-21) | 18 (6-44) | .010 | .040 | NS | .006 |
| DHT, nM/L | 0.13 (0.02-0.38) | 0.18 (0.05-0.32) | 0.41 (0.22-0.66) | < .001 | < .001 | < .001 | NS |
| A, nM/L | 1.1 (0.7-1.8) | 1.5 (1.0-1.8) | 1.1 (0.6-1.8) | NS | NS | NS | NS |
| T, nM/L | 1.8 (0.7-4.2) | 4.3 (1.4-6.9) | 3.1 (0.6-7.6) | .025 | .042 | NS | .010 |
| Progesterone, nM/L | 0.20 (0.08-0.32) | 0.17 (0.07-0.34) | 0.19 (0.10-0.36) | NS | NS | NS | NS |
Data as mean ± SD or as median and interquartile range when variable was not normally distributed; P values derived from U test (not normally distributed variables), from unpaired t test (normally distributed variables), or from Kruskal-Wallis test as appropriate. Significant differences are plotted in bold.
Abbreviations: A, androstenedione; BMI-SDS, body mass index as standard deviation score; DHT, 5-dihydrotestosterone; E1, estrone; E2, estradiol; E2/T, estradiol to testosterone ratio; FSH, follicle-stimulating hormone; LH, luteinizing hormone; ND, not determined; NS, not significant; T, testosterone.
The obese boys with breast enlargement had significantly (P < .001) less frequently true gynecomastia (58%) compared to nonobese boys with breast enlargement (91% true gynecomastia). The boys with true gynecomastia did not differ in their weight status as BMI-SDS from controls (Table 1).
Comparing the boys with true gynecomastia and pseudogynecomastia showed that boys with pseudogynecomastia were heavier and had larger breast enlargement (Table 1). The E2/T ratio was significantly higher in boys with gynecomastia compared to boys with pseudogynecomastia or healthy boys (Fig. 1). The T concentrations of boys with gynecomastia were significantly lower compared to those of boys with pseudogynecomastia or healthy boys (Table 1). Boys with gynecomastia and pseudogynecomastia had significantly higher E1 and lower DHT concentrations compared to healthy boys (Table 1). All other sex hormones did not differ significantly (Table 1). LH was significantly lower in boys with gynecomastia compared to boys with pseudogynecomastia (Table 1).
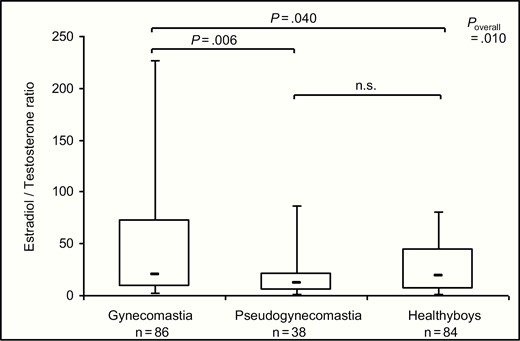
The estradiol (E2) to testosterone (T) ratio in boys with gynecomastia, pseudogynecomastia, and healthy controls without breast enlargement (data as box plots representing 5th, 25th, 50th, 75th, and 95th percentile, P value derived from Mann-Whitney U test for individual comparisons and from Kruskal-Wallis for overall comparison). n.s., not significant.
The prolactin concentrations were always in the normal range in boys with gynecomastia (median 9.3 [IQR 7.0-16.2] ng/mL) and in boys with pseudogynecomastia (median 10.3 [IQR 8.0-14.3] ng/mL) and did not differ significantly between the boys with gynecomastia and the boys with pseudogynecomastia. The IGF-1 (gynecomastia: mean 306 ± 112 ng/mL; pseudogynecomastia: mean 332 ± 97 ng/mL) and IGFBP-3 (gynecomastia: mean 5.2 ± 1.3 µg/mL; pseudogynecomastia: 5.5 ± 0.8 µg/mL) concentrations were in the normal range and did not differ significantly between boys with gynecomastia and pseudogynecomastia.
Because the boys with pseudogynecomastia and gynecomastia differed in their LH levels and testes volumes despite being of similar age (Table 1), we matched the boys with gynecomastia and pseudogynecomastia according to their testes volumes. In this matched comparison (Table 2), the gonadotropin levels were significantly lower and the E2/T ratio was significant higher in boys with gynecomastia compared to boys with pseudogynecomastia. All other sex hormones and the concentrations of IGF-1, IGFBP-3, and prolactin did not differ significantly.
Comparison of boys with gynecomastia and pseudogynecomastia matched for testes volumes and age
| Gynecomastia | Pseudogynecomastia | P | |
|---|---|---|---|
| No. | 29 | 29 | |
| Age, y | 14.0 ± 2.0 | 14.1 ± 2.0 | NS |
| BMI | 24.5 ± 5.8 | 31.0 ± 7.9 | < .001 |
| BMI-SDS | 0.93 ± 1.04 | 1.87 ± 0.66 | < .001 |
| Obese, % | 41 | 86 | < .001 |
| Breast diameter left, cm | 9.6 ± 7.4 | 14.4 ± 7.0 | .023 |
| Breast diameter right, cm | 9.9 ± 7.4 | 13.6 ± 7.8 | .049 |
| Testis volume right, mL | 11.5 ± 6.2 | 11.5 ± 6.2 | NS |
| Testis volume left, mL | 11.5 ± 6.2 | 11.5 ± 6.1 | NS |
| Tanner stage P | 3.8 ± 1.7 | 4.0 ± 1.4 | NS |
| LH, mU/mL | 2.8 (1.6-3.5) | 3.5 (2.2-5.0) | .029 |
| FSH, mU/mL | 2.0 (1.4-3.8) | 2.9 (2.2-4.7) | .025 |
| E1, pM/L | 20 (11-38) | 21 (11-58) | NS |
| E2, pM/L | 43 (19-72) | 31 (11-76) | NS |
| E3, pM/L | 10 (10-10) | 10 (10-10) | NS |
| E2/T | 22 (8-65) | 10 (5-20) | .045 |
| DHT, nM/L | 0.18 (0.03-0.40) | 0.18 (0.05-0.27) | NS |
| A, nM/L | 1.4 (0.8-1.9) | 1.3 (0.8-1.7) | NS |
| T, nM/L | 2.7 (0.8-6.9) | 4.3 (1.4-7.1) | NS |
| Progesterone, nM/L | 0.15 (0.05-0.27) | 0.18 (0.09-0.36) | NS |
| Prolactin, ng/mL | 9.5 (6.9-13.3) | 10.1 (8.0-14.4) | NS |
| IGF-1, ng/mL | 333 ± 124 | 339 ± 102 | NS |
| IGFBP-3, µg/mL | 5.4 ± 1.8 | 5.4 ± 0.8 | NS |
Data as mean ± SD or as median and interquartile range when variable was not normally distributed; P values derived from U test (not normally distributed variables) or from unpaired t test (normally distributed variables). Significant differences are plotted in bold.
Abbreviations: A, androstenedione; BMI-SDS, body mass index as standard deviation score; DHT, 5-dihydrotestosterone; E1, estrone; E2, estradiol; E2/T, estradiol to testosterone ratio; FSH, follicle-stimulating hormone; IGF-1, insulin-like growth factor 1; IGFBP-3, insulin-like growth factor binding protein 3; LH, luteinizing hormone; NS, not significant; T, testosterone.
Discussion
To the best of our knowledge, this is the first study separating boys with true gynecomastia from boys with pseudogynecomastia and analyzing a comprehensive profile of sex hormones by an LC-MS/MS multisteroid-profiling method. Boys with true gynecomastia did not differ in their BMI-SDS from healthy controls according to the studies by Biro et al (5) and Kumanov and colleagues (27) but in contrast to many other studies reporting that boys with breast enlargement are frequently obese (1, 4, 28). In our study the majority of boys with pseudogynecomastia were obese. These findings suggest that boys with pseudogynecomastia were likely included in most previous studies of adolescent gynecomastia, making them difficult to interpret.
In concordance with the literature, the boys with gynecomastia were around age 13 years and pubes Tanner stage 3 to 4 (1, 4, 5, 10, 11), suggesting a role of sex hormone in the genesis of gynecomastia. An imbalance in the ratio of estrogens to androgens tissue levels is postulated as a major cause in the development of gynecomastia (1, 10, 29) but some studies did not find a change in the E2/T ratio (6, 7, 11). In general, an imbalance between estrogen and androgen action occurs if there is an absolute increase in estrogens, a decrease in endogenous production of androgens, an increase in the estrogen-to-free androgen ratio, androgen insensitivity, or an estrogen-like effect of drugs. According to some studies (4, 10, 30-32), we found an imbalance with a higher E2/T ratio in the boys with true gynecomastia compared to controls or boys with pseudogynecomastia. This remains significant even after matching to testes volumes and age. However, the marked variation of the E2/T ratio in the boys with true gynecomastia points toward a multicausal etiology of gynecomastia.
In a longitudinal study of adolescent boys, an increase of E2 was reported before the onset of gynecomastia, whereas T concentrations did not differ between boys with and without gynecomastia (8). An increase in E2 occurring before a similar increase in T at the start of puberty resulting in an elevated E2/T ratio was suggested to be responsible for gynecomastia (2). The breast enlargement usually resolves spontaneously in 2 to 3 years, when the E2/T ratio is restored (2). However, we found in our cross-sectional analysis no difference in E2 concentrations between the boys with gynecomastia and controls, in concordance with some previous reports (6-9, 30, 32). Therefore, the higher E2/T ratio in boys with gynecomastia suggests that the relationship between E2 and T is more important than the absolute value of estrogens in the genesis of gynecomastia.
Boys with gynecomastia had significantly lower T levels compared to boys with pseudogynecomastia or healthy controls in our study. However, this significant difference was lost when adjusting boys with gynecomastia and pseudogynecomastia to testes volumes. Boys with gynecomastia showed significantly lower gonadotropins compared to boys with pseudogynecomastia. This difference remained significant even after adjustment for age and testes volume. However, the gonadotropin levels of boys with gynecomastia were in the normal range for pubertal development according to studies reporting no differences of gonadotropins between boys with gynecomastia and healthy controls (4, 8, 9, 11). Taken together, our findings suggest that a boy with gynecomastia has a lower activity of the pituitary-testes axis with lower T concentrations in the presence of a comparable E2 at the same age.
The question arises concerning the sources of estrogens in gynecomastia. In men, the small circulating quota of estrogens results from extraglandular aromatization of androgens (2). The aromatase enzyme converts T to E2 (33, 34). The higher E2/T ratio in boys with gynecomastia points toward increased aromatase activity. In this line, overexpression of aromatase accounts for prepubertal gynecomastia in boys with Peutz-Jeghers syndrome (35). An increased aromatase activity has been found in skin fibroblasts of patients with gynecomastia (36). Aromatization of T to E2 occurs also in the adipose tissue and is regarded as the main source of E2 in men (2, 33, 34). This might explain why the prevalence of gynecomastia appears to be greater in obese adolescents (1, 4, 28). Additionally, recent studies have shown that both increase in total leptin levels (9) and polymorphisms in its receptor (32) can be involved in the pathogenesis of gynecomastia. Leptin has a direct growth stimulating effect on mammary epithelial cells, and it might increase the sensitivity of breast epithelial cells to estrogen (9).
An inhibitory action of androgens on breast tissue has been previously attributed to DHT induction of 17ßHSDII, which is responsible for inactivation of E2 to the less potent E1, for example, in breast cancer cells (37, 38). However, the similar DHT and E1 concentrations in boys with gynecomastia and pseudogynecomastia point against a decreased inactivation of E2 to E1 in gynecomastia even though the E1 concentrations were higher in boys with gynecomastia compared to controls. Therefore, the higher E2/T ratio in boys with gynecomastia seems rather the result of an increased biosynthesis of E2 due to aromatase activity than a decreased inactivation of E2. Binder and colleagues have previously described a cohort of relatives with dominant transmission of prepubertal gynecomastia due to an aromatase excess syndrome and elevated E1 levels but high normal E2 levels in affected males, in concordance with our findings (39).
Apart from sex hormones, a role of the GH/IGF-1 axis on the pathogenesis of gynecomastia has been speculated (5) because enlargement of mammary glands following exogenous GH administration has been observed in primates (40), and gynecomastia is a side effect in patients treated with GH (41). Furthermore, the presence of IGF-1 receptor in physiological gynecomastia has been demonstrated by immunohistochemical staining (5). The stimulatory effect of IGF-1 on breast formation seems to be synergized by E2 (42). A significant positive association between breast enlargement and IGF-1 levels in pubertal boys has been reported in 2 studies by the same research group (5, 7) but confirming studies are missing. In our study IGF-1 levels did not differ between boys with true gynecomastia and pseudogynecomastia, and IGF-1 levels were in normal range in all boys with gynecomastia. Locally produced IGF-1 is probably more relevant than circulating IGF-1 for the development of gynecomastia (5).
The findings of our cross-sectional study were different from a longitudinal study reporting higher IGF1, E2, free testosterone, and FSH levels in pubertal boys with gynecomastia as compared to controls, whereas E2/T ratio and LH concentration were similar between the groups (5). These discrepancies may be because hormones were measured longitudinally through puberty and therefore reflect a longer period in the study of Mieritz et al (5). In contrast, the samples in our study represent only one time point in puberty in each patient. A further explanation for the difference might be the different techniques of steroids measurements, for example, in the case of T the advantage of an LC-MS/MS–based method as used in our study compared to immune-assay based methods, like the one used in the study by Mieritz et al (5), which has recently been shown to have impaired specificity due to cross-reactivity of the antibody and other unidentified interferences from the matrix (43, 44). An additional explanation for the discrepancies might be the fact that the longitudinal study in contrast to our study did not separate between boys with gynecomastia and pseudogynecomastia. Obesity is associated both with pseudogynecomastia and changes of androgens, estrogens, and the GH/IGF-1 axis (45). Therefore, future longitudinal studies based on LC-MS/MS methods and differentiating between gynecomastia and pseudogynecomastia are necessary.
According to all previous studies in adolescent gynecomastia (8, 15), we found no alteration of prolactin serum concentrations in our study. None of the boys in a large series of adolescents with prolactinoma had the symptom of gynecomastia (46). Furthermore, prolactin staining was negative in biopsies of male gynecomastia (5). Taken together, this suggested that prolactin has no major role in the genesis of adolescent gynecomastia.
Study strengths and limitations
The strengths of this study are the differentiation between pseudogynecomastia and true gynecomastia as well as analyses of a comprehensive profile of sex hormones and their precursors by a state-of-the-art LC-MS/MS multisteroid-profiling method (18).
However, our study presents some potential limitations. First, the study design was cross-sectional, which is prone to many confounders. Second, we cannot exclude the possibility that other androgens and estrogens not measured in this study might influence the development of physiological gynecomastia. For example, 11-ketotestosterone is very abundant in pubertal children and active at the androgen receptor (47, 48), and the desulfation of E1 sulfate to E1 might play a role (49). Throughout puberty, androstenedione and dehydroepiandrosterone-sulfate ratios to E1 and E2 were significantly lower in boys with gynecomastia group compared to a control group (1). Because of the adrenal origin of dehydroepiandrosterone and its sulfate, and of peripheral conversion of adrenal androgens to E1 and to E2, it is suggested that either decreased adrenal production of androgens and/or increased conversion of dehydroepiandrosterone-sulfate and androstenedione to estrogens cause transient gynecomastia in adolescent boys (1). However, other studies demonstrated no significant difference for adrenal hormones in gynecomastia (9). Furthermore, sex hormones are bound to sex hormone-binding globulin, whose concentrations are influenced by many factors including obesity (50, 51). Changes of sex hormone-binding globulin during puberty with lower free testosterone concentrations in boys with gynecomastia have been reported (5, 6, 16). In contrast, there was no significant difference for free testosterone in another study (9). Third, the control group is historical and we have no testes volumes and gonadotropins in the healthy boys without breast enlargement. However, that they have normal Tanner stages for their age points to a normal puberty development. Fourth, the reported measurements of hormones were performed in serum samples, which do not necessarily reflect the intratissue conditions in the breast. For example, subcutaneous skin seems to contribute significantly to the biosyntheses of steroidogenesis including sex hormones (52). Finally, the differentiation between pseudogynecomastia and true gynecomastia has not been proven by histological biopsies for ethical reasons.
In summary, we found an increased E2/T ratio in boys with true gynecomastia compared to boys with pseudogynecomastia or healthy boys without breast enlargement. This disequilibrium of the E2/T ratio was caused by lower T concentrations in boys with gynecomastia, suggesting that gynecomastia is attributed to a relative T deficiency to E2 levels. Future longitudinal studies are necessary also to prove that gynecomastia due to transient alteration in the E2/T ratio is reversible, in contrast to pseudogynecomastia.
Abbreviations
- BMI
body mass index
- DHT
5-dihydrotestosterone
- E2/T
estradiol to testosterone ratio
- GH
growth hormone
- IGF-1
insulin-like growth factor 1
- IGFBP-3
insulin-like growth factor binding protein 3
- LC-MS
liquid chromatography–mass spectrometry
- T
testosterone
Acknowledgments
Financial Support: This work received grant support from Ferring. However, the hypothesis development, analysis, interpretation, and conclusions contained in this study are those of the authors’ alone.
Clinical Trial Information: This study is registered at clinicaltrials.gov (NCT00435734).
Author Contributions: T.R. and P.M.H. developed the study design; T.R., N.L., and A.B. performed the anthropometrical measurements; T.R. performed the ultrasound measurements; and A.K. performed the laboratory measurements. All authors discussed the findings and participated in writing of the paper. T.R. wrote the first draft of the manuscript. T.R. and P.M.H. were the leading writers of the paper.
Additional Information
Disclosure Summary: T.R., P.H., and A.K. have received grant support from Ferring. N.L., A.B., and J.A. have nothing to disclose.
Data Availability: Restrictions apply to the availability of data generated and analyzed during this study to preserve patient confidentiality. The corresponding author will on request detail the restrictions and any conditions under which access to some data may be provided.
References
