


Abstract
Patients with thalassemia major (TM) have a lower bone mineral density (BMD) and higher risk of fracture than the general population. The possible mechanisms include anemia, iron overload, malnutrition, and hormonal deficiency, but these have not been thoroughly investigated.
To identify major mineral and hormonal factors related to BMD in adult TM patients to provide human evidence for the proposed mechanisms.
Retrospective study.
Referral center.
Twenty-nine patients with β-TM, aged 23 to 44 years who were followed-up during 2017 to 2018 were enrolled.
Endocrine profiles, including thyroid, parathyroid, and pituitary function, glucose, vitamin D, calcium, phosphate, and fibroblast growth factor 23 (FGF23) were obtained. The relationships among the above parameters, body height, fractures, and BMD were analyzed.
Abnormal BMD was observed in 42.9% of women and 23.1% of men. The mean final heights of women and men were 3.7 cm and 7.3 cm lower than the mean expected values, respectively. Fracture history was recorded in 26.7% of women and 35.7% of men. BMD was negatively correlated with parathyroid hormone, FGF23, thyrotropin, and glycated hemoglobin (HbA1c) levels, and positively correlated with testosterone, IGF-1, and corticotropin levels (all P < .05). Moreover, hypothyroidism was associated with lower BMD in both the lumbar spine (P = .024) and the femoral neck (P = .004). Patients with hypothyroidism had a higher percentage of abnormal BMD (P = .016).
Hypothyroidism, higher HbA1c, and lower adrenocorticotropin were predictors of abnormal BMD in patients with β-TM. Whether the correction of these factors improves BMD warrants further research.
Patients with thalassemia major (TM) have a lower bone mineral density (BMD) and higher frequency of fracture than the general population (1,2). Transfusion-related iron overload could lead to endocrine dysfunction, such as hypogonadism, growth hormone (GH) deficiency, and hypothyroidism (3,4). These endocrine dysfunctions are important pathogeneses linking TM, low BMD, and a higher risk of fracture (1). Both androgen and estrogen are critical for skeletal development and maintenance (5). Estrogen may decrease receptor activation of nuclear factor kappa-B signaling in osteoclasts and their precursor cells. Androgen increases bone formation. Deficiency of androgen and estrogen increases bone resorption by increasing synthesis or sensitivity to cytokines, such as interleukin (IL)-1, IL-6, tumor necrosis factor-α, and prostaglandin (5). GH increases the production of insulin-like growth factor 1 (IGF-1), and these hormones enhance bone remodeling and cartilage growth (5). Therefore, GH deficiency has marked effects that impairs skeletal growth. Besides, thyroid hormone is also crucial for cartilage growth and differentiation, bone mineralization, and the response of bone to the stimulation of GH (1,5). Hypothyroidism was documented to reduce bone turnover and increase fracture risk (6).
In addition to endocrine dysfunction, other pathogeneses have been proposed, such as ineffective erythropoiesis-related bone marrow expansion, malnutrition, and insulin deficiency (1,7). Transfusion-related iron deposition in the pancreas could also lead to insulin deficiency and diabetes mellitus (DM) (1). Insulin is an osteogenic factor capable of stimulating osteoblast proliferation and differentiation (8). Animal studies have shown that deficiency in insulin receptor substrate 1 resulted in impaired osteoblastic function and low bone turnover osteopenia (5). Hyperglycemia decreases osteoblastic differentiation from mesenchymal stem cells (MSCs) and decreases mineralization of the matrix (9). Therefore, good glycemic control is important for bone health. Fibroblast growth factor 23 (FGF23) has recently been identified to play an important role in bone metabolism. FGF23 is secreted by osteocytes and osteoblasts in response to hyperphosphatemia. It will increase phosphaturia and inhibit the formation of the active form of vitamin D. FGF23 also regulates bone cell number, differentiation, and activity and the mineralization of the matrix (10).
The above pathogeneses have been proposed; however, there is limited human evidence on endocrine dysfunction and abnormal BMD. Therefore, this study aims to identify major mineral and hormonal factors related to low BMD in adult patients with TM.
Patients and Methods
Patients
Adult patients aged 20 years old or older with β-TM who received regular transfusion at the outpatient clinics in National Taiwan University Hospital during 2017 to 2018 were enrolled. Diagnosis of TM was established according to the clinical presentation and the results from hemoglobin electrophoresis. All patients received long-term blood transfusion therapy to maintain hemoglobin levels between 9 and 10.5 g/dL. Deferasirox was used in an attempt to maintain the serum ferritin level below 1000 ng/mL.
Methods
We retrospectively reviewed the charts and recorded each patient’s medical history, body weight, body height, parental height, radiographs, BMD, bone-associated biochemistry markers including serum calcium, phosphorus, intact parathyroid hormone (iPTH), 25-hydroxyvitamin D (25(OH)D), FGF23, and endocrine function including thyroid hormones and pituitary function. Pituitary magnetic resonance imaging (MRI) was also reviewed if available. Expected height was calculated as father’s height + mother’s height/2 + 6.35 cm in men and as father’s height + mother’s height/2 – 6.35 cm in women (11).
Hypogonadism was defined as low serum estrogen in women, low testosterone in men, abnormal menstruation with poor gonadotropin response to clomiphene or luteinizing hormone releasing hormone stimulation test (12), or under gonadal hormone replacement therapy. Euthyroidism was defined as the condition with normal free thyroxine (fT4) and thyrotropin (TSH) levels (normal fT4: 0.6–1.75 μg/dL; normal TSH: 0.1–4.5 mU/L). Hypothyroidism was defined as low fT4 levels or levothyroxine supplement for hypothyroidism. Subclinical hypothyroidism was defined as serum TSH higher than 4.5 mU/L with normal fT4 levels. Serum FGF23 was measured by a 2-site enzyme-linked immunosorbent assay (Kainos Laboratories, Inc., Tokyo, Japan) and the reference range was 8.2 to 54.3 pg/mL (13). Serum 25(OH)D ≤ 24 ng/mL was defined as deficiency, whereas 25(OH)D higher than 24 ng/mL was defined as normal (14).
BMD was measured using dual-energy X-ray absorptiometry (DXA). Since all patients in this study were less than 45 years old, a Z-score of –2.0 standard deviations (SD) or lower was used to define “abnormal BMD” in this study (15). In contrast, a Z-score above –2.0 SD was defined as “normal BMD.” Patients were diagnosed with abnormal BMD if the Z-score of either the lumbar spine or femoral neck was below –2.0 SD. Pituitary hemochromatosis was defined as a reduction in signal intensity of the anterior lobe in T1-weighted images of the pituitary MRI in patients with high ferritin levels (16).
Ethical considerations
Ethics approval was obtained from the Ethics Committee of National Taiwan University Hospital (protocol number: 201903041RINB). The present study was registered on ClinicalTrials.gov (ID: NCT03951818).
Statistical Analysis
Normally distributed continuous variables were presented as mean ± SD. Variables that were not normally distributed were presented as median (interquartile range). The Student t-test was used to compare the differences of normally distributed continuous variables between groups, whereas the Wilcoxon–Mann–Whitney test was used if the dependent variables were not normally distributed. Linear regression models were performed to analyze the relationship of BMD and other characteristics, using BMD as the dependent variable, which was adjusted for age, sex, and ferritin. Ferritin was used in the adjustment because iron deposition not only led to endocrine dysfunction but also impaired mineralization in the bone itself, and ferritin was the most widely used indicator for iron overload (3,17). Female gender was coded as 2, and male as 1. A 2-tailed P < .05 was considered statistically significant. Stata/SE 14.0 for Windows (StataCorp LP, College Station, TX) was used for statistical analyses.
Results
A total of 29 patients with TM aged 23 to 44 years old were enrolled in this study, including 15 women and 14 men (Table 1). They had received blood transfusion therapy since a median age of 7 months with an interquartile range of 6 to 12 months old. The median transfusion history was 31 years with an interquartile range of 26 to 36 years. The amount and frequency of recent blood transfusion therapy ranged from 2 to 4 units of packed red blood cells every 2 weeks to 2 to 4 units every 4 weeks. The mean final heights were 3.7 cm lower than expected in women, and 7.3 cm lower than expected in men. Abnormal BMD was observed in 42.9% of the women and 23.1% of the men. A total of 26.7% of the women and 35.7% of the men had a history of fracture, including femoral bone fracture in 3 patients, spinal fracture in 2, knee fracture in 2, a wrist fracture in 1, and an upper arm fracture in 1 patient. Four of the fractures were traumatic, including 2 knee fractures, 1 femoral facture, and 1 wrist fracture. The other 5 fractures were nontraumatic. In the 29 patients with TM, 1 patient had hypocalcemia and another 1 had hypophosphatemia. Vitamin D deficiency was highly prevalent (100% of the women and 81.8% of the men). Renal functions were normal in all patients. Hypogonadism and GH deficiency were also highly prevalent. Totally 14 patients underwent pituitary MRI examination. Thirteen of them (92.9%) received pituitary MRI due to hypogonadotropic hypogonadism and all of the results were abnormal, including 1 empty sella and 12 hemochromatosis. One patient received brain MRI exam due to headache. She did not have hypogonadism and her pituitary gland appeared normal. Five of these 14 patients (35.7%) who received pituitary MRI examination had abnormal BMD. On the other hand, 4 of the 15 patients (26.7%) who did not receive pituitary MRI examination had hypogonadism. Thirteen of these 15 patients received BMD examination, and 4 (30.8%) had abnormal BMD.
Basic characteristics of the patients.
| Female | Male | |
|---|---|---|
| Number | 15 | 14 |
| Age (year) | 33.6 ± 6.9 | 31 ± 5.3 |
| Body height (cm) | 153 (150.1–156) | 162.3 (155.5–165)* |
| Body mass index (kg/m2) | 20.8 (19.1–22) | 21.6 (18.7–23.7) |
| Difference of real height from expected height (cm) | –3.7 ± 4.2 | –7.3 ± 6.7 |
| Fracture, n (%) | 4 (26.7) | 5 (35.7) |
| BMD, Z score (SD) | ||
| Lumbar spine (L1–L4) | –1.31 ± 1.86 | –1.44 ± 1.09 |
| Femoral neck | –1.14 ± 1.52 | –0.83 ± 1.40 |
| Abnormal BMD,a % (number checked) | 42.9 (14) | 23.1 (13) |
| Lumbar spine, % (number checked) | 37.5 (8) | 27.3 (11) |
| Femoral neck, % (number checked) | 30.8 (13) | 8.3 (12) |
| Serum calciumb (mmol/L) | 2.23 ± 0.14 | 2.23 ± 0.08 |
| Serum phosphorus (mg/dL) | 3.8 ± 0.8 | 4 ± 0 .9 |
| Serum 25(OH)D (ng/mL) | 14 (13–16) | 11 (10–19) |
| Serum 25(OH)D deficiency,c % (number checked)) | 100 (11) | 81.8 (11) |
| Serum iPTH (pg/mL) | 32 (20.6–43.2) | 24 (15.4–34.5) |
| Serum FGF23 (pg/mL) | 8.6 (2.5–17.5) | 21.8 (14.8–29.5)* |
| Serum FGF23 statusd (low, normal, high) | 5, 4, 1 | 0, 11, 1* |
| Thyroid function (euthyroid, subclinical hypothyroidism, hypothyroidism) | 12, 1, 2 | 10, 1, 3 |
| Serum fT4 (ng/dL) | 0.97 ± 0.16 | 0.94 ± 0.18 |
| Serum TSH (μU/mL) | 2.32 (1.7–3.35) | 3.16 (1.96–4.03) |
| Hypogonadism, % | 60 | 57.1 |
| Serum estradiol (pg/mL) | 47 ± 28.7 | |
| Serum testosterone (ng/mL) | 4.1 ± 2.4 | |
| FSH (IU/L) | 2.1 (1.6–5.9) | 4.2 (1.6–8) |
| LH (IU/L) | 2.9 ± 3.1 | 3.9 ± 2.5 |
| Serum IGF-1 (ng/mL) | 89.9 ± 28.8 | 98 ± 27.8 |
| Growth hormone deficiency, % (number checked) | 75 (12) | 57.1 (14) |
| Abnormal pituitary MRI, % (number checked)) | 87.5 (8) | 100 (6) |
| Glucose status (normal, pre-DM, DM) | 1, 3, 11 | 0, 3, 11 |
| HbA1c (%) | 7.76 ± 1.42 | 7.04 ± 0.78 |
| Hemoglobin (g/dL) | 10.23 ± 1.39 | 10.13 ± 1.62 |
| Serum ferritin (ng/mL) | 3054 (898–5286) | 1163 (782–2116) |
| Serum ACTH (pg/mL) | 23.4 ± 14.7 | 33.5 ± 12.6 |
| Serum cortisol (μg/dL) | 12.5 ± 3.9 | 13.1 ± 4.9 |
Data are presented as mean ± SD if normally distributed, and as median (interquartile range) if not normally distributed.
Abbreviations: 25(OH)D, 25-hydroxyvitamin D; ACTH, adrenocorticotropin; BMD, bone mineral density; DM, diabetes mellitus; FGF23, fibroblast growth factor 23; fT4, free thyroxine; FSH, follicle-stimulating hormone; iPTH, intact parathyroid hormone; LH, luteinizing hormone; TSH, thyroid stimulating hormone.
*P < .05 when compared with female.
aBMD > –2 SD, normal; BMD ≤ –2 SD: below the expected range for age: abnormal.
bCalcium was corrected by calcium (mmol/L) + 0.2 × (albumin (g/dL) – 4).
c25(OH)D ≤ 24 ng/mL was defined as deficiency (1), whereas 25(OH)D higher than 24 ng/mL was defined as normal (0).
dFGF23 < 8.2 pg/mL was defined as low (–1); FGF23 between 8.2 and 54.3 pg/mL was defined as normal (0); FGF23 > 54.3 pg/mL was defined as high (1).
We observed the correlation between BMD and biochemical factors and found that BMD was negatively correlated with iPTH, FGF23, TSH, and glycated hemoglobin (HbA1c), and positively correlated with testosterone, IGF-1, and corticotropin, with statistical significance (Table 2). Patients with hypothyroidism had a lower BMD. FGF23, iPTH, TSH, testosterone, IGF-1, and HbA1c were correlated with either femoral neck or lumbar spine BMD, while thyroid status and adrenocorticotropin (ACTH) were correlated with both sites of BMD. Patients with a Z-score ≤ –2 SD in either the lumbar spine or femoral neck were labeled as patients with abnormal BMD. Thyroid status, HbA1c, and ACTH were significantly different between patients with normal and abnormal BMD (Table 3). We put these 3 significant factors together with ferritin, age, and gender into the multivariate regression model as independent variables and used BMD as the dependent variable (Table 4). Hypothyroidism was the only significant factor in the model and was correlated with lower BMD of femoral neck. The relationship between fracture and mineral and hormonal factors were also examined. The results showed that there was no significant association (Table 5).
The relationship between bone mineral density (BMD) and other characteristics via linear regression models, using BMD as the dependent variable, which is adjusted for age, sex, and ferritin. Regression coefficients (coef.) and P-values are shown (n = 27).
| BMD of lumbar spine, Z score (SD) | BMD of femoral neck, Z score (SD) | |||
|---|---|---|---|---|
| coef. | P | coef. | P | |
| Age (year) | –0.022 | .757 | –0.053 | .266 |
| Gender | 0.226 | .776 | 0.002 | .997 |
| Body height (cm) | –0.008 | .883 | 0.083 | .089 |
| Body mass index (kg/m2) | –0.085 | .562 | 0.116 | .252 |
| Difference of real height from expected height (cm) | –0.005 | .909 | 0.081 | .070 |
| Fracturea | –0.309 | .696 | –0.889 | .162 |
| Calciumb (mmol/L) | 1.309 | .810 | 2.279 | .569 |
| Phosphorus (mg/dL) | 0.070 | .906 | 0.202 | .613 |
| 25(OH)D (ng/mL) | 0.074 | .247 | –0.111 | .283 |
| 25(OH)D deficiencyc | –1.984 | .260 | N/Ad | N/Ad |
| iPTH (pg/mL) | –0.017 | .264 | –0.028 | .016 |
| FGF23 (pg/mL) | –0.014 | .118 | –0.016 | .025 |
| FGF23 statuse | –1.682 | .025 | –0.921 | .166 |
| Hypothyroidismf | –1.053 | .024 | –1.070 | .004 |
| fT4 (ng/dL) | 3.358 | .219 | 1.758 | .367 |
| TSH (μU/mL) | –0.323 | .284 | –0.408 | .043 |
| Hypogonadismg | –0.649 | .416 | –0.639 | .318 |
| Estradiol in female (pg/mL) | 0.053 | .164 | 0.011 | .470 |
| Testosterone in male (ng/mL) | 0.440 | .011 | 0.173 | .490 |
| IGF-1 (ng/mL) | 0.041 | .028 | –0.003 | .818 |
| Growth hormone deficiencyh | –0.944 | .386 | 0.498 | .480 |
| DMi | –0.461 | .581 | –0.096 | .868 |
| HbA1C (%) | –0.747 | .042 | –0.344 | .276 |
| Hb (g/dL) | 0.274 | .302 | –0.016 | .943 |
| ACTH (pg/mL) | 0.074 | .024 | 0.054 | .034 |
| Cortisol (μg/dL) | 0.045 | .644 | –0.045 | .572 |
| Ferritin (ng/mL) | 0.0002 | .436 | –0.0001 | .193 |
25(OH)D, 25-hydroxyvitamin D; ACTH, adrenocorticotropin; DM, diabetes mellitus; FGF23, fibroblast growth factor 23; fT4, free thyroxine; iPTH, intact parathyroid hormone; N/A: not available; TSH, thyroid stimulating hormone.
aFracture: 0, no fracture; 1, fracture.
bCalcium was corrected by: calcium (mmol/L) + 0.2 × (albumin (g/dL) – 4).
c25(OH)D ≤ 24 ng/mL was defined as deficiency (1). 25(OH)D higher than 24 ng/mL was defined as normal (0).
dN/A, not available. This is because all of the 20 patients who had 25(OH)D and BMD of the femoral neck checked had 25(OH)D deficiency.
eFGF23 status: FGF23 < 8.2 pg/mL was defined as low (–1), FGF23 between 8.2 and 54.3 pg/mL was defined as normal (0), and FGF23 > 54.3 pg/mL was defined as high (1).
fHypothyroidism: 0, euthyroid; 1, subclinical hypothyroidism; 2, hypothyroidism.
gHypogonadism: 0, normal gonad function; 1, hypogonadism.
hGrowth hormone deficiency: 0, normal; 1, deficiency.
iDM: 0, euglycemia; 1, pre-DM; 2: DM.
Relationship between abnormal bone mineral density (BMD) and mineral and hormonal factors.
| Normal BMD | Abnormal BMD | P * | |
|---|---|---|---|
| Number | 18 | 9 | |
| Age (year) | 31.4 ± 5.7 | 33.7 ± 7.7 | .392 |
| Sex (female: male) | 8:10 | 6:3 | .285 |
| Body height (cm) | 157.1 (153–160.9) | 155.5 (152.8–158) | .503 |
| Body mass index (kg/m2) | 21.8 (19.1–23.7) | 20.8 (20.6–21.7) | .292 |
| Difference of real height from expected height (cm) | –5.7 ± 6.4 | –4.7 ± 4.6 | .756 |
| Fracture (N (%)) | 6 (33.3%) | 3 (33.3%) | 1.000 |
| Corrected calciuma (mmol/L) | 2.23 ± 0.09 | 2.22 ± 0.12 | .787 |
| Phosphorus (mg/dL) | 4.0 ± 0.9 | 3.8 ± 0.8 | .678 |
| 25(OH)D (ng/mL) | 13 (10.5–18.5) | 14 (11–14) | .901 |
| 25(OH)D deficiency,b % (number checked)) | 93.8 (16) | 100 (5) | .576 |
| iPTH (pg/mL) | 28.5 (15.4–41.1) | 25.4 (17.8–87.6) | .672 |
| FGF23 (pg/mL) | 19.9 (5.7–27.9) | 17.0 (14.1–101.2) | .654 |
| FGF23 statusc (low, normal, high) | 5, 11, 1 (29%, 65%, 6%) | 0, 3, 1 (0%, 75%, 25%) | .131 |
| Thyroid status (euthyroid, subclinical hypothyroidism, hypothyroidism) | 17, 0, 1 (94%, 0%, 6%) | 5, 0, 4 (56%, 0%, 44%) | .016 |
| Hypogonadism (%) | 55.6 | 66.7 | .587 |
| Growth hormone deficiency (%) | 61.1 | 85.7 | .246 |
| Abnormal pituitary MRId (%) | 88.9 | 100 | .456 |
| Glucose status (normal, pre-DM, DM) | 1, 4, 13 (6%, 22%, 72%) | 0, 2, 7 (0%, 22%, 78%) | .711 |
| HbA1c (%) | 7.04 ± 0.87 | 8.03 ± 1.50 | .039 |
| Hemoglobin (g/dL) | 10.52 ± 1.45 | 9.87 ± 1.34 | .267 |
| Ferritin (ng/mL) | 1182 (790–2809) | 2290 (819–3408) | .304 |
| ACTH (pg/mL) | 34.2 ± 12.6 | 16.4 ± 9.6 | .005 |
| Cortisol (μg/dL) | 12.9 ± 4.1 | 12 ± 5.5 | .681 |
Abnormal BMD was defined as Z-score ≤ –2 SD in either lumbar spine or femoral neck, and otherwise defined as normal.
Data are presented as mean ± SD ± if normally distributed, and as median (interquartile range) if not normally distributed.
25(OH)D, 25-hydroxyvitamin D; ACTH, adrenocorticotropin; DM, diabetes mellitus; FGF23, fibroblast growth factor 23; fT4, free thyroxine; iPTH, intact parathyroid hormone; TSH, thyroid stimulating hormone.
*P values for the comparison between normal and abnormal BMD group.
aCalcium was corrected by: calcium (mmol/L) + 0.2 × (albumin (g/dL) – 4).
b25(OH)D ≤ 24 ng/mL was defined as deficiency (1), whereas 25(OH)D higher than 24 ng/mL was defined as normal (0).
cFGF23 < 8.2 pg/mL was defined as low (–1); FGF23 between 8.2 and 54.3 pg/mL was defined as normal (0); FGF23 > 54.3 pg/mL was defined as high (1).
dHemochromatosis, empty sella or partial empty sella.
The relationship between bone mineral density (BMD) and endocrine function. multivariate regression analysis was performed using BMD as the dependent variable, endocrine function as independent variable, and age, gender, and ferritin for adjustment. Regression coefficients (coef.) and P-values are shown (n = 27).
| BMD of lumbar spine, Z score (SD) | BMD of femoral neck, Z score (SD) | |||
|---|---|---|---|---|
| coef. | P | coef. | P | |
| Hypothyroidisma | –0.522 | 0.317 | –1.026 | 0.034 |
| HbA1C (%) | –0.367 | 0.347 | 0.200 | 0.564 |
| ACTH (pg/mL) | 0.050 | 0.118 | 0.045 | 0.075 |
| Ferritin (ng/mL) | 0.0001 | 0.569 | –0.0001 | 0.216 |
| Age (year) | 0.052 | 0.428 | 0.011 | 0.811 |
| Genderb | 0.786 | 0.350 | –0.008 | 0.99 |
| Constant | –3.0505 | 0.359 | –3.3535 | 0.256 |
aHypothyroidism: 0, euthyroid; 1, subclinical hypothyroidism; 2, hypothyroidism.
bGender: 2, female; 1, male.
Relationship between fracture and mineral and hormonal factors.
| No fracture | Fracture | P* | |
|---|---|---|---|
| Number | 20 | 9 | |
| Age (year) | 31.5 ± 5 ± .8 | 34.2 ± 7 ± .1 | .283 |
| Sex (female: male) | 11:9 | 4:5 | .614 |
| Body height (cm) | 155.3 (153–160) | 159 (152.8–160.9) | .906 |
| Body mass index (kg/m2) | 21.1 (19.1–22.4) | 20.9 (19.1–22) | .981 |
| Difference of real height from expected height (cm) | –6.4 ± 6.0 | –3.8 ± 5.7 | .378 |
| BMD of lumber spine, Z score (SD) | –1.33 ± 1.22 | –1.49 ± 1.82 | .812 |
| BMD of femoral neck, Z score (SD) | –0.63 ± 1.39 | –1.63 ± 1.39 | .098 |
| Calciuma (mmol/L) | 2.23 ± 0.11 | 2.22 ± 0.11 | .827 |
| Phosphorus (mg/dL) | 4.00 ± 0.82 | 3.71 ± 0.76 | .379 |
| 25-OH Vitamin D (ng/mL) | 13 (11–16) | 15 (12–19) | .472 |
| 25-OH Vitamin D deficiency,b % (number checked)) | 85.7 (14) | 100 (8) | .273 |
| iPTH (pg/mL) | 26.8 (19.4–34.5) | 22.5 (17.8–48.2) | .628 |
| FGF23 (pg/mL) | 17 (9.1–29.1) | 18.3 (8.6–25.3) | .946 |
| FGF23 statusc (low, normal, high) | (3,10,1) | (2,5,1) | .967 |
| Thyroid status (euthyroid, subclinical hypothyroidism, hypothyroidism) | (15, 2, 3) | (7, 0, 2) | .975 |
| fT4 (ng/dL) | 0.92 ± 0.14 | 1.04 ± 0.20 | .063 |
| TSH (μU/mL) | 2.46 (1.88–3.65) | 3.33 (1.75–3.6) | .741 |
| Hypogonadism | 55% | 67% | .562 |
| Estradiol in female (pg/mL) | 55.4 ± 29.0 | 28.3 ± 19.1 | .119 |
| Testosterone in male (ng/mL) | 4.5 ± 2.6 | 3.5 ± 2.2 | .492 |
| IGF-1 (ng/mL) | 97.2 ± 26.6 | 88.6 ± 31.3 | .466 |
| Growth hormone deficiency, % (number checked)) | 70.6 (17) | 55.6 (9) | .452 |
| Abnormal pituitary MRI,d % (number checked) | 88.9 (9) | 100 (5) | .456 |
| Glucose status (normal, pre-DM, DM) | 1, 2, 17 | 0, 4, 5 | .121 |
| HbA1C (%) | 7.45 ± 1.25 | 7.32 ± 1.13 | .796 |
| Hb (g/dL) | 10 ± 1.53 | 10.60 ± 1.36 | .317 |
| Ferritin (ng/mL) | 1252 (881–3112) | 1323 (782–4399) | .777 |
| ACTH (pg/mL) | 27.9 ± 16.0 | 28.3 ± 11.5 | .950 |
| Cortisol (μg/dL) | 12.0 ± 4.3 | 14.3 ± 4.1 | .225 |
Data are presented as mean ± SD ± if normally distributed, and as median (interquartile range) if not normally distributed.
25(OH)D, 25-hydroxyvitamin D; ACTH, adrenocorticotropin; BMD, bone mineral density; DM, diabetes mellitus; FGF23, fibroblast growth factor 23; fT4, free thyroxine; iPTH, intact parathyroid hormone; TSH, thyroid stimulating hormone.
*P values for the comparison between normal and abnormal BMD group.
aCalcium was corrected by: calcium (mmol/L) + 0.2 × (albumin (g/dL)–4).
b25(OH)D ≤ 24 ng/mL was defined as deficiency (1), whereas 25(OH)D higher than 24 ng/mL was defined as normal (0).
cFGF23 < 8.2 pg/mL was defined as low (–1); FGF23 between 8.2 and 54.3 pg/mL was defined as normal (0); FGF23 > 54.3 pg/mL was defined as high (1).
dHemochromatosis, empty sella or partial empty sella.
FGF23 was log-transformed to meet natural distribution. Multivariate regression analysis was performed using the natural log of FGF23 as a dependent variable and ferritin, iPTH, phosphate, or 25(OH)D as independent variables, adjusting for age and sex. The results showed that FGF23 was not significantly correlated with ferritin, iPTH, phosphate, or 25(OH)D.
Five patients were diagnosed with hypothyroidism. They received levothyroxine treatment after hypothyroidism diagnosed and the dosage was adjusted according to the follow-up thyroid function. The mean age was 37 years with a SD of 9 years for patients with hypothyroidism, and 31 years with a SD of 5 years for the other patients (P = .064 when comparing these 2 groups using the t-test). The mean transfusion history was 35 years with a SD of 9 years for patients with hypothyroidism, and it was 30 years with a SD of 5 years for the other patients (P = .151 using the t-test). The median ferritin level was 2290 ng/mL with an interquartile range of 1323 to 3170 ng/mL for patients with hypothyroidism, and 1182 ng/mL with an interquartile range of 805 to 3231 ng/mL for the other patients (P = .453, using the Wilcoxon–Mann–Whitney test). Patients with hypothyroidism (17.2%) had lower BMD (P = .024 for lumbar spine, P = .004 for femoral neck) (Table 2). Among the 5 patients who had hypothyroidism, 4 were confirmed as primary hypothyroidism with low fT4 and high TSH. Three of these 4 patients received thyroid echography examination. The results were compatible with thyroid hemochromatosis, which indicated a small and hypoechoic thyroid gland (18). Antithyroperoxidase antibody (anti-TPO Ab) and antithyroglobulin antibody (ATA) were all negative in these 3 patients. One of the 5 hypothyroid patients was diagnosed with a mixed type of primary and secondary hypothyroidism on the basis of the following results: low fT4, normal TSH, negative anti-TPO Ab, and ATA, as well as hemochromatosis of the pituitary gland (by MRI) and thyroid gland (by sonography) (Fig. 1).
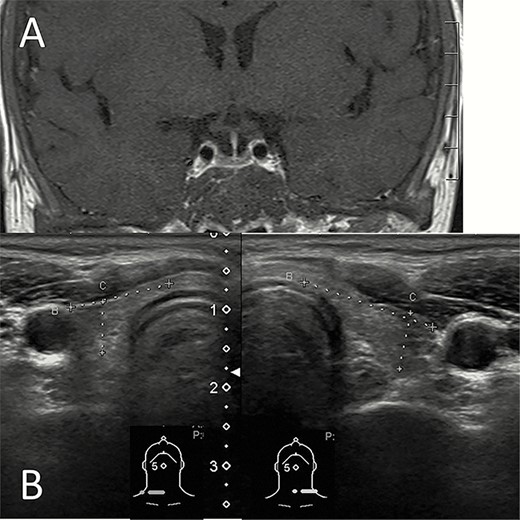
Hemochromatosis of the pituitary and thyroid glands. (A) T1 weighted image with contrast of the magnetic resonance imaging shows that the pituitary gland was relatively small and decreased contrast enhancement resulted in low signal intensity. (B) Thyroid sonography shows a small thyroid gland with low echogenicity.
Discussion
TM-associated low BMD is a complex and multifactorial disease. Various genetic and acquired factors are involved in its pathogenesis (19). Acquired factors include bone marrow expansion, iron overload, bone toxicity of iron chelators, low physical activity, renal dysfunction, hypogonadism, GH deficiency, vitamin D deficiency, hypothyroidism, and hyperglycemia (19). Our study is the first study to review the complete endocrine and mineral profiles to identify factors related to the severity of decreased BMD in patients with TM. We found that hypothyroidism and hyperglycemia were the most relevant factors of lower bone mass, while ACTH had a protective role. Other related factors included PTH, FGF23, IGF-1, and testosterone levels.
Hypothyroidism was correlated with a lower BMD in our study. Thyroid hormones are important for development and maintenance of the skeleton (20). Thyroid hormones regulate chondrogenesis and bone mineralization (1). In adults, thyroid hormones regulate bone turnover and BMD, and exert anabolic effects to stimulate peak bone mass accrual during growth (1,21). Hypothyroidism would contribute to delayed bone age, growth arrest, and a short stature in juveniles and reduced bone turnover and increased fracture risk in adults (6). Tuchendler et al. showed that newly diagnosed hypothyroidism among premenopausal women did not have an influence on BMD (22). Tsevis et al. showed that hypothyroidism negatively affected BMD in postmenopausal women (23). In TM, hypothyroidism mainly results from iron overload to the thyroid (24). The association of factures and hypothyroidism in TM is not consistent among different studies. A study conducted in America, Canada, and the United Kingdom showed that hypothyroidism was related to fractures in TM patients (25). However, another study in North America showed that there was no correlation between hypothyroidism and fractures in patients with TM (26). Since low BMD is just one of the causes for the occurrence of fracture, differences in other factors such as muscle strength, balance, and visual acuity may explain the different results in the 2 studies. For the association between hypothyroidism and bone mineral loss, only 1 study in Iran demonstrated that hypothyroidism was significantly related to bone mineral loss in patients with TM (21), which is consistent with our findings. Our study is the second study showing that hypothyroidism is associated with low BMD.
Previous studies reported a variable prevalence of an impaired pituitary–adrenal axis in patients with TM, ranging from 0 to 45.8%. Since most affected patients displayed high ACTH levels and an impaired adrenal response to a stimulation test, primary adrenal failure caused by iron overload was thought to be the main etiology (27). In the present study, we found, for the first time, that ACTH correlated positively with BMD in patients with TM. This may be because lower BMD indicated more seriously generalized iron deposition, including pituitary hemochromatosis, which would lead to lower ACTH levels. In contrast, a possible protective effect of ACTH on BMD had been proposed in the literature (28–30). For example, in a study performed by Guo et al., patients with Cushing’ syndrome, including Cushing’s disease (CD), and adrenal-dependent Cushing’s syndrome had lower BMD than healthy control (28). It is reasonable because osteoporosis is one of the most important consequences of hypercortisolism. But they also found that lumbar BMD was higher in patients with CD than in patients with adrenal-dependent Cushing’s syndrome (P < .05), and that lumbar BMD correlated positively with ACTH in patients with CD (P = .023) (28). They proposed that ACTH was a protective factor for BMD in patients with Cushing’ syndrome (28). Possible mechanisms are explained as follows: bone is differentiated from the MSCs, a process which is regulated by local signals and systemic hormones. ACTH increases bone development from MSCs (29) and is a growth and survival factor for osteoblasts (30). ACTH increases osteoblast production of vascular endothelial growth factor A to augment bone formation and alkaline phosphatase (ALP) activity (30). Besides, ACTH stimulates the adrenal cortex to secrete dehydroepiandrosterone (31,32), which can induce MSC differentiation to osteoblasts as well as stimulate osteoblast cell proliferation and expression of ALP (33). In humans, serum dehydroepiandrosterone concentration has been shown to have a positive correlation with BMD (34).
Patients with TM have a higher prevalence of DM, which largely contributed to iron overload in the pancreas, liver, and muscle (35). DM is associated with an increased risk of fracture either through insulin deficiency or hyperglycemia in the general population (36). Our study showed that DM was not related to BMD, but HbA1c was. This is compatible with the literature (20). The possible reasons why hyperglycemia is related to low BMD include the following. First, insulin stimulates osteoblast proliferation and endochondral bone growth; therefore, insulin deficiency without enough supplementation in patients with TM is associated with low BMD (1). Second, hyperglycemia upregulates peroxisome proliferation-activated receptor type gamma activity, which results in MSC differentiation to adipocytes rather than osteoblasts (9). Hyperglycemia also decreases the expression of ALP by osteoblasts, which indicates a deficit in mineralization of the matrix (9). Moreover, hyperglycemia is associated with increased glycated collagen. If the collagen is glycated, the bone cells may be less likely to adhere to collagen and produce new matrix (9). Therefore, insufficient insulin supplementation and poor glycemic control may be related to low BMD. Although baseline HbA1c is higher in patients with TM than the general population, HbA1c is still a good marker for worsening glucose homeostasis in TM (37). The above results indicated that glycemic control may be beneficial for BMD preservation.
FGF23 is secreted by osteocytes and osteoblasts in response to hyperphosphatemia and elevated 1,25-dihydroxyvitamin D (38). In our study, 22.7% of the patients had a decreased serum FGF23 concentration. Tangngam et al. have shown that patients with TM had significantly lower median plasma FGF23 levels than the healthy controls. The proposed mechanism is that iron deposition in thalassemic bones would inhibit osteoblast proliferation and differentiation, and, thus, compromise FGF23 production by osteoblasts and osteocytes (38). On the other hand, 9.1% of the patients in our study had elevated serum FGF23. Schouten et al. have shown that parenteral iron transfusion was associated with increased FGF23 secretion (39). FGF23 regulates phosphate homeostasis by inhibiting 1α-hydroxylase activity in the kidney, which is important for vitamin D metabolism. Besides, FGF23 can promote phosphate loss in the renal tubule. In addition, FGF23 can directly impair bone mineralization via suppression of tissue nonspecific ALP (40). Excess production or impaired degradation of FGF23 can cause secondary low BMD (41). Our results showed that serum FGF23 concentration had a significant and negative correlation with lumbar BMD, whereas the serum iPTH level had a negative correlation with BMD in the femoral neck. PTH stimulates osteoclastogenesis and subsequently increases bone resorption (1). Besides, we found that the serum testosterone level was positively correlated with lumbar BMD in men. Testosterone has been known to have a direct stimulatory effect on osteoblast proliferation and differentiation (1). Taken together, our findings suggest that the role of FGF23, iPTH, IGF-1, and testosterone on bone metabolism in patients with TM is similar to that in the general population.
We observed the relationship between fracture and mineral and hormonal factors, and found that there was no statistically significant association between them (Table 5). This is probably because of the small sample size and the multifactorial nature of fracture risk (42). A number of risk factors for fracture has been identified other than low BMD, such as cigarette smoking, low body weight, long-term low calcium intake, limited physical activity, alcohol intake, rheumatoid arthritis, impaired eyesight, and glucocorticoid exposure (42). It is worthy of further data collection and investigation of fracture risks in TM patients.
This study is limited in its small sample size and is retrospective in design. However, with this limited sample size and design, we showed significant relationships between endocrine hormones, bone metabolism-related hormones, glycemic indices, and BMD for the first time. Our findings suggest that further prospective studies with a larger sample size to explore the issue in depth is worthwhile. Another limitation is the measurement of BMD with DXA in TM patients. BMD measured by DXA is corrected for the area, but not for the volume. Shorter persons, as many TM patients are, will have lower BMD than taller people even when their true bone density is comparable (4). Besides, the presence of deformity especially in the spine of TM patients secondary to marrow expansion and deferoxamine-induced bone dysplasia will interfere with the accuracy of DXA (4). Perhaps more accurate measurements of bone density and quality such as trabecular bone score and quantitative computed tomography may be used in the future study.
In conclusion, thalassemia-associated low BMD is a major complication in patients with TM. Our study showed that hypothyroidism, poor glycemic control, and low ACTH were associated with poor BMD. Based on these findings, it is promising to conduct interventional trials in the future that evaluate the effect of treating hypothyroidism or glycemic control on BMD and the risk of fracture in patients with TM.
Abbreviations
- 25(OH)D
25-hydroxyvitamin D
- ACTH
adrenocorticotropin
- ALP
alkaline phosphatase
- ATA
antithyroglobulin antibody
- anti-TPO Ab
antithyroperoxidase antibody
- BMD
bone mineral density
- DM
diabetes mellitus
- DXA
dual-energy X-ray absorptiometry
- FGF
fibroblast growth factor
- fT4
free thyroxine
- GH
growth hormone
- HbA1c
glycated hemoglobin
- IGF
insulin-like growth factor
- IL
interleukin
- iPTH
intact parathyroid hormone
- MC
mesenchymal stem cell
- MRI
magnetic resonance imaging
- SD
standard deviation
- TM
thalassemia major
- TSH
thyrotropin
Acknowledgments
The authors thank the staff of the Eighth Core Lab in the Department of Medical Research of the National Taiwan University Hospital for technical support during the study. The authors also thank Professor Tien-Shang Huang for the funding support.
Financial Support: This work was supported by the Liver Disease Prevention and Treatment Research Foundation, Taiwan, National Taiwan University Hospital, National Taiwan University, and Wong-Yuan Endocrine Fund in Taiwan.
Clinical Trial Information: The present study was registered on ClinicalTrials.gov (ID: NCT03951818) (Registered May 9, 2019).
Additional Information
Disclosure Summary: The authors have nothing to disclose.
Data Availability: The datasets generated during and/or analyzed during the current study are not publicly available but are available from the corresponding author on reasonable request.
References
