


Abstract
Adults with type 2 diabetes (T2D) have higher fracture risk compared with nondiabetics, despite having higher bone mineral density (BMD). Insulin resistance (IR) has been associated with increased BMD. It is not known if IR increases fracture risk.
We investigated the relationship among IR HOMA-IR, BMD, and incident nonspine fractures in nondiabetic individuals.
Participants included 2398 community-dwelling, nondiabetic older adults (age 74 ± 3 years, 53% women, 38% black) in the Health, Aging and Body Composition Prospective Cohort Study [median follow-up: 12 (interquartile range: 6) years].
The cut-off values for the HOMA-IR quartiles were 1.05, 1.54, and 2.33. Total hip BMD was 0.104 g/cm2 higher in the fourth vs the first HOMA-IR quartile (P < 0.001). This difference was attenuated after adjustment for BMI (adjusted mean difference 0.007 g/cm2; P = 0.371). In unadjusted models, fracture risk was lower in those with higher HOMA-IR [hazard ratio (HR) 0.86 (95% CI 0.73 to 1.01) and 0.65 (95% CI 0.47 to 0.89) for the third and fourth quartile, respectively, vs the first quartile]. However, after adjustment for BMD and BMI, fracture risk was significantly higher in the third quartile (HR 1.19, 95% CI 1.00 to 1.41) and tended to be increased in the fourth quartile (HR 1.12, 95% CI 0.87 to 1.46) vs the first quartile.
Greater IR is associated with higher BMD in nondiabetic older adults. In contrast to the relationship between T2D and fracture risk, we did not find consistent evidence that greater IR is associated with increased fracture risk after adjustment for BMI and BMD.
In recent years, the association between type 2 diabetes (T2D) and bone fragility has gained increasing attention, as many studies have confirmed an increase in fracture risk associated with T2D, including several meta-analyses (1–6). However, less research has focused on the relationship between bone health and insulin resistance (IR), i.e., the underlying pathogenic mechanism for T2D, particularly in subjects without overt diabetes. In insulin-resistant states, insulin secretion increases to overcome the resistance to the effects of the hormone in skeletal muscle, adipose tissue, and liver, leading to hyperinsulinemia (7). The effects of hyperinsulinemia and IR on bone have not been fully elucidated. Both osteoblasts and osteoclasts express the insulin receptor on their surface (8, 9), and experimental evidence confirmed that the insulin receptor in osteoblasts is required for cell proliferation, survival, and differentiation (10). In vitro, physiological concentrations of insulin have been shown to increase osteoblast proliferation rate, collagen synthesis, alkaline phosphatase production, and glucose uptake and to inhibit osteoclast activity (11), indicating that insulin acts as an anabolic agent in bone. Conversely, recent studies in mouse models indicate that osteoblasts can become insulin resistant with an unfavorable impact on their function (12).
In clinical investigations, several large population studies have established that circulating insulin concentrations or IR are positively associated with bone mineral density (BMD), both in individuals with or without diabetes (13–16). However, there may be other effects of IR, not captured by dual-energy X-ray absorptiometry (DXA) measurements of BMD, that weaken bone.
It is not clear whether the net effect of IR is favorable or unfavorable for the risk of fractures. It is possible that being positively associated with BMD, IR reduces fracture risk. On the other hand, T2D is associated with higher fracture risk in spite of higher BMD, and IR may have a similar relationship to fracture. To the best of our knowledge, no studies have specifically assessed the relationship among IR, BMD, and fracture risk in nondiabetic individuals. It is important to examine this relationship separately from the effects of frank diabetes, as longstanding hyperglycemia and certain antidiabetic medications may affect bone structure and fracture risk (17). We used data from the Health, Aging and Body Composition (Health ABC) Study to assess the relationship between IR and fracture risk, independent of body size and bone density, in older adults without diabetes.
Materials and Methods
Study population
As previously described (18), the Health ABC Study recruited a healthy cohort of 3075 white and black men and women (48.4% men, 41.6% black), aged 70 to 79 at baseline (1997 to 1998) from two U.S. field centers (Pittsburgh, Pennsylvania, and Memphis, Tennessee). The Health ABC Study is a prospective cohort study designed to investigate if changes in body composition act as a common pathway by which multiple diseases affect morbidity, disability, and risk of mortality in community-dwelling older adults. Participants were recruited by mail from specified zip codes surrounding Memphis, Tennessee, and Pittsburgh, Pennsylvania, followed by a telephone-eligibility screen. White participants were recruited from a random sample of Medicare beneficiaries. Black participants were recruited from Medicare beneficiaries and all age-eligible residents in these areas. Eligibility criteria included self-report of no difficulty with mobility (walking one-quarter mile and climbing 10 stairs) or performing activities of daily living, no life-threatening cancers with active treatment within the past 3 years, and no plans to move out of the area in the next 3 years. The study protocol was approved by the Institutional Review Boards at the Universities of Pittsburgh and Tennessee, and all participants provided informed consent. Of the 3075 subjects in the entire cohort, 576 participants with diabetes at baseline were excluded; we also excluded 101 nondiabetic subjects with missing baseline data for glucose metabolism characterization. Diabetes was identified based on self-report of diabetes previously diagnosed by a physician, use of hypoglycemic medications, or fasting glucose ≥126 mg/dL (≥7.0 mM), in accordance with the American Diabetes Association criteria (19).
Measurements
At the baseline, clinic-visit data were obtained on self-reported demographic information, medical conditions, and medication use. Measurements of height and weight, DXA hip scans, and a fasting blood sample were obtained. Body mass index (BMI) was calculated as weight in kilograms divided by height in meters squared. Areal BMD (aBMD; grams per square centimeters) of the total hip was assessed by dedicated proximal femur DXA scans using Hologic QDR 4500 A systems (Hologic, Inc., Bedford, MA). Fasting glucose and insulin were measured at the Laboratory of Clinical Biochemistry at the University of Vermont. Insulin was measured using a microparticle enzyme immunoassay on the Abbot IMxTM (Abbott Laboratories Diagnostics Division, South Pasadena, CA). Glucose was measured on a Johnson and Johnson Vitros 950 analyzer (Ortho-Clinical Diagnostics; Johnson and Johnson, Rochester, NY). The homeostasis model assessment (HOMA)-IR index was calculated using the HOMA calculator website of the Diabetes Trial Unit University of Oxford Centre for Diabetes, Endocrinology and Metabolism of the University of Oxford (20). Serum creatinine was also measured at the Laboratory of Clinical Biochemistry at the University of Vermont on a Johnson and Johnson Vitros 950 analyzer. Estimated glomerular filtration rate (eGFR) at baseline was calculated with the abbreviated Modification of Diet in Renal Disease equation (21).
Participants were queried every 6 months regarding occurrence of a fracture (excluding ribs, chest/sternum, skull/face, fingers, and toes) for up to 15 years of follow-up from the baseline visit. Only nonspine fractures are included in these analyses (excluding ribs, chest/sternum, skull/face, fingers, toes, and cervical vertebra or neck). Reports of nonspine fracture were verified by a radiology report, and only events adjudicated as a fracture were included. Fractures resulting from excessive trauma or a pathological condition were excluded. If a participant experienced multiple nonspine fractures, only the first fracture was included.
Statistical analyses
We used descriptive statistics (mean and SD for continuous variables and percentages for categorical variables), along with ANOVA and χ2 test, as appropriate, to compare the sample characteristics across quartiles of a HOMA-IR index. The difference in total hip BMD (grams per square centimeters) across HOMA-IR quartiles was evaluated using linear mixed models with site of enrollment included as a random effect; the coefficients of these models reflect the absolute difference in mean BMD between each group and the reference group (first quartile). The estimates were adjusted for age, sex, race, clinic site, and eGFR. To provide more insight into the role of BMI on the relationship of interest, this variable was added in a subsequent model, also including the other confounders.
Cox proportional hazard models were used to assess the association between quartiles of HOMA-IR and incident fracture. No violation of the proportional hazard assumption was found by the evaluation of the correlation between time and scaled Schoenfeld’s residuals. The same set of covariates used for the analysis of BMD described above was used. In addition, total hip BMD was added to the model. As overt renal insufficiency may impact bone health, proportional hazards analyses were also performed, excluding 16 participants with eGFR <30 mL/min/1.73 m2 as a sensitivity analysis to test the robustness of results.
All of the analyses were performed using R version 3.4 for Linux (2017; R Foundation for Statistical Computing, Vienna, Austria).
Results
Study population
The sample included 2398 subjects without diabetes. Mean age was 73.6 ± 2.9, 53.1% were women, and 37.5% were black. Median follow-up for fracture was 11.9 (interquartile range: 6.3) years. The cut-off values for the HOMA-IR quartiles were 1.053, 1.545, and 2.333. Subject characteristics by HOMA index quartile are presented in Table 1. BMI was higher across increasing HOMA-IR quartiles. The percentage of subjects taking oral glucocorticoids, which could affect both bone and glucose metabolism, was small and similar across HOMA-IR quartiles.
Baseline Characteristics by HOMA-IR Quartile for Participants Without Diabetes in the Health ABC Study
| HOMA-IR First QTL (0.019–1.050), n = 603 | HOMA-IR Second QTL (1.053–1.540), n = 596 | HOMA-IR Third QTL (1.545–2.330), n = 600 | HOMA-IR Fourth QTL (2.333–17.450), n = 599 | P Value | |
|---|---|---|---|---|---|
| Age | 73.9 (2.9) | 73.5 (2.8) | 73.6 (2.9) | 73.4 (2.9) | 0.065a |
| Sex, women, % | 56.7 | 48.3 | 53.3 | 53.9 | 0.032b |
| Race, black, % | 30.2 | 35.2 | 37.8 | 46.7 | <0.001b |
| Hip total BMD, g/cm2 | 0.82 (0.16) | 0.86 (0.17) | 0.88 (0.16) | 0.92 (0.16) | <0.001a |
| BMI, kg/m2 | 24.1 (3.7) | 26.2 (4.0) | 27.4 (3.8) | 30.4 (4.9) | <0.001a |
| Fasting glucose, mg/dL | 86.6 (7.3) | 91.4 (8.0) | 95.0 (9.0) | 100.2 (9.5) | <0.001a |
| Fasting insulin, mU/mL | 3.67 (0.95) | 5.74 (0.73) | 8.14 (1.13) | 14.65 (6.36) | <0.001a |
| eGFR, mL/min/1.73 m2 | 73.8 (15.9) | 72.8 (15.2) | 71.4 (16.1) | 71.2 (15.8) | 0.009a |
| Oral glucocorticoid use, % | 2.2 | 2.0 | 3.0 | 1.8 | 0.537b |
Data are means (SD) or percent (n). eGFR is calculated with the abbreviated Modification of Diet in Renal Disease equation.
Abbreviation: QTL, quartile.
ANOVA.
χ2 test.
BMD
Total hip BMD was higher across increasing quartiles of HOMA-IR (Table 1). In unadjusted analyses, a mean difference in total hip BMD of 0.104 g/cm2 (P < 0.001) was found comparing the lowest (first) and highest (fourth) quartiles of HOMA-IR (Table 2). After adjustment for covariates, including BMI, the relationship was attenuated (mean difference 0.007 g/cm2) and not statistically significant (P = 0.371); test for linear trend was not significant (P = 0.209). The results were similar when we repeated the analyses excluding the 54 subjects who were taking oral glucocorticoids (data not shown).
Mean Differences (Grams Per Square Centimeters) in Total Hip BMD by Quartiles of HOMA-IR
| HOMA-IR | Crude Model | Adjusted Model 1 | Adjusted Model 2 |
|---|---|---|---|
| Difference (Value) | Difference (Value) | Difference (Value) | |
| First QTL | Reference | Reference | Reference |
| Second QTL vs first QTL | 0.041 (P < 0.001) | 0.020 (P = 0.009) | −0.006 (P = 0.426) |
| Third QTL vs first QTL | 0.059 (P < 0.001) | 0.045 (P < 0.001) | 0.004 (P = 0.56) |
| Fourth QTL vs first QTL | 0.104 (P < 0.001) | 0.080 (P < 0.001) | 0.007 (P = 0.371) |
| P for linear trend | 0.209 |
Mixed linear model. Model 1 adjusted for age, sex, race, eGFR, clinic site. Model 2 adjusted for Model 1 variables plus BMI. eGFR is calculated with the abbreviated Modification of Diet in Renal Disease equation.
Fracture risk
The cumulative follow-up time was 23,905 person-years, and 405 participants experienced at least one nonspine fracture. Unadjusted models showed a lower risk of fractures in the highest HOMA-IR quartile [hazard ratio (HR) 0.65, 95% CI 0.47 to 0.89] compared with the first quartile. With the adjustment for demographics and eGFR, a similar trend existed, but the association was not significant. After further adjustment for BMI and BMD, the trend shifted toward an increased fracture risk in those with greater HOMA-IR, although this association was not significant (P for trend = 0.215; Table 3 and Fig. 1). Fracture risk was not elevated in the second quartile compared with the first (lowest) quartile (HR 1.01; 95% CI 0.92 to 1.10). A statistically significant increase in fracture risk was observed in the third quartile compared with the first quartile (HR 1.19; 95% CI 1.00 to 1.41). A similar increase, although not statistically significant, was observed in the fourth quartile compared with the first quartile (HR 1.12; 95% CI 0.87 to 1.46). Similar point estimates were obtained when 16 participants with eGFR <30 mL/min/1.73 m2 were excluded (Table 4). Likewise, results were comparable after the exclusion of those on oral glucocorticoids (data not shown).
Association Among Quartiles of HOMA-IR and Risk of Nonspine Fracture
| Crude Model | Adjusted Model 1 | Adjusted Model 2 | Adjusted Model 3 | ||
|---|---|---|---|---|---|
| HOMA-IR | n | HR (95% CI) | HR (95% CI) | HR (95% CI) | HR (95% CI) |
| First QTL | 603 | 1.00 (ref) | 1.00 (ref) | 1.00 (ref) | 1.00 (ref) |
| Second QTL vs first QTL | 596 | 0.85 (0.72–1.00) | 0.95 (0.84–1.08) | 1.02 (0.88–1.18) | 1.01 (0.92–1.10) |
| Third QTL vs first QTL | 600 | 0.86 (0.73–1.01) | 0.97 (0.84–1.12) | 1.10 (0.94–1.30) | 1.19 (1.00–1.41) |
| Fourth QTL vs first QTL | 599 | 0.65 (0.47–0.89) | 0.79 (0.59–1.05) | 1.00 (0.72–1.39) | 1.12 (0.87–1.46) |
| P for linear trend | 0.215 |
Model 1 adjusted for age, sex, race, eGFR, clinic site. Model 2 adjusted for Model 1 variables plus BMI. Model 3 adjusted for Model 2 variables plus total hip BMD. eGFR is calculated with the abbreviated Modification of Diet in Renal Disease equation.
Abbreviation: ref, reference.
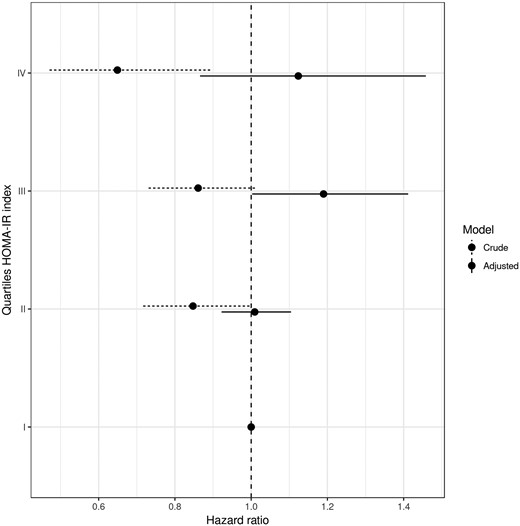
Crude and adjusted HR for nonspine fracture in older adults, according to quartiles of HOMA-IR index. Model adjusted for age, sex, race, clinic site, eGFR, BMI, total hip BMD. eGFR is calculated with the abbreviated Modification of Diet in Renal Disease equation.
Association Among Quartiles of HOMA-IR and Risk of Nonspine Fracture (Sensitivity Analysis: 16 Participants With eGFR <30 mL/min/1.73 m2 Were Excluded)
| Crude Model | Adjusted Model 1 | Adjusted Model 2 | Adjusted Model 3 | ||
|---|---|---|---|---|---|
| HOMA-IR | n | HR (95% CI) | HR (95% CI) | HR (95% CI) | HR (95% CI) |
| First QTL | 597 | 1.00 (ref) | 1.00 (ref) | 1.00 (ref) | 1.00 (ref) |
| Second QTL vs first QTL | 594 | 0.85 (0.69–1.05) | 0.95 (0.80–1.13) | 1.02 (0.85–1.24) | 1.01 (0.88–1.16) |
| Third QTL vs first QTL | 597 | 0.84 (0.69–1.03) | 0.95 (0.79–1.14) | 1.08 (0.88–1.34) | 1.17 (0.94–1.46) |
| Fourth QTL vs first QTL | 594 | 0.65 (0.48–0.88) | 0.79 (0.60–1.05) | 1.01 (0.72–1.41) | 1.13 (0.86–1.48) |
| P for linear trend | 0.260 |
Model 1 adjusted for age, sex, race, eGFR, clinic site. Model 2 adjusted for Model 1 variables plus BMI. Model 3 adjusted for Model 2 variables plus total hip BMD. eGFR is calculated with the abbreviated Modification of Diet in Renal Disease equation.
There was no evidence of a linear relationship between HOMA-IR and fracture risk in the model adjusted for BMI and BMD (P = 0.215). Instead, the pattern of fracture risk suggested a threshold effect with the increased risk limited to those in the upper two quartiles of HOMA-IR. When we compared fracture risk in those with HOMA-IR above the median (1.54) and those below the median, the HR was 1.16 (95% CI: 0.99 to 1.36, P = 0.067).
Discussion
We assessed the relationship between IR and fracture risk in nondiabetic older adults. In unadjusted models, increasing IR was associated with lower risk of fracture. After the adjustment for BMI and BMD, this relationship was lost, suggesting that the inverse association is explained by higher BMD and BMI associated with IR.
It is difficult to make comparisons with other studies. Information on IR and fracture risk can be inferred from studies that assessed the relationship between the metabolic syndrome, of which IR is a main feature (22, 23). A recent meta-analysis of five prospective studies demonstrated that the metabolic syndrome was significantly associated with a lower fracture risk (pooled relative risk = 0.76, 95% CI: 0.59–0.97, P = 0.026) (24). When the analyses were restricted to the four studies with additional adjustment for BMI, the association was no longer significant, similar to our results. Only one study provided the results with BMD adjustment, showing that the metabolic syndrome was associated with a lower risk of fractures independent of BMD (pooled relative risk = 0.33, 95% CI: 0.15–0.76) (24, 25), in contrast with our findings.
Other studies have considered whether those with prediabetes, a condition associated with higher IR, have increased fracture risk. Some studies have found that prediabetes, adjusted for BMI and/or BMD, is associated with lower fracture risk (26, 27) whereas others have reported no statistically significant difference in fracture risk, although some point estimates suggest increased risk (4, 5). Likewise, we found a trend toward an increased fracture risk with higher IR in models adjusted for BMI and BMD. However, those with prediabetes in previous studies were selected based on hyperglycemia and not IR. These two factors may have different relationships with fracture risk.
Similar to other studies, we found that BMD increased with increasing HOMA-IR (28). However, the association between IR and BMD lost significance after adjustment for BMI, suggesting that the relationship is confounded by body size. A large body of evidence supports an association between IR and BMD that is largely accounted for by the association between IR and greater body size (13, 14, 16). Nonetheless, both clinical and preclinical evidence suggests a direct effect of IR on BMD, which may be additive to mechanical loading on the skeleton as a result of greater body size. Increased insulin levels to compensate for IR may increase bone mass as a result of the anabolic effect of insulin on bone (28). Other possible mechanistic links between IR and increased BMD include reduced bone turnover with a more pronounced reduction in bone resorption vs bone formation, synergistic effects of excess insulin with other anabolic hormones (i.e., amylin, parathyroid hormone, insulin-like growth factor) (28), genetic factors (29), and increased free concentrations of androgens and estrogens as a result of a negative impact of hyperinsulinemia on sex hormone-binding globulin (30).
In our study, after adjustment for hip BMD, an intermediary in the relationship between IR and fractures, IR, above the median, tended to be associated with increased fracture risk, although results were not statistically significant (P = 0.067). This suggests that IR may affect fracture risk through pathways, in addition to higher aBMD, possibly through effects on bone quality and/or fall-risk factors. Some previous studies have examined the effects of IR on aspects of bone quality other than BMD. In the Midlife in the United States (MIDUS II) Study, which included both subjects without and with prediabetes/diabetes, the authors found no association between prediabetes and femoral strength indexes in unadjusted and adjusted (age, sex, race/ethnicity, menopause transition stage in women, study site, and BMI) models (31). Conversely, in nondiabetic men, at the age of peak bone mass, IR was inversely associated with trabecular and cortical bone size, as well as with cortical bone strength, independent of body composition, muscle size or function, or sex steroid levels (32). Similar findings were observed in a recent study in Japanese men in whom HOMA-IR was inversely correlated with trabecular bone score after adjustment for BMI and aBMD (33). Recently, Shanbhogue and colleagues (15) found an association between IR and smaller bone size, greater volumetric BMD, and generally favorable bone microarchitecture in nondiabetic postmenopausal women. These associations were consistent for both weight-bearing and nonweight-bearing skeletal sites and were independent of body weight and other potential covariates, suggesting that hyperinsulinemia directly affects bone structure, independent of body mass (15).
IR may also increase fracture risk, independent of BMI and BMD, through more frequent falls. We are not aware of studies of IR and falls. However, metabolic syndrome is reported to be associated with increased risk of falls (34). Evidence also exists that IR is associated with risk factors for falls, including lower skeletal muscle mass (35, 36) and strength (37, 38). No specific biomarkers of bone health in insulin-resistant states have been identified. However, markers of bone formation (osteocalcin) and resorption (collagen type 1-crosslinked C-terminal telopeptide) and indexes of bone strength, which have been reported to be reduced in IR (31, 32, 39, 40), might be used in conjunction with BMD to provide a more complete picture of bone health and possibly fracture risk in insulin-resistant individuals.
Our study has limitations. Use of HOMA-IR to estimate IR is a limitation, as the gold standard to measure IR is the hyperinsulinemic euglycemic clamp technique (41), which can detect peripheral IR, even in subjects with normal glucose tolerance (42). The HOMA model is widely used, and it is acknowledged that when used appropriately, it is a reliable index of IR (43). Nonetheless, use of HOMA-IR may have resulted in some misclassification of IR status. Any misclassification is unlikely to be associated with the outcomes of BMD or fracture and would therefore be expected to attenuate any real associations between IR and these outcomes. Furthermore, HOMA-IR, BMI, and BMD were measured at baseline only and may change over time. Another potential limitation is a result of the design of the Health ABC study, which aimed to provide information on risk factors for function decline in healthier elderly persons. As such, the study population was somewhat healthier and initially less functionally impaired than the general elderly population. A strength of the study is inclusion of black and white participants. However, other racial/ethnic groups were not recruited. Thus, our results may not be generalizable to the most frail, to other racial/ethnic groups in the United States, or to those in other countries. Finally, given its observational nature, it is possible that unidentified or unmeasured confounders may have biased our observed associations. As an example, serum 25-hydroxyvitamin D, which is an important determinant of bone health and was found to be inversely associated with IR at 5 years in a large, prospective, population-based cohort study (44), was not measured at baseline. This study has notable strengths, including the novelty of examining IR and risk of incident nonspine fractures among nondiabetic older adults. Moreover, the longitudinal design and long follow-up for incident fractures with HOMA-IR, measured before the outcomes, allow the ascertainment of temporal relationships. Finally, fractures were adjudicated after self-report, ensuring high specificity and avoiding bias of the risk ratio even with lower sensitivity (45).
In conclusion, we found that IR was associated with lower fracture risk in unadjusted analyses. IR is also associated with higher BMI and BMD. With adjustment for these factors, there was no longer evidence of an inverse association between IR and fracture risk.
Acknowledgments
The findings and conclusions in this report are those of the authors and do not necessarily represent the official position of the Centers for Disease Control and Prevention.
Financial Support: This work was supported by the National Institute on Aging (NIA) Contracts N01-AG-6-2101, N01-AG-6-2103, and N01-AG-6-2106 and NIA Grant R01-AG028050 and National Institute of Nursing Research Grant R01-NR12459. This research was supported, in part, by the Intramural Research Program of the NIA, National Institutes of Health.
Disclosure Summary: The authors have nothing to disclose.
Abbreviations:
- aBMD
areal bone mineral density
- BMD
bone mineral density
- BMI
body mass index
- DXA
dual-energy X-ray absorptiometry
- eGFR
estimated glomerular filtration rate
- Health ABC Study, Health
Aging and Body Composition Study
- HOMA
Homeostatic Model Assessment
- HR
hazard ratio
- IR
insulin resistance
- T2D
type 2 diabetes
References
University of Oxford, Diabetes Trials Unit, The Oxford Centre for Diabetes, Endocrinology and Metabolism. HOMA2 Calculator. Available at: http://www.dtu.ox.ac.uk/homacalculator/. Accessed September 2017.
Author notes
N.N. and C.C. contributed equally to this study.
