


Abstract
Hypoglycemic drugs with proven cardiovascular (CV) benefits are recommended for patients with type 2 diabetes and CV disease. Whether the beneficial effects extend to those at lower risk remains unclear.
We investigated the long-term CV effects of pioglitazone or sulfonylureas (SUs) across the spectrum of pretreatment CV risk.
Among 2820 participants of the TOSCA.IT trial, four subgroups with different risk of outcome—a composite of all-cause death, nonfatal myocardial infarction, nonfatal stroke, urgent coronary revascularization—were identified by the RECursive Partitioning and AMalgamation (RECPAM) method. Within each group, the effect of SUs or pioglitazone on the outcome was evaluated.
Sex was the first splitting variable, followed by urinary albumin-to-creatinine ratio (UACR) (>9 mg/g or ≤9 mg/g) and body mass index (BMI) (>28.7 or ≤28.7 kg/m2). Female patients had the lowest risk (reference); male patients with UACR >9 mg/g and BMI >28.7 kg/m2 had the highest risk [hazard ratio (HR), 5.58; 95% CI, 3.32 to 9.69]. Patients in this group present a cluster of conditions suggestive of marked insulin resistance (higher BMI, waist circumference, triglycerides, blood pressure, and UACR and lower high-density lipoprotein cholesterol) than the other groups. Treatment with pioglitazone in this group was associated with a significantly lower occurrence of the outcome than SUs (HR, 0.48; 95% CI, 0.25 to 0.76). No significant difference between study treatments was observed in the other RECPAM classes.
It is possible to identify patients with type 2 diabetes early in the stage of their disease and who are largely free from evident CV disease in whom add-on pioglitazone to metformin confers CV protection as compared with SUs.
Over the past two decades, the variety of glucose-lowering agents available for treating type 2 diabetes mellitus (T2DM) has increased substantially. As a consequence, the management of patients with this condition has become increasingly complex (1, 2). Glucose-lowering drugs with proven cardiovascular (CV) benefits, such as the sodium glucose cotransporter 2 inhibitors (SGLT2i) and glucagon-like peptide 1 receptor agonists, are the recommended choice after metformin failure in patients with manifest CV disease or prior CV events (3). The recommendation is supported by the positive results of recent trials that have enrolled exclusively or primarily people with T2DM and prior CV events or established atherosclerotic CV disease (4–7).
Diabetes is a heterogeneous disease that encompasses a wide range of CV risk (8, 9). Patients with a prior CV event, although common, represent a minority of those with type 2 diabetes in the real world (10), and there is no clear evidence that the beneficial CV effects apply to patients in an earlier stage of the disease, without clinically evident CV disease (CVD). A recent meta-analysis of SGLT2i CV outcome trials incorporating data from EMPA-REG OUTCOME, the CANVAS Program, and DECLARE-TIMI trials shows that the clinical benefits of SGLT2i on major adverse atherosclerotic CV events are confined to patients with established atherosclerotic CVD and are not evident in those with multiple risk factors alone (11). In a post hoc analysis of the LEADER trial, liraglutide reduced the occurrence of CV outcomes in patients with a prior myocardial infarction/stroke and in those with established atherosclerotic CVD, but the effect appeared neutral in patients with multiple risk factors for atherosclerotic CVD and no prior events (12). Furthermore, these trials are of relatively short duration and are placebo controlled and therefore do not provide a comparative risk-to-benefit balance of different drugs in the long term. The choice of the second-line drug/drug class to use in addition to metformin in people without established CVD and suboptimal glucose control remains debated because there is limited evidence of the long-term effects of drug combinations on hard outcomes. Current guidelines are not highly prescriptive and allow the use of different drug classes, the choice between them being made on the basis of the overall side effects profile and financial constraints. In particular, when cost is a major issue, sulfonylureas (SUs) and pioglitazone may be considered (3, 13, 14). The TOSCA.IT study is, to date, the only CV outcome trial with a head-to-head comparison of two active drugs (i.e., pioglitazone or SUs) used as add-on to metformin in patients with T2DM with low to moderate CV risk who are largely free from prior CV events. The study showed no difference between the two drugs with respect to the primary endpoint (i.e., a composite of fatal and nonfatal CV events and all cause death) (15). Diabetes, however, is a complex and heterogeneous condition (16), and the average effect of the trial may not apply equally to all participants. Therefore, we have investigated the long-term effects of pioglitazone or an SU add-on to metformin on the occurrence of CV events and survival in patients with T2DM across the spectrum of risk of outcome at the time of recruitment into the study.
Methods
TOSCA.IT is a pragmatic trial designed to evaluate the effects of add-on pioglitazone or an SU on CV events in people with T2DM inadequately controlled with metformin monotherapy. The study protocol and the main results have been published (15–17). Briefly, 3028 patients with T2DM with unsatisfactory glucose control (HbA1c ≥7 and ≤9%) while on ≥2 g/d metformin monotherapy were recruited at 57 centers and randomized to pioglitazone or an SU and followed for a median period of 57.3 months (interquartile range, 42.2 to 60.2). Patients with serum creatinine ≥1.5 mg/dL or heart failure (New York Heart Association class 2 or higher) were excluded from the study. At baseline and follow-up visits, data were collected on anthropometric measures, blood pressure, smoking, use of drugs, and CV history. Plasma lipids, HbA1c, C-reactive protein, plasma creatinine, and urinary albumin-to-creatinine ratio (UACR) on spot urine samples were measured at a central laboratory. The primary endpoint of the trial was a composite of first occurrence of all-cause death and nonfatal myocardial infarction, including silent myocardial infarction, nonfatal stroke, or urgent coronary revascularization. All outcomes were adjudicated by an independent endpoint committee. The study protocol was approved by the ethics committees of the coordinating center (approval number 123/08) and each participating center. All participants signed a written informed consent before entering the study. For the purposes of the present analysis, only patients with complete baseline dataset of interest were included (n = 2820); patients with missing data were equally distributed in the two treatment arms. The primary endpoint of the trial was used as the outcome.
Statistical analysis
Within the study population, we identified homogenous subgroups with different CV risk at study entry as determined on the basis of routine patient characteristics and evaluated the effect of pioglitazone vs SUs on the outcome of interest by a regression tree–based method that integrates standard Cox regression analysis (main effects) and the tree-growing techniques interactions [RECursive Partitioning and Amalgamation (RECPAM)] (18, 19). At each partitioning step, independently of the user, the method selects the covariate and its best binary split to maximize differences between SU and pioglitazone (determinant) in the risk of developing the outcome of interest. The algorithm stops when user-defined conditions are met (stopping rules). RECPAM analysis considered a minimum set of 30 endpoints and 200 subjects per node. The covariates were entered into the RECPAM model without classifying continuous covariates. This allows the algorithm to select the best cut-off point. Included parameters were age (as global adjustment), sex, smoking, dyslipidemia, retinopathy, previous CV events, hypertension, positive family history for CV events, UACR, C-reactive protein, body mass index (BMI), systolic and diastolic blood pressure, low-density lipoprotein cholesterol, HbA1c, non-high-density lipoprotein (HDL) cholesterol, and diabetes duration.
A “pruned” tree derived from RECPAM analysis was represented by a categorical covariate that summarized significant covariates.
Descriptive data were expressed as mean (SD) for continuous covariates and as n (%) for categorical covariates by RECPAM classes. The characteristics of the study participants were compared between groups using the χ2 statistic (or two-sided Fisher exact test) and Kruskal-Wallis one-way ANOVA, as appropriate.
Two Cox regression analyses were performed: the first with the “pruned” tree and the global adjustment by age and the second with the RECPAM classes forced in and other covariates by a backward selection to highlight the role of additional covariates as main effects. Data from the patients who completed or discontinued the study without having an outcome were censored on the day of their last visit; events occurring after that visit were not included. The results of the Cox models are expressed as adjusted hazard ratios (HRs) and 95% CIs. Covariates were selected based on clinical judgement. BMI was used in all statistical models, whereas waist circumference was only used for descriptive purposes. In the RECPAM class with the highest risk of events, we determined incidence rates using cumulative incidence curves, which were compared (metformin plus pioglitazone vs metformin plus SUs) using log-rank test. All statistical analyses were performed with SAS Statistical Package Release 9.4 (SAS Institute, Cary, NC). The P values are two sided and are not adjusted for multiple comparisons.
Results
A total of 2820 patients with complete baseline data of interest were included in this analysis. The general characteristics of the study population are given in Table 1. Nearly 60% were men, average age was 62 years, BMI was 30 kg/m2, and diabetes duration was 8.5 years. Prior CVD was reported by 11.2% of the participants; a large proportion of the patients was on antihypertensive and/or lipid-lowering medications (69.6 and 57.3, respectively), and 42% were taking antiplatelet agents. Average blood pressure and plasma lipids values were close to treatment targets (20).
Baseline Characteristics of the Study Participants
| Overall Population (N = 2820) | |
|---|---|
| Men, % | 59.3 |
| Age, y | 62.3 ± 6.5 |
| Current smokers, n (%) | 501 (17.8) |
| Diabetes duration, y | 8.5 ± 5.7 |
| BMI, kg/m2 | 30.3 ± 4.5 |
| Waist circumference, cm | 104.4 ± 11.2 |
| HbA1c, % | 7.7 ± 0.5 |
| LDL-cholesterol, mg/dL | 103.3 ± 31.6 |
| HDL-cholesterol, mg/dL, | 46.3 ± 11.7 |
| Triglycerides, mg/dL | 147.0 ± 65.7 |
| Systolic blood pressure, mm Hg | 134.1 ± 14.7 |
| Diastolic blood pressure, mm Hg | 79.7 ± 8.5 |
| C-reactive protein, mg/dL | 0.4 ± 1.7 |
| UACR, mg/g (IQR) | 41.8 (3.0–25.0) |
| With microalbuminuria, % | 21.9 |
| Serum creatinine, mg/dL | 0.8 ± 0.2 |
| Previous CVD, % | 11.2 |
| On antihypertensive drugs, % | 69.6 |
| On lipid-lowering drug, % | 57.3 |
| On antiplatelet agents, % | 42.5 |
Abbreviations: IQR, interquartile range; LDL, low-density lipoprotein.
By RECPAM analysis, four distinct patient subgroups with increasing risk were identified (Fig. 1). The splitting algorithm indicated that the primary driver of selection was sex; in fact, all women clustered in class 1, the class with lowest risk (Fig. 1). Among men, UACR ratio with a cutoff of 9 mg/g (i.e., close to the limit for high-normal UACR) and BMI with a cutoff of 28.7 kg/m2 (i.e., close to the standard definition for obesity) further differentiated the risk of outcome. Three distinct groups were identified: men with UACR ≤9 mg/g (class 2), men with UACR >9 mg/g and BMI ≤28.7 kg/m2 (class 3), and men with albumin excretion rate >9 mg/g and BMI >28.8 kg/m2 (class 4). The crude rates for the occurrence of the endpoint over a median period of 4.8 years ranged from 0.8 per 100 patient/year in class 1 to 2.4 per 100 patient/year in class 4. Baseline characteristics of the individuals for each RECPAM class are shown in Table 2. Patients in class 4 (i.e., the subgroup with the highest incidence of outcome), in addition to having higher UACR and BMI, had larger waist circumference, lower HDL cholesterol, higher triglycerides, triglycerides-to-HDL ratio, and higher blood pressure as compared with other classes. The use of lipid-lowering drugs, antihypertensive medications, and platelet aggregation inhibitor agents was more common in this group. The prevalence of a prior CV event was 19.7%, which was significantly higher than in other RECPAM classes but still relatively low, so that the large majority of the people in this class had no clinically evident CVD.
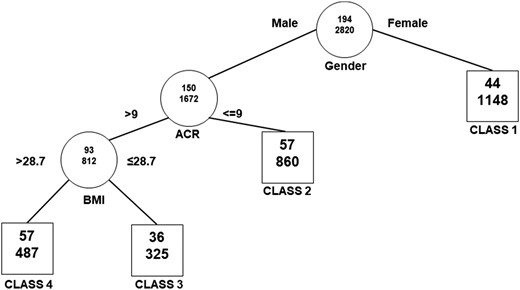
Tree structure for the identification of patient subgroups with different characteristics and different risk of outcome. RECPAM risk classes for primary composite outcome. Circles represent splitting nodes; squares represent the final classes. The first number in each figure represents the total number of patients with the event; the second number represents the total number of patients included in the group.
Baseline Characteristics of the Study Participants by RECPAM Class
| Class 4 | Class 3 | Class 2 | Class 1 | P Value | |
|---|---|---|---|---|---|
| n | 487 | 325 | 860 | 1148 | — |
| Randomized to pioglitazone, % | 51.1 | 49.8 | 51.4 | 49.8 | 0.89 |
| Age, y | 62.0 ± 6.6 | 63.3 ± 6.6 | 61.8 ± 6.5 | 62.6 ± 6.4 | 0.0007 |
| Retinopathy, % | 11.7 | 8.6 | 6.7 | 7.0 | 0.0012 |
| With microalbuminuria, % | 54.0 | 44.9 | — | 18.2 | <0.0001 |
| Current smokers, % | 23.0 | 23.7 | 18.0 | 13.7 | <0.0001 |
| Diabetes duration, y | 7.7 ± 5.2 | 9.2 ± 6.0 | 8.4 ± 5.6 | 8.7 ± 5.8 | 0.0021 |
| BMI, kg/m2 | 32.6 ± 3.0 | 26.3 ± 1.7 | 29.3 ± 4.0 | 31.1 ± 5.0 | <0.0001 |
| Waist circumference, cm | 111.9 ± 9.0 | 98.6 ± 8.3 | 104.1 ± 10.6 | 103.1 ± 11.7 | <0.0001 |
| HbA1c, % | 7.8 ± 0.5 | 7.7 ± 0.5 | 7.7 ± 0.5 | 7.6 ± 0.5 | <0.0001 |
| LDL cholesterol, mg/dL | 101.8 ± 32.3 | 101.9 ± 32.1 | 101.4 ± 30.6 | 105.7 ± 31.7 | 0.0104 |
| HDL cholesterol, mg/dL | 41.4 ± 9.5 | 45.2 ± 10.9 | 44.3 ± 11.4 | 50.2 ± 11.8 | <0.0001 |
| Triglycerides, mg/dL | 167.6 ± 73.3 | 138.4 ± 66.6 | 140.9 ± 64.6 | 145.4 ± 61.1 | <0.0001 |
| Triglycerides-to-HDL ratio | 4.5 ± 2.7 | 3.4 ± 2.2 | 3.6 ± 2.3 | 3.2 ± 2.0 | <0.0001 |
| Systolic blood pressure, mm Hg | 137.1 ± 15.1 | 134.7 ± 14.2 | 132.5 ± 14.0 | 133.9 ± 14.9 | <0.0001 |
| Diastolic blood pressure, mm Hg | 81.8 ± 9.4 | 80.1 ± 7.8 | 79.7 ± 8.4 | 78.6 ± 8.1 | <0.0001 |
| Previous CVD, % | 19.7 | 17.2 | 13.0 | 4.5 | <0.0001 |
| On antihypertensive drugs, % | 74.5 | 67.1 | 61.5 | 74.4 | <0.0001 |
| On lipid-lowering drugs, % | 61.2 | 53.8 | 52.4 | 60.2 | 0.0008 |
| On antiplatelet agents, % | 48.5 | 47.4 | 42.7 | 38.4 | 0.0004 |
Abbreviation: LDL, low-density lipoprotein.
Two Cox regression analyses based on RECPAM classes, with and without backward selection, yielded very similar results (Table 3). In each model, the effect of RECPAM class and the effect of treatment within each class were evaluated. Compared with the reference group (class 1), multivariate adjusted HR for the outcome was 1.96 for class 2, 2.48 for class 3, and 4.62 for class 4 (Table 3). In the latter group, use of pioglitazone, as compared with SUs, was associated with a 52% reduction in the risk of outcome (HR, 0.48; 95% CI, 0.25 to 0.76). Cumulative incidence curves of the primary outcome in class 4 by treatment are shown in Fig. 2. No significant difference between study treatments in relation to the incidence of outcomes was apparent in other classes.
Cox Proportional Hazards Derived From RECPAM Analysis
| Model 1, HR (95% CI) | Model 2, HR (95% CI) | |
|---|---|---|
| RECPAM Class 2 vs Class 1 | 2.04 (1.13–3.67) | 1.96 (1.08–3.55) |
| RECPAM Class 3 vs Class 1 | 2.83 (1.44–5.86) | 2.48 (1.25–4.93) |
| RECPAM Class 4 vs Class 1 | 5.58 (3.32–9.69) | 4.62 (2.62–8.14) |
| Pioglitazone vs SUs, RECPAM Class 1 | 1.38 (0.76–2.50) | 1.30 (0.71–2.36) |
| Pioglitazone vs SUs, RECPAM Class 2 | 1.09 (0.65–1.83) | 1.05 (0.62–1.77) |
| Pioglitazone vs SUs, RECPAM Class 3 | 1.56 (0.81–3.04) | 1.46 (0.75–2.84) |
| Pioglitazone vs SUs, RECPAM Class 4 | 0.48 (0.25–0.76) | 0.45 (0.26–0.78) |
| Age, y (continuous) | 1.05 (1.03–1.07) | 1.06 (1.03–1.08) |
| Smoker (yes) | — | 1.93 (1.40–2.67) |
| Previous CVD (yes) | — | 1.94 (1.36–2.76) |
| PCR, mg/dL | — | 1.06 (1.03–1.08) |
| Non-HDL cholesterol, mg/dL | — | 1.01 (1.00–1.01) |
Model 1 includes RECPAM classes and age. Model 2 includes model 1 plus covariates identified as main effects.
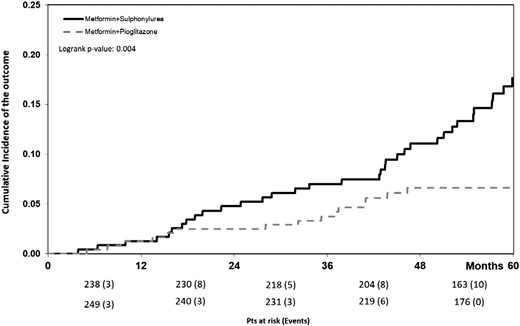
Cumulative incidence of the outcome in the high-risk RECPAM class 4 group by treatment. Pts, patients.
Discussion
Diabetes is a complex and heterogeneous condition requiring educated guidance for treatment individualization (21). We found that among subjects with T2DM with relatively low CV risk and who were generally free of established CV events, risk stratification based on routinely available clinical features can identify those who may have better outcome when treated with pioglitazone as compared with SUs. By using a relatively simple procedure, it was possible to identify four distinct clusters with increasing risk of outcome. The risk increased by fivefold in the highest risk group as compared with the reference group (HR, 5.58; 95% CI, 3.32 to 9.69) (Table 3). Patients within this high-risk group have classic features of marked insulin resistance (i.e., higher BMI, larger waist circumference, higher triglycerides, higher blood pressure, a larger amount of urinary albumin excretion, and lower HDL cholesterol). In this group, pioglitazone added to metformin was associated with >50% reduction in the occurrence of outcome, as compared with metformin plus an SU.
Insulin resistance is a common feature in T2DM and for decades has been associated with increased CV risk, irrespective of the presence or absence of hyperglycemia (22). Pioglitazone is the most potent insulin sensitizer currently available. It elicits durable glycemic control with no risk of hypoglycemia, ameliorates multiple features of the metabolic syndrome (including nonalcoholic fatty liver), and can slow down atherosclerotic processes (23–25). It is, therefore, biologically plausible that pioglitazone can exert greater benefits in the most insulin-resistant patients. Our results fit well with available data from the PROActive and IRIS studies conducted in patients with a prior CV event (26, 27) and further expand knowledge by suggesting that the benefits of pioglitazone could extend to people with T2DM representing essentially a primary prevention cohort and therefore at much lower CV risk than those enrolled in PROactive and IRIS.
Much in line with our results, a recent work has shown that, in a cluster analysis including six simple variables measured at diagnosis, it is possible to subdivide type 2 diabetes into five distinct subgroups characterized by different degrees of insulin resistance/deficiency, presentation of the disease, risk of developing complications, and glycemic response to glucose-lowering therapy (28). A differential response to treatment(s) in selected subgroups of patients with different metabolic characteristics is increasingly recognized, but it is insufficiently investigated; the available data have focused on the glycemic response and the durability of the glycemic effect (28, 29). Data on hard endpoints, like the ones we have analyzed in our study, are lacking and are relevant in helping clinicians develop a more personalized treatment of patients with type 2 diabetes, although more comparative studies including other drugs will be required to build a comprehensive road map.
Our study is unique because of the inclusion of patients largely free from CVD. These patients represent the majority of the diabetic population but had not been included in prior CV trials (30). Only recently was a small proportion of such patients included in the CANVAS program (7), and a larger proportion has been recruited in DECLARE and REWIND (31, 32). Among the most pressing clinical decisions in treating patients with type 2 diabetes are determining which drugs should be used after metformin and whether SUs should remain as a suitable second-line treatment. The data so far published have shown that the use of novel drugs in “primary” prevention cohorts is not associated with significant reduction of the rate of CV events (11, 12). Our study expands this knowledge and may support clinicians in the implementation of more personalized care of patients with type 2 diabetes.
This analysis was not prespecified before trial completion. In addition, the relatively small number of events may have limited the statistical power in some subgroups; in particular, the number of events in women does not allow us to generate a separate tree. The rate of major adverse events (pathologic bone fractures and heart failure) recorded in the trial was very low (<2%), thus limiting subgroup analyses. The potentially detrimental effect of weight gain could not be analyzed; the average weight gain was <2 kg and was similar in the two study arms. Due to a lack of financial resources, no direct measures of insulin resistance or insulin secretion were available. Patient stratification was based on clinical characteristics belonging to the usual clinical assessment and available to clinicians under real-world conditions.
In summary, our study shows that in clinical practice it is possible to identify patients with T2DM early in the stage of their disease—when CV risk is relatively low and CV events uncommon—in whom add-on pioglitazone to metformin confers CV protection as compared with SUs. This group of patients is characterized by male sex, high BMI, high-normal UACR, and a cluster of metabolic abnormalities associated with impaired insulin sensitivity, such as high plasma triglycerides, low HDL-cholesterol, and high blood pressure. The study findings expand knowledge about factors influencing the response to study drugs and call for more analysis to be performed in large cohorts treated with other and more novel drugs.
Acknowledgments
The authors thank the patients who participated in this study, the investigators and the dietitians of the TOSCA.IT centers for their cooperation, and the administrative personnel of the Italian Diabetes Society for their support.
Financial Support: The study was supported by the Italian Medicines Agency (AIFA) within the Independent Drug Research Program (contract No. FARM6T9CET) and by Diabete Ricerca, the nonprofit Research Foundation of the Italian Diabetes Society. The funding agency played no role in the study design; in the data collection, analysis, and interpretation; in the writing of the manuscript; or in the decision to submit the manuscript for publication.
Clinical Trial Information: ClinicalTrials.gov no. NCT00700856 (registered 19 June 2008).
Disclosure Summary: The authors have nothing to disclose.
Abbreviations:
- BMI
body mass index
- CV
cardiovascular
- CVD
cardiovascular disease
- HDL
high-density lipoprotein
- HR
hazard ratio
- RECPAM
RECursive Partitioning and Amalgamation
- SGLT2i
sodium glucose cotransporter 2 inhibitors
- SU
sulfonylurea
- T2DM
type 2 diabetes mellitus
- UACR
urinary albumin-to-creatinine ratio
