


Abstract
Gastric emptying is a major determinant of postprandial glycemia and is often delayed in long-standing, complicated type 2 diabetes mellitus (T2DM). However, there is little information about gastric emptying in well-controlled T2DM.
To evaluate the rate of gastric emptying in community-based patients with relatively well-controlled T2DM compared with young and older control subjects without diabetes.
A total of 111 patients with T2DM managed by diet (n = 52) or metformin monotherapy (n = 59) (HbA1c 6.6 ± 0.1%/49.0 ± 0.9 mmol/mol), 18 age- and body mass index (BMI)-matched older subjects without diabetes, and 15 young healthy subjects consumed a standardized mashed potato meal (368.5 kcal) containing 100 μL 13C-octanoic acid. Gastric emptying (by breath test) and blood glucose were evaluated over 240 minutes.
Gastric emptying was slower in the older than in the young subjects without diabetes (2.3 ± 0.1 vs 3.0 ± 0.1 kcal/min, P = 0.0008). However, relative to the age- and BMI-matched subjects without diabetes, gastric emptying (2.8 ± 0.1 kcal/min) was faster in patients with T2DM (P = 0.0005). Furthermore, gastric emptying was faster in the metformin-treated (3.0 ± 0.1 kcal/min) than in the diet-controlled (2.7 ± 0.1 kcal/min) patients with T2DM (P = 0.011), although there were no differences in age, BMI, HbA1c, or the duration of known diabetes. The increments in blood glucose (at t = 30 and 60 minutes and the incremental area under the curve during t = 0 to 120 minutes) after the meal were related directly to the rate of gastric emptying in the subjects with T2DM regardless of treatment with or without metformin (P < 0.05 each).
Gastric emptying is slowed with aging but otherwise is relatively more rapid in patients with well-controlled T2DM. This provides a strong rationale for slowing gastric emptying to improve postprandial glycemic control in these patients.
The rate of gastric emptying, which exhibits substantial interindividual but low intraindividual variation in both health (1, 2) and diabetes (3), is a major determinant of the glycemic response to a glucose drink (3, 4) or a solid meal containing carbohydrate (5). Interventions that slow gastric emptying, including “short-acting” glucagon-like peptide-1 (GLP-1) receptor agonists, pramlintide, acarbose, and nutrient preloads (6), have the capacity to attenuate postprandial glycemic excursions in type 2 diabetes (T2DM) (7). Moreover, the reduction in postprandial glycemia with short-acting GLP-1 receptor agonists is related to the magnitude of the slowing of gastric emptying such that when baseline gastric emptying is relatively more rapid, the reduction of postprandial glycaemia is greater (8, 9). Accordingly, the baseline rate of gastric emptying is likely to be an important determinant of the response to therapy.
After meal ingestion, the stomach usually empties, after an initial lag phase for solid meals, at a relatively constant caloric rate of 1 to 4 kcal/min in health (7). In people with T2DM, gastric emptying is often disordered, although there have been marked differences in outcomes between studies that may relate, at least in part, to the characteristics of the cohort selected. Studies from tertiary referral centers involving patients with longstanding (typically 8 to 12 years) T2DM, poor glycemic control (HbA1c >8.5%), and a high prevalence of microvascular complications indicate that 30% to 50% have abnormally delayed emptying of solids and/or nutrient liquids, whether studied by scintigraphy (3, 10) or a stable isotope breath test (11), and ∼5% have rapid emptying. Conversely, patients with “early” T2DM (<2 years) (12, 13) and/or an absence of autonomic neuropathy (14, 15) have been reported to have abnormally rapid emptying of solids and/or liquids, although this has not been observed in all series (4). A recent study of a small group of heterogeneous patients with longstanding T2DM but with relatively good glycemic control (HbA1c ∼7%) indicated that the rate of gastric emptying (measured by 13C octanoic acid breath test) did not differ from healthy control subjects (16). In interpreting these observations, it is well established that acute hyperglycemia, even at physiological postprandial levels, is associated with slowing of gastric emptying when compared with euglycemia (17), although the influence of chronic glycemic control, as assessed by HbA1c, is less clear (10, 16). Other factors that potentially influence the rate of gastric emptying include obesity, which may be associated with accelerated emptying (18, 19); advancing age, in which emptying is modestly slowed (20, 21); and antidiabetic treatments, such as metformin, which was recently shown to slow gastric emptying acutely in drug-naive patients with T2DM, probably in part due to its stimulation of GLP-1 secretion (22).
To assess the effects of T2DM on gastric emptying, we evaluated a cohort of community-based patients with good glycemic control (HbA1c ≤7.9%), whose T2DM was managed by diet or metformin monotherapy, to reduce heterogeneity and also in view of the fact that this group is most likely to benefit from interventions that specifically target postprandial glycemia (23). We compared patients (with or without metformin) with young and older subjects without diabetes, with the latter selected to match patients with T2DM in both age and body mass index (BMI), to determine the impact of each of these variables on gastric emptying. The gold standard technique to quantify gastric emptying is scintigraphy, but this technique involves exposure to ionizing radiation and requires specialized equipment and personnel to undertake the assessment. Therefore, we evaluated gastric emptying with a stable isotope breath test, which can be used in an office-based setting and which has been validated against scintigraphy in both health (24) and T2DM (25). We derived the gastric half-emptying time (T50), corrected by the Wagner-Nelson method, which has been shown to be of comparable accuracy to scintigraphy in assessing gastric emptying of both liquid and solid meals (26, 27) and which allows for calculation of the caloric rate of gastric emptying. Our hypothesis was that gastric emptying would be slowed with aging but is otherwise more rapid in community-based patients with relatively well-controlled T2DM.
Materials and Methods
Subjects
Patients with T2DM were recruited from the community by advertisement for studies evaluating nutritional and/or pharmacological therapies for diabetes in our center (28–30). The patients with T2DM had been diagnosed by American Diabetes Association criteria, their disease was managed by diet and/or metformin monotherapy (500 to 3000 mg/d, stable for >3 months), and they had HbA1c ≥6.0% and ≤7.9% at the time of screening. Control subjects without diabetes, including young volunteers of normal BMI and older volunteers with age and BMI in the range of the T2DM patient group, were also recruited from the community by advertisement and were excluded if they had evidence of T2DM by fasting blood glucose or HbA1c. Control subjects without diabetes and patients with T2DM were excluded if they reported substantial gastrointestinal symptoms, had a history of gastrointestinal disease including known gastroparesis, had undergone bariatric surgery, or had a requirement for medication known to affect gastrointestinal function or appetite. Subjects were screened to exclude those with kidney or liver disease. Based on our previous work (31), a sample size of 15 in each of the control groups was calculated to have at least 80% power (at α = 0.05) to detect ∼18% difference in T50 between the groups. The Royal Adelaide Hospital Human Research Ethics Committee approved the study, and all participants provided written informed consent.
Methods
Protocol
Gastric emptying of a standardized meal and postprandial glycemia were evaluated on a single study visit. All participants were asked to refrain from strenuous physical activity for 24 hours before the study and were provided with a standardized evening meal (energy content 592 kcal) consisting of beef lasagna (McCain Foods, Wendouree, Australia) to be consumed with bread, a nonalcoholic beverage, and one piece of fruit at 7:00 pm. Participants were then instructed to abstain from all food and nutrient beverages but were allowed to drink water until midnight before attending the laboratory at 8:00 am. On arrival, an intravenous cannula was inserted into a forearm vein for repeated blood sampling. The semisolid test meal, consisting of 65 g powdered potato (Deb, North Rocks, Australia) and 20 g glucose reconstituted with 200 mL water and one egg yolk containing 100 μL 13C-octanoic acid (368.5 kcal: 61.4 g carbohydrate, 7.4 g protein, and 8.9 g fat), was consumed over 5 minutes (t = 0 to 5 minutes). Breath samples were collected immediately before and every 5 minutes after meal ingestion in the first hour and every 15 minutes for 3 hours. Venous blood was sampled immediately before the meal (at t = 0) and at t = 15, 30, 60, 90, 120, 180, and 240 minutes.
Measurement of gastric emptying
In each breath sample, 13CO2 was measured by a nondispersive infrared spectrometer (FANci2; Fischer ANalysen Instrumente, Leipzig, Germany). The T50 was calculated using the Wagner-Nelson method as described previously (27), from which the rate of gastric emptying was derived and expressed in kcal/min.
Blood glucose concentrations and cardiovascular autonomic function
Blood glucose concentrations were assessed using a glucometer (Optium Xceed; Abbott Laboratories, Chicago, IL) and are reported as the mean of duplicate measurements at each time point. After completion of the gastric emptying measurement, autonomic nerve function was evaluated using standardized cardiovascular reflex tests (variation in heart rate during deep breathing, heart rate response to standing, and fall in systolic blood pressure in response to standing). Each test result was scored as 0 (normal), 1 (borderline), or 2 (abnormal). A score ≥3 was considered to indicate autonomic dysfunction (32).
Assessment of upper gastrointestinal symptoms
A subset of patients with T2DM (n = 71) and older subjects without diabetes (n = 18) completed a standardized questionnaire to assess upper gastrointestinal symptoms (33). “Gastric” (anorexia, nausea, early satiation, abdominal bloating/fullness, vomiting, abdominal pain) and “esophageal” symptoms (dysphagia, heartburn, acid regurgitation) were graded as 0 (none), 1 (mild; the symptom could be ignored), 2 (moderate; the symptom could not be ignored but did not influence daily activities), or 3 (severe; the symptom influenced daily activities), for a total possible score of 27 (34).
Statistical analysis
Demographic data, as well as the rate of gastric emptying, between the young and older subjects without diabetes and between the older subjects without diabetes and patients with T2DM were compared using unpaired Student t tests after confirming their normality of distribution, except that the proportions of each sex and those with autonomic neuropathy in each group were compared using Fisher exact test. Changes in blood glucose after the standardized test meal were evaluated by two-way repeated measures ANOVA using group and time as factors. Post hoc comparisons, adjusted for multiple comparisons by Bonferroni’s correction, were performed if ANOVAs revealed significant interactions. Relationships between change in blood glucose from baseline, the incremental area under the curve (iAUC) for blood glucose, HbA1c, and gastric emptying rate in the T2DM group were evaluated using the Pearson correlation analysis. Analyses were performed using Prism 7.0 (GraphPad, La Jolla, CA). A P value <0.05 was considered statistically significant. Data are expressed as mean values ± SEM.
Results
A total of 111 patients with T2DM managed by diet or metformin monotherapy, 15 young subjects without diabetes, and 18 older subjects without diabetes were studied (Table 1). In the group of older subjects without diabetes, 14 subjects were found to have impaired glucose tolerance. All subjects tolerated the protocol well. The older control subjects without diabetes matched the patients with T2DM well for sex, age, and BMI but were older (P < 0.01) and had a higher BMI (P < 0.05) compared with the young control subjects. Six of 111 patients with T2DM and 1 of 18 older subjects without diabetes had mild autonomic dysfunction.
Subject Characteristics
| Patients With T2DM | Nondiabetic Subjects | ||||
|---|---|---|---|---|---|
| Whole Group | Metformin Subgroup | Diet Alone Subgroup | Older | Young | |
| Sex (male) | 71/111 | 42/59 | 29/52 | 11/18 | 9/15 |
| Age, y | 64.8 ± 0.6 | 63.8 ± 0.8 | 65.9 ± 0.8 | 65.4 ± 1.8 | 21.3 ± 0.7a |
| BMI, kg/m2 | 29.7 ± 0.5 | 30.4 ± 0.6 | 29.0 ± 0.7 | 27.9 ± 1.1 | 23.7 ± 1.1b |
| HbA1c, % | 6.6 ± 0.1 | 6.6 ± 0.1 | 6.6 ± 0.1 | 5.5 ± 0.1c | — |
| HbA1c, mmol/mol | 49.0 ± 0.6 | 49.0 ± 0.9 | 49.0 ± 0.9 | 36.1 ± 0.9 | — |
| Duration of T2DM, y | 5.5 ± 0.5 | 6.4 ± 0.8 | 4.9 ± 0.6 | — | — |
| Fasting glucose | 8.1 ± 0.1 | 8.4 ± 0.2 | 7.8 ± 0.2d | 5.9 ± 0.1c | 5.4 ± 0.1a |
| Prevalence of autonomic neuropathy | 6/111 | 3/59 | 3/52 | 1/18 | 0 |
Values are mean ± SEM.
P < 0.01 compared with nondiabetic older subjects.
P < 0.05 compared with nondiabetic older subjects.
P < 0.01 compared with overall patients with T2DM.
P < 0.05 compared with patients with T2DM treated with metformin.
Comparisons between the young and older subjects without diabetes
Fasting blood glucose concentrations were slightly higher in the older than in the young subjects without diabetes (P < 0.001) (Table 1). After meal ingestion, blood glucose concentrations increased promptly and peaked at ∼30 minutes in the young group and at ∼60 minutes in the older group before returning to baseline. There were both a group effect (P < 0.001) and a group by time interaction on blood glucose concentrations (P < 0.0001), such that blood glucose concentrations were higher between t = 60 to 180 minutes in the older than in the young subjects without diabetes (P < 0.05 each) (Fig. 1A).
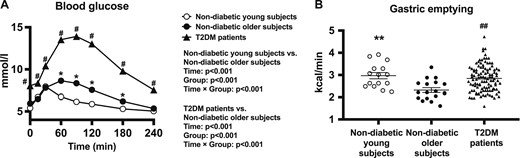
(A) Blood glucose concentrations in response to a standardized carbohydrate meal (given at t = 0) in patients with T2DM and young and older control subjects without diabetes. Repeated-measures ANOVA was used to determine statistical difference. ANOVA results are reported as P values for differences by group, differences over time, and differences due to group by time interaction. Post hoc comparisons were adjusted by Bonferroni correction. (B) Gastric emptying rate in patients with T2DM and young and older control subjects without diabetes assessed by 13C-octanoic acid breath test. Unpaired t test was used to determine statistical difference. Data are mean ± SEM. *P < 0.05, **P < 0.01 for young vs older subjects without diabetes. #P < 0.05, ##P < 0.01 for patients with T2DM vs older subjects without diabetes.
The rate of gastric emptying ranged from 2.2 to 3.9 kcal/min in the young subjects and from 1.6 to 3.3 kcal/min in the older subjects. The mean emptying rate was slower in the older subjects without diabetes (2.3 ± 0.1 kcal/min) than in the young subjects without diabetes (3.0 ± 0.1 kcal/min; P = 0.0008) (Fig. 1B).
Comparisons between T2DM and age- and BMI-matched older subjects without diabetes
Fasting and postprandial blood glucose concentrations were higher in patients with T2DM than in the age- and BMI-matched older subjects without diabetes (two-way repeated measures ANOVA: group effect, P < 0.0001; group by time interaction, P < 0.0001), with significant differences at all time points (t = 0 to 240 min, P < 0.05 for each) (Fig. 1A).
The rate of gastric emptying ranged from 1.6 to 4.7 kcal/min in the whole cohort of patients with T2DM, and the mean emptying rate (2.8 ± 0.1 kcal/min) was significantly faster than the older subjects without diabetes (P = 0.0005) (Fig. 1B).
The prevalence of upper gastrointestinal symptoms was comparable in the subset of patients with T2DM who completed the questionnaire (n = 71) and the older control subjects without diabetes; 47 of 71 patients in the T2DM group reported upper gastrointestinal symptoms (66%), and 12 of 18 in the control group reported upper gastrointestinal symptoms (67%). The median total score for upper gastrointestinal symptoms in T2DM was 1 (0 to 8), and the main symptoms were acid regurgitation (32%), heartburn (27%), and fullness (27%). The median total score in the age-matched control subjects without diabetes was also 1 (0 to 4).
Subgroup comparisons between patients with T2DM with and without treatment with metformin
There were no differences in sex, age, BMI, HbA1c, or duration of known diabetes between patients with T2DM treated with metformin (n = 59) and patients with T2DM not treated with metformin (n = 52). However, both fasting and postprandial blood glucose concentrations were lower in the subgroup of patients with T2DM managed by diet alone (two-way repeated measures ANOVA: group effect, P = 0.007; group by time interaction, P = 0.01, with significant differences at t = 0, 15, 30, 120, 180, and 240 minutes; P < 0.05 for each) (Table 1; Fig. 2A).
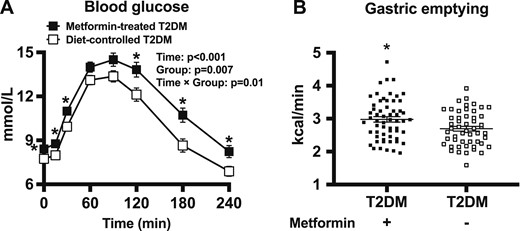
(A) Blood glucose concentrations in response to a standardized carbohydrate meal (given at t = 0) in patients with T2DM managed with or without metformin. ANOVA results are reported as P values for differences by group, differences over time, and differences due to group by time interaction. Post hoc comparisons were adjusted by Bonferroni correction. (B) Gastric emptying rate in patients with T2DM and healthy older subjects as assessed by 13C-octanoic acid breath test. Data are mean ± SEM. *P < 0.05 for patients with T2DM with metformin vs patients with T2DM without metformin.
The rate of gastric emptying ranged from 1.6 to 3.9 kcal/min in the subgroup of patients with T2DM without metformin therapy and from 2.0 to 4.7 kcal/min in patients treated with metformin monotherapy, with the mean rate of emptying being faster in the latter (3.0 ± 0.1 kcal/min for patients on metformin vs 2.7 ± 0.1 kcal/min for patients managed by diet alone; P = 0.011). Gastric emptying in the patients with diet-controlled T2DM remained faster than in the older control subjects without diabetes (P = 0.009) (Fig. 2B).
Relationships between gastric emptying, glycemic markers, and demographic data
There was no significant relationship between the rates of gastric emptying with BMI across the three groups or with HbA1c in patients with T2DM.
In the two control groups, there was a tendency for a direct relationship between the increment in blood glucose at 30 minutes after the meal and the rate of gastric emptying (r = 0.31, P = 0.07) (data not shown). In patients with T2DM, the increments in blood glucose at t = 30 minutes (r = 0.49, P < 0.01) and 60 minutes (r = 0.51, P < 0.01), as well as the iAUC for blood glucose between 0 to 120 minutes (r = 0.34, P < 0.01), were directly related to the rate of gastric emptying (Fig. 3A–3C). These direct relationships between gastric emptying and the increments in postprandial glycemia remained evident in the subgroup of patients with T2DM treated with metformin (Fig. 3D–3F) and in patients whose T2DM was managed by diet alone (Fig. 3G–3I).
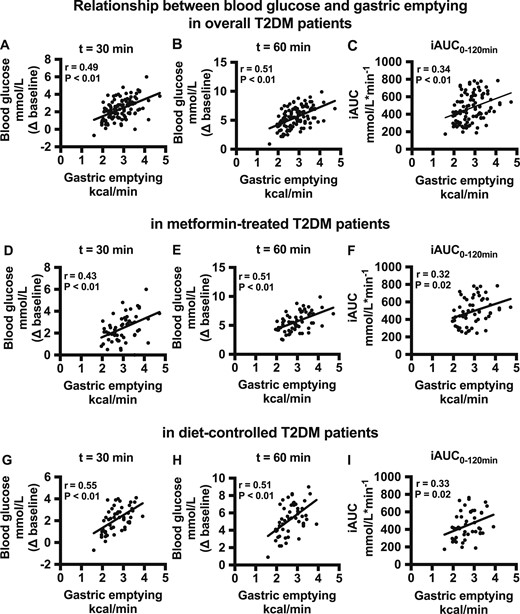
(A–C) Relationship between the blood glucose increment (at t = 30 and 60 min after the meal and the iAUC for blood glucose during 0 to 120 min) and gastric emptying rate in overall patients with T2DM. (D–F) Relationship between the blood glucose increment (at t = 30 and 60 min after the meal and the iAUC for blood glucose during 0 to 120 min) and gastric emptying rate in the patients with T2DM taking metformin. (G–I) Relationship between the blood glucose increment (at t = 30 and 60 min after the meal and the iAUC for blood glucose for 0 to 120 min) and gastric emptying rate in the patients with T2DM without metformin.
Discussion
In this cross-sectional study, we observed that gastric emptying was slower in older than in young individuals without T2DM (mean age, ∼65 vs 23 years) but was more rapid in patients with relatively well-controlled T2DM when compared with age- and BMI-matched control subjects without diabetes. In keeping with the concept that gastric emptying is a critical determinant of postprandial glycemia, the increments in blood glucose after a standardized test meal were closely related to the rate of gastric emptying in this group of patients with T2DM. Therefore, these observations add to the rationale for slowing of gastric emptying as a therapeutic strategy in the management of T2DM, particularly in patients whose T2DM is relatively well controlled. However, in patients with more advanced T2DM treated with prandial insulin administration, gastric emptying and insulin dosing should probably be coordinated to improve postprandial glycemia and to minimize the risk of hypoglycemia (7).
The observed range of the rate of gastric emptying derived from the isotope breath test using the Wagner-Nelson method in the control groups was in line with the literature (26). Our observation that gastric emptying was slower in the older than young subjects without diabetes is also consistent with previous studies using a scintigraphic technique (20, 21), although the older subjects also had a higher BMI, which has been associated with somewhat accelerated gastric emptying in some (18, 19) but not all (35) studies. On the other hand, the majority of the older subjects without diabetes had impaired fasting glucose, with significantly higher fasting and postprandial blood glucose concentrations than the young participants, which may contribute to the slowing of gastric emptying in this group (17). The elevated blood glucose levels are likely to reflect greater insulin resistance related to aging and the higher BMI in the nondiabetic older group (36). In this context, the relationship between gastric emptying and postprandial glycemia in the control subjects without diabetes was weaker.
In contrast to some studies of patients with T2DM who indicate a high prevalence of delayed gastric emptying (3, 10, 11), we observed that gastric emptying was more rapid in patients with T2DM whose T2DM was relatively well controlled by diet and/or metformin when compared with age- and BMI-matched control subjects without diabetes. However, our patients differed from those studied previously in that their T2DM was well controlled (mean HbA1c ∼6.6%), they had a relatively short duration of known diabetes, and their disease was managed by diet and/or metformin only. Although blood glucose concentrations were predictably higher in the subjects with T2DM than in the control subjects without diabetes, this might be expected to contribute toward slowing of gastric emptying (37). Our data are consistent with reports that gastric emptying of liquid (12) or solid (13) high-carbohydrate meals is accelerated in “early” T2DM when studied using a scintigraphic technique. The consistency between our observations and those reported previously raises the question as to whether accelerated gastric emptying may precede the development of T2DM (12, 13). The lack of patients with abnormally slow gastric emptying in our cohort is in agreement with the study of Boronikolos et al. (16), in which a 13C-octanoic acid breath test was also used and in which the patients’ disease was also well controlled (HbA1c ∼7%), although these patients had a greater duration of diabetes (10 years) and a heterogenous profile of therapies for T2DM. Finally, the patients with T2DM in our study were essentially uncomplicated; few had evidence of autonomic neuropathy, and those with significant gastrointestinal symptoms were excluded.
There is recent evidence that acute administration of metformin slows gastric emptying in patients with T2DM (22). In the current study, gastric emptying was counterintuitively faster in the subgroup of patients treated with metformin monotherapy than in those treated with diet alone, despite comparable sex, age, BMI, HbA1c, and duration of T2DM at the time of assessment in the two subgroups. However, it would be expected that the “baseline” characteristics between the two subgroups before any diabetes intervention would differ substantially; both fasting and postprandial blood glucose concentrations were modestly higher in the subgroup of patients receiving metformin. Because of the lack of baseline emptying data, it is not possible to draw conclusions from the current study about the chronic effects of metformin on gastric emptying in T2DM, which warrant further investigation. Nevertheless, our observation that metformin-treated patients often have more rapid gastric emptying suggests that selecting an agent that slows gastric emptying may be ideal if add-on therapy is needed.
Gastric emptying has a major impact on postprandial blood glucose concentrations, particularly the “early” glycemic response (38, 39). In the current study, we observed close relationships between the increments in postprandial glycemia and gastric emptying in patients with T2DM. It has been established that, in patients with T2DM who are not treated with insulin, postprandial blood glucose excursions are increased by interventions that accelerate gastric emptying and diminished by those that delay it (40), even when the slowing of emptying is quite modest (41, 42). It is also evident that therapies that slow gastric emptying are effective in reducing postprandial glycemic excursions in patients who have normal or rapid emptying at baseline but have minimal impact in those in whom emptying is already delayed (5). Therefore, our findings are of high clinical relevance because the subset of patients with relatively good glycemic control (HbA1c <7.9%) is most likely to benefit from interventions that target postprandial glycemia (23, 43). Evaluation of gastric emptying at baseline, such as using a point-of-care 13C-octaonoic breath test, may individualize therapy in T2DM, although, considering our data, it could also be argued that this is not essential in the subgroup with well-controlled T2DM.
There is a poor correlation between upper gastrointestinal symptoms and gastric emptying in diabetes (4). This finding was confirmed in our study because there was no difference in gastric emptying between subjects with or without upper gastrointestinal symptoms in the T2DM group. Moreover, the prevalence of symptoms was similar between the T2DM and age- and BMI-matched control subjects without diabetes. However, it should be noted that patients who had significant symptoms were excluded.
A strength of our study is that we recruited a homogenous group of essentially uncomplicated patients with T2DM whose disease was relatively well controlled by diet and/or metformin monotherapy and evaluated appropriate control groups. Although the exclusion of patients with poorly controlled diabetes, taking other antidiabetic medications, or with high prevalence of complications might be perceived as a limitation, it was not our intention to study patients in these categories because they are intuitively less likely to benefit from interventions that slow gastric emptying. Several other limitations should also be noted. First, the sample size of the control groups was relatively small. However, the subjects in each group were carefully controlled for potential confounding factors, and the sample size has provided adequate power to detect a difference in the rate of gastric emptying (i.e., primary endpoint). In this context, increasing the sample size would be unlikely to alter our study conclusions substantially. Second, the majority of the age- and BMI-matched control subjects without diabetes had impaired fasting glucose, such that it would be of interest to have included an additional older group without any glycemic dysregulation. Third, blood glucose levels were determined using a portable glucometer, yet the correlations observed in the current study are robust. Furthermore, a high-carbohydrate meal was used in the current study, which may not be typical for patients with T2DM but is ideal to investigate the relationship between gastric emptying and postprandial glycaemia. Finally, previous dietary habits, which may affect gastric emptying, were not evaluated in the current study.
In summary, gastric emptying is delayed modestly with aging but is otherwise more rapid in patients with T2DM of relatively short duration and with good glycemic control. These observations support the potential utility of interventions that slow gastric emptying to improve postprandial glycemia and overall glycemic control in this group.
Acknowledgments
The authors thank Kylie Lange (Centre of Research Excellence in Translating Nutritional Science into Good Health, The University of Adelaide) for expert statistical advice and Michelle Bound and Jacqueline Grivell (Centre of Research Excellence in Translating Nutritional Science into Good Health, The University of Adelaide) for assistance in subject recruitment and the conduct of the study.
Financial Support: The study was supported by the NHMRC (ID: APP10066835) (to C.K.R.).
Disclosure Summary: K.L.J. has received research funding from Sanofi and drug supplies from Merck Sharp & Dohme. M.H. has participated in the advisory boards and/or symposia for Novo Nordisk, Sanofi, Novartis, Eli Lilly, Merck Sharp & Dohme, Boehringer Ingelheim, and AstraZeneca and has received honoraria for this activity. C.K.R. has received research funding from AstraZeneca, Merck Sharp & Dohme, Eli Lilly, Novartis, and Sanofi. T.W. has received travel support from Novartis and research funding from AstraZeneca. The remaining authors have no personal or financial conflicts of interest to declare.
Abbreviations:
- BMI
body mass index
- GLP-1
glucagon-like peptide-1
- iAUC
incremental area under the curve
- T2DM
type 2 diabetes mellitus
- T50
gastric half-emptying time
References and Notes
Author notes
L.E.W. and C.X. contributed equally to this study.
C.K.R. and T.W. are joint senior authors.
