


Abstract
Maternal gestational diabetes mellitus (GDM) and prepregnancy overweight/obesity [body mass index (BMI) ≥25 kg/m2] might adversely affect offspring cardiometabolic health.
To assess the associations between maternal GDM and prepregnancy overweight/obesity with adult offspring cardiometabolic risk factors.
Longitudinal cohort study (ESTER Maternal Pregnancy Disorders Study and the Arvo Ylppö Longitudinal Study).
Province of Uusimaa and Northern Finland.
At a mean age of 24.1 ± 1.3 years, we classified offspring as offspring of mothers with GDM regardless of the prepregnancy BMI (OGDM; n = 193); normoglycemic mothers with prepregnancy overweight/obesity (ONO; n = 157); and normoglycemic mothers with prepregnancy BMI <25 kg/m2 (controls; n = 556).
We assessed the cardiometabolic biomarkers from blood and measured the blood pressure at rest and heart rate.
Compared with the controls, the OGDM and ONO groups had greater fasting glucose (1.6%; 95% CI, 0.1% to 3.1%; and 2.3%; 95% CI, 0.5% to 4.3%, respectively) and insulin (12.7%; 95% CI, 4.4% to 21.9%; and 8.7%; 95% CI, 0.2% to 17.8%). These differences attenuated to nonsignificance when adjusted for confounders and/or current offspring characteristics, including BMI or body fat percentage. The OGDM group had lower SHBG (men, −12.4%; 95% CI, −20.2% to −3.9%; women, −33.2%; 95% CI, −46.3% to −16.8%), high-density lipoprotein (−6.6%; 95% CI, −10.9% to −2.2%), and apolipoprotein A1 (−4.5%; 95% CI, −7.5% to −1.4%). These differences survived the adjustments. The heart rate and other biomarkers were similar among the groups.
Adult offspring of mothers with GDM have increased markers of insulin resistance and a more atherogenic lipid profile. These were only partly explained by confounders or current offspring adiposity. Maternal prepregnancy overweight/obesity was associated with impaired offspring glucose regulation, which was explained by confounders and/or current adiposity.
Metabolic abnormalities, including alterations in lipid and carbohydrate metabolism, are likely among women with gestational diabetes mellitus (GDM), overweight [body mass index (BMI) ≥25 kg/m2], or obesity (BMI ≥30 kg/m2) during pregnancy. At a critical period of fetal development, exposure to hyperglycemia might induce long-term effects on the fetus by creating a metabolic memory, previously described as fetal programming (1). Prenatal exposure to a hyperglycemic environment is known to alter growth trajectories and homeostatic regulatory mechanisms, and these changes will predispose offspring to epigenetic changes (2, 3). It is likely that both maternal GDM and overweight/obesity provide a prenatal environment making the fetus susceptible to adverse in utero programming. This might cause an increased risk of next-generation overweight and obesity and result in an intergenerational cycle of obesity and insulin resistance.
The offspring of mothers with GDM have shown markers of insulin resistance and metabolic syndrome and a higher BMI and waist circumference by adolescence (4). Furthermore, adult offspring of mothers with GDM represent a risk group for the development of overweight and metabolic syndrome (5).
Exposure to maternal obesity during pregnancy will also affect the offspring’s health, in particular, an increased risk of obesity and metabolic sequelae (6). In a recent review by Nicholas et al. (7), maternal obesity increased the offspring risk of both obesity and insulin resistance in childhood, adolescence, and adulthood. Previous studies have also linked a high maternal prepregnancy BMI to unfavorable offspring body composition in infancy (8), childhood (9), adolescence (10), and young adulthood (11). Even at a mean age of 62 years, a less favorable body composition and higher BMI in the offspring were reported (12). However, it is not always clear to what extent these associations have represented genetic or lifestyle factors, shared by the family, and to what extent they have represented causal programming effects. Moreover, it is uncertain to what extent these offspring consequences have resulted from exposure to maternal GDM and to what extent from maternal overweight/obesity. Despite previously well-established data on the strong influence of maternal prepregnancy overweight/obesity or GDM on an offspring’s increased risk of obesity and metabolic sequelae during childhood, it is less clear whether the effects extend into adulthood.
Therefore, we hypothesized that maternal GDM and prepregnancy overweight/obesity might affect the cardiometabolic risk factors in adult offspring. In the present study, we investigated the effect of exposure to maternal GDM or prepregnancy overweight/obesity on adult offspring cardiometabolic health.
Materials and Methods
Participants
The participants of the present study were from two prospective birth cohorts (Fig. 1) (11): the ESTER Maternal Pregnancy Disorders Study and the Arvo Ylppö Longitudinal Study (AYLS).
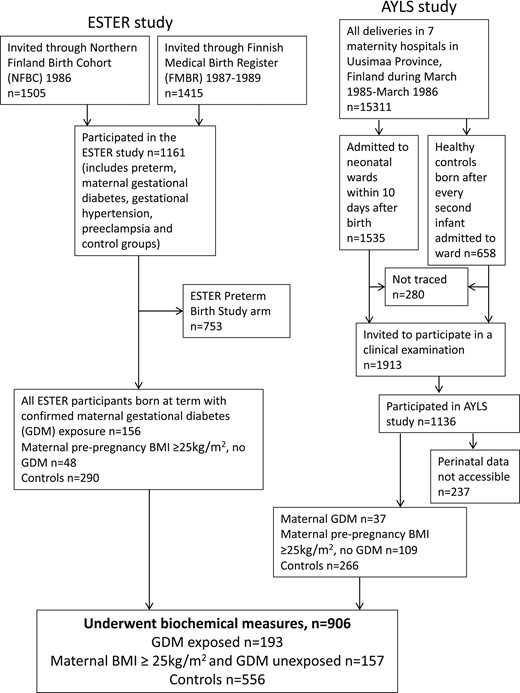
Flowchart of the study population, including participants from two birth cohort studies.
The ESTER study consisted of two arms (Fig. 1), the ESTER preterm birth (13) and ESTER maternal pregnancy disorders arms. The present study included participants from the latter arm. All ESTER study participants had been born in the two northernmost provinces of Finland. Those born from 1985 to 1986 were recruited from the Northern Finland Birth Cohort 1986 (14) and those born from 1987 to 1989 through the Finnish Medical Birth Register (13), as previously described (15). We selected all participants of the ESTER maternal pregnancy disorders arm who had been confirmed to have maternal GDM (n = 157), regardless of the mother’s prepregnancy BMI. The ESTER clinical study participants invited to participate as controls (15) were stratified into two groups: one group with maternal prepregnancy overweight/obesity with offspring born at term to mothers with prepregnancy BMI ≥25 kg/m2 and no GDM (n = 44), and a control group of the remaining control participants, all with maternal prepregnancy BMI <25 kg/m2 and no GDM (n = 281).
All AYLS participants (Fig. 1) were born in the province of Uusimaa, in Southern Finland, between 1985 and 1986. This cohort consisted of all live-born infants admitted to neonatal wards in obstetric units or transferred to the neonatal intensive care unit of the Children’s Hospital, Helsinki University Central Hospital within 10 days of their birth, with the population ranging from severely ill preterm infants to infants born at term, requiring only brief inpatient observation, and their controls, as previously described (16, 17). Of the AYLS cohort participants with data available, we selected (i) all who had been exposed to maternal GDM, at any maternal BMI (n = 37); (ii) those with maternal BMI ≥25 kg/m2 and no GDM (n = 109); and (iii) controls (i.e., originally recruited as controls with a maternal BMI <25 kg/m2 and no GDM; n = 266).
For all study participants, perinatal data were collected from health care records and questionnaires. The length of gestation and maternal GDM, hypertension (gestational or chronic), and preeclampsia (including superimposed) diagnoses were independently confirmed according to prevailing criteria by reviewing the original hospital records (4, 18). Maternal GDM was screened for using the oral glucose tolerance test (OGTT) and diagnosed from the OGTT results. Screening was performed in the maternal welfare clinics at 26 to 28 gestational weeks. The indications for screening were glucosuria, previous GDM, suspected fetal macrosomia, previous macrosomic infant (birth weight >4500 g), maternal prepregnancy BMI ≥25 kg/m2, and maternal age ≥40 years. The OGTT was performed after overnight fasting using a 75-g oral glucose load. At the diagnosis in the 1980s, the following cutoff limits for GDM were used for venous blood glucose: >5.5 mmol/L at fasting, >11.0 mmol/L, and >8.0 mmol/L at 1 and 2 hours after the glucose load, respectively. According to prevailing national guidelines, a diagnosis of GDM required a minimum of one abnormal value in the OGTT (4). For comparison, the International Association of Diabetes and Pregnancy Study Groups Consensus Panel diagnostic criteria used currently were fasting plasma glucose of ≥5.1 mmol/L and ≥10.0 mmol/L and ≥8.5 mmol/L at 1 and 2 hours after a 75-g oral glucose load (19).
Offspring to mothers with type 1 (n = 28) or type 2 diabetes (n = 1) were excluded from all analyses. We further excluded those subjects who were pregnant (n = 9) during the clinical examination and those who reported having cerebral palsy (n = 8), mental disability (n = 11), or a severe physical disability (n = 5), because these conditions could have affected the measured outcomes. We categorized all ESTER and AYLS cohort participants who had undergone biochemical measures into three groups: (i) offspring of mothers with GDM (OGDM) at any level of maternal BMI; (ii) offspring of normoglycemic mothers with prepregnancy overweight/obesity (ONO); and (iii) controls (i.e., offspring of mothers with prepregnancy BMI <25 kg/m2 and no GDM). Thus, 906 subjects were included in the analyses (OGDM, n = 193; ONO, n = 157; controls, n = 556).
Ethics
Our study protocol was performed in accordance with the Declaration of Helsinki. The ethics committees of the University of Oulu, Helsinki City Maternity Hospital, Helsinki University Central Hospital, Jorvi Hospital, and Northern Ostrobothnia Hospital District and coordinating ethics committee of the Helsinki and Uusimaa Hospital District approved the present study. All the participants provided written informed consent. Because of individual participant consent, these data are not freely available. Investigators requesting data access should contact the corresponding author (N.K.). Requests could be subject to ethics review and/or participant consent.
Measures and procedures
Anthropometry was measured during clinical examinations conducted in 2009 to 2011 for ESTER participants and 2009 to 2012 for AYLS participants. Height was measured 3 times with the participant not wearing socks and shoes using a portable stadiometer. Weight was measured during the clinical visit. Most of our participants had also undergone bioimpedance measurement, and the bioimpedance device (InBody, version 3.0; Biospace Co., Ltd., Seoul, Korea) contains a scale. For individuals who did not undergo bioimpedance, we used an electronic scale. The BMI was calculated using mean values of the repeated measurements (weight in kg divided by the height in meters squared).
All participants attended a clinical visit in the morning after an overnight fast. They were examined by a trained study nurse. After a 5-minute rest in a sitting position, the blood pressure was measured three times from the right upper arm using an automatic oscillometric blood pressure monitor (Omron M10-IT Intellisense; Omron Healthcare Co., Kyoto, Japan). All participants completed questionnaires of both participant and parental health status, including medical history and medications. The highest parental educational attainment was recorded and categorized into four levels (dummy coded) to serve as an indicator of childhood socioeconomic status.
Laboratory analyses
At the clinical visit, venous blood samples were taken with the participant in a sitting position with a light stasis into a fluoride-citrate tube (Venosafe; Terumo Europa, Leuven, Belgium) for glucose assays and into a tube containing a clot activator (Venosafe) for the other assays. Fluoride-citrate plasma and serum were separated by centrifuging, frozen locally immediately after separation, and transported frozen on dry ice to the biochemistry laboratory of the Genomics and Biomarker Unit (formerly, the Disease Risk Unit) at the National Institute for Health and Welfare (Helsinki, Finland) and the Oulu University Hospital laboratory. All analyses were performed using a clinical chemistry analyzer (Architect ci8200; Abbott Laboratories, Abbott Park, IL) at the biochemistry laboratory in the AYLS and ESTER studies, except for fasting plasma glucose, total cholesterol (TC), high-density lipoprotein cholesterol (HDL-C), low-density lipoprotein cholesterol (LDL-C), triglycerides (TGs), alanine aminotransferase, aspartate transaminase, gamma glutamate, and uric acid for the ESTER study participants. In the ESTER study, these samples were analyzed using an Advia 2400 automatic chemical analyzer (Siemens Diagnostics, Terrytown, NY) at Oulu University Hospital laboratory, which has been described in detail previously (13) (freely available as a web appendix).
To standardize the measurements, the biochemistry laboratory participated in a Lipid Standardization Program organized by the Centers for Disease Control and Prevention (Atlanta, GA) and external quality assessment schemes organized by Labquality (Helsinki, Finland). During the course of the studies, the between-assay coefficient of variation (mean ± SD), systematic error (mean ± SD), and the principle of the methods used in the biochemistry laboratory are provided in an online repository (20).
Statistical analysis
All statistical analyses were conducted using SPSS Statistics, versions 24 and 25 (IBM Corp., Armonk, NY). Analyses were performed using a combined data set of both birth cohorts (ESTER and AYLS). We compared the descriptive characteristics between participants using a t test for continuous variables and χ2 test for categorical variables. The significance level was set to two-tailed P < 0.05. Because the biochemical measures were not normally distributed, we log-transformed them before the statistical analyses to attain normality. We used multiple linear regression models to compare the cardiometabolic biochemical measures, blood pressure, and heart rate between the adult offspring of mothers with GDM or prepregnancy overweight/obesity and the controls. We adjusted for age, sex, and birth cohort in model 1. Prenatal and parental confounders were considered in model 2, because we additionally adjusted for gestational age, birth weight SD score, maternal hypertension or preeclampsia during pregnancy, maternal smoking during pregnancy, parental educational attainment, and parental history of hypertension, diabetes, stroke, or myocardial infarction. Participant-related factors, including age, sex, birth cohort, BMI, height, and daily smoking, were adjusted for in model 3. Finally, in the full model (model 4), all these covariates were included.
Results
The perinatal and current characteristics and parental medical history of the OGDM, ONO, and control groups are presented in Table 1. For comparison, these data are also shown separately for the two source cohorts in an online repository (20). The mean age of the offspring at assessment was 24.1 ± 1.3 years, and 51.3% were women. Among the offspring, 2 OGDM, 2 ONO, and 8 control participants were born from twin pregnancies; the remainder were all singletons. As a sensitivity analysis, we excluded all twins and reran all analyses. However, the results did not change. The cardiometabolic biochemical measures, heart rate, and blood pressure of the offspring, with the corresponding reference or target values, are presented in Table 2.
Baseline Participant Characteristics of Adult Offspring Stratified by Group
| Characteristic | GDM (n = 193) | P Valuea | Prepregnancy Obesity or Overweight,b No GDM (n = 157) | P Valuea | Controlc (n = 556) |
|---|---|---|---|---|---|
| Birth/perinatal characteristics | |||||
| Maternal BMI before pregnancy, kg/m2 | 24.9 ± 5.4 | <0.001 | 28.0 ± 3.0 | <0.001 | 21.2 ± 1.9 |
| Twin pregnancy, n (%) | 2 (1.3) | 2 (1.3) | 8 (1.4) | ||
| Maternal hypertension, n (%) | 52 (26.9) | <0.001 | 53 (33.8) | <0.001 | 73 (13.1) |
| Maternal preeclampsia, n (%) | 12 (6.2) | 8 (5.1) | 17 (3.1) | ||
| Maternal smoking during pregnancy, n (%) | 23 (11.9) | 33 (21.0) | 90 (16.2) | ||
| Birthweight, g | 3687 ± 626 | <0.01 | 3458 ± 864 | 3535 ± 465 | |
| Birthweight SD score | 0.55 ± 1.2 | <0.001 | 0.09 ± 1.4 | −0.05 ± 0.9 | |
| Gestational age, wk | 39.0 ± 0.2 | <0.001 | 39.1 ± 2.9 | <0.001 | 39.9 ± 1.4 |
| Small for gestational age, n (%) | 1 (0.5) | 15 (9.6) | <0.001 | 8 (1.4) | |
| Large for gestational age, n (%) | 26 (13.5) | <0.001 | 10 (6.4) | <0.01 | 10 (1.8) |
| Male sex, n (%) | 105 (54.4) | <0.05 | 78 (49.7) | 258 (46.4) | |
| Current characteristics | |||||
| Age, y | 23.4 ± 1.3 | <0.001 | 24.8 ± 1.1 | 24.4 ± 1.3 | |
| Daily smoking, n (%) | 55 (28.5) | <0.05 | 52 (33.1) | 141 (25.4) | |
| BMI, kg/m2 | |||||
| Men | 25.6 ± 4.7 | <0.001 | 26.5 ± 4.8 | <0.001 | 24.0 ± 3.6 |
| Women | 24.3 ± 4.4 | <0.05 | 24.7 ± 4.6 | <0.01 | 23.0 ± 4.2 |
| BMI ≥25 kg/m2, n (%) | 81 ± 42.0 | <0.01 | 78 ± 49.7 | <0.001 | 158 ± 28.4 |
| BMI ≥30 kg/m2, n (%) | 24 ± 12.4 | <0.05 | 22 ± 14.0 | <0.05 | 41 ± 7.4 |
| Height, cm | |||||
| Men | 178.9 ± 7.0 | 178.0 ± 6.7 | 178.9 ± 7.0 | ||
| Women | 165.9 ± 6.3 | 164.7 ± 6.4 | 165.2 ± 6.2 | ||
| Parental education, n (%) | <0.05 | <0.001 | |||
| Basic | 28 (14.5) | 21 (13.3) | 30 (5.4) | ||
| Secondary | 101 (52.3) | 83 (52.9) | 281 (50.5) | ||
| Lower-level tertiary | 16 (8.3) | 18 (11.5) | 66 (11.9) | ||
| Upper-level tertiary | 46 (23.8) | 28 (17.8) | 165 (29.7) | ||
| Maternal medical conditions at mean offspring age, 24 y, n (%) | |||||
| Hypertension | 42 (21.8) | <0.001 | 50 (31.8) | <0.001 | 52 (9.4) |
| Diabetes mellitus | 70 (36.3) | <0.001 | 18 (11.5) | <0.001 | 10 (1.8) |
| Stroke or myocardial infarction | 3 (1.6) | 1 (0.6) | 3 (0.5) | ||
| Paternal medical conditions at mean offspring age 24 y, n (%) | |||||
| Hypertension | 40 (20.1) | 28 (17.8) | 83 (14.9) | ||
| Diabetes | 16 (8.3) | 23 (14.6) | 43 (7.7) | ||
| Stroke or myocardial infarction | 13 (6.7) | 3 (1.9) | 19 (3.4) |
Linear regression model, adjusted for age, sex and source cohort, comparing offspring exposed to maternal gestational diabetes or maternal prepregnancy overweight/obesity with controls. All remaining P values are >0.05.
Prepregnancy BMI ≥25 kg/m2.
Offspring of normoglycemic mothers with normal prepregnancy weight.
Cardiometabolic Markers of Adult Offspring Stratified by Group
| Characteristic | GDM (n = 193) | Prepregnancy Obesity or Overweight, No GDM (n = 157) | Controla (n = 556) | Reference Value |
|---|---|---|---|---|
| Fasting plasma glucose, mmol/L | 5.2 ± 1.1 | 5.2 ± 1.2 | 5.1 ± 1.1 | 4.2–6.0 |
| Fasting serum insulin, mU/L | 10.3 ± 2.1 | 22.8 ± 2.5 | 14.8 ± 2.6 | 2.0–20 |
| TC, mmol/L | 4.5 ± 1.2 | 4.7 ± 1.2 | 4.6 ± 1.2 | <5.0 |
| HDL-C, mmol/L | 1.4 ± 1.3 | 1.5 ± 1.3 | 1.6 ± 1.3 | >1.0/>1.2b |
| LDL-C, mmol/L | 2.7 ± 1.4 | 2.7 ± 1.3 | 2.6 ± 1.3 | <3.0 |
| TGs, mmol/L | 1.0 ± 1.6 | 1.0 ± 1.6 | 0.9 ± 1.6 | <1.7 |
| Lipoprotein (a), mg/L | 78.8 ± 3.1 | 99.0 ± 3.3 | 95.1 ± 3.1 | <250 |
| ApoA1, g/L | 1.4 ± 1.2 | 1.5 ± 1.2 | 1.5 ± 1.2 | 1.0–2.0/1.1–2.3b |
| ApoB, g/L | 0.7 ± 1.3 | 0.8 ± 1.3 | 0.7 ± 1.3 | 0.66–1.33/0.60–1.17b |
| Serum FFA, mmol/L | 0.5 ± 1.6 | 0.5 ± 1.5 | 0.5 ± 1.6 | 0.08–0.7 |
| Serum SHBG, nmol/L | ||||
| Men | 28.6 ± 1.5 | 31.0 ± 1.5 | 32.4 ± 1.5 | 14–71 |
| Women | 100.2 ± 2.4 | 126.1 ± 2.6 | 137.3 ± 2.3 | 20–155 |
| Serum testosterone, nmol/L | ||||
| Men | 18.4 ± 1.4 | 17.6 ± 1.6 | 19.7 ± 1.4 | 10–38 |
| Women | 1.3 ± 1.4 | 1.3 ± 1.4 | 1.3 ± 1.4 | 0.4–2 |
| Plasma uric acid, μmol/L | 290.1 ± 1.6 | 286.4 ± 1.3 | 279.7 ± 1.3 | 230–480/155–400b |
| hsCRP, mg/L | 1.0 ± 3.5 | 1.2 ± 3.3 | 1.0 ± 3.7 | 0.2–3 |
| Plasma alanine aminotransferase, U/L | 23.0 ± 1.7 | 21.9 ± 1.8 | 21.1 ± 1.7 | <50/<35b |
| Plasma aspartate transaminase, U/L | 22.5 ± 1.4 | 24.7 ± 1.4 | 23.3 ± 1.4 | 15–45/15–35b |
| Plasma gamma glutamate, U/L | 19.2 ± 1.8 | 20.2 ± 1.8 | 18.0 ± 1.7 | <60/<40b |
| Systolic blood pressure, mm Hg | 119.4 ± 14.3 | 126.2 ± 16.4 | 122.6 ± 15.0 | <130 |
| Diastolic blood pressure, mm Hg | 75.1 ± 7.5 | 76.8 ± 8.9 | 76.0 ± 8.1 | <85 |
| Heart rate, beats/min | 71.0 ± 13.0 | 74.2 ± 14.0 | 72.7 ± 12.1 | 60–80 |
Mean values other than those for blood pressure and pulse are geometric; the geometric mean is the nth root of the product of n values. Geometric SDs correspond to percentage of increase in a variable corresponding to one SD unit change in the logarithm of the variable. Statistical comparisons among the three groups are presented in Table 3.
Abbreviation: ApoB, apolipoprotein B.
Offspring of normoglycemic mothers with normal prepregnancy weight.
Men/women.
Cardiometabolic markers in OGDM
Clear associations were found between the maternal GDM and adult offspring cardiometabolic markers (Table 3). The fasting glucose and insulin levels were higher in the OGDM than in the controls. However, after adjustment for confounders and current offspring characteristics, including BMI, these differences were attenuated to nonsignificance (Table 3) (20). Furthermore, the SHBG was lower in both men and women in the OGFM group. Also HDL-C, lipoprotein (a), and apolipoprotein A1 (ApoA1) were lower; apart from lipoprotein (a), these differences survived adjustment for confounders and current characteristics. No statistically significant differences were seen in heart rate, testosterone, LDL-C, TGs, apolipoprotein B (ApoB), free fatty acid (FFA), uric acid, or liver test results (alanine aminotransferase, aspartate transaminase, gamma glutamate). In model 1, TC and blood pressure were similar between the OGDM and control groups. After adjustment for confounders and current characteristics, TC and systolic and diastolic blood pressure were slightly lower in the OGDM group (Table 3) (20).
Cardiometabolic Markers of Young Adults Stratified by Group
| Characteristic or Measure | Controlsa (n = 556) | Maternal GDM (n = 193) | Maternal Prepregnancy Obesity or Overweight, No GDM (n = 157) | ||||
|---|---|---|---|---|---|---|---|
| Mean Differenceb | 95% CI | P Value | Mean Differenceb | 95% CI | P Value | ||
| Fasting plasma glucose, mmol/L | 5.1 ± 1.1 | ||||||
| Model 1c | 1.6 | 0.1 to 3.1 | 0.03 | 2.3 | 0.5 to 4.3 | 0.01 | |
| Model 4c | 0.4 | −1.3 to 2.2 | 0.62 | 0.4 | −1.5 to 2.3 | 0.69 | |
| Fasting serum insulin, mU/L | 14.8 ± 2.6 | ||||||
| Model 1 | 12.7 | 4.4 to 21.9 | 0.002 | 8.7 | 0.2 to 17.8 | 0.05 | |
| Model 4 | 8.4 | −0.1 to 17.6 | 0.05 | −3.1 | −10.7 to 5.0 | 0.44 | |
| Serum testosterone in men, nmol/L | 19.7 ± 1.4 | ||||||
| Model 1 | −7.9 | −15.2 to 0.2 | 0.06 | −10.1 | −18.4 to −0.9 | 0.03 | |
| Model 4 | −7.3 | −15.9 to 2.1 | 0.12 | −6.1 | −15.4 to 4.2 | 0.23 | |
| Serum testosterone in women, nmol/L | 1.3 ± 1.4 | ||||||
| Model 1 | 0.2 | −8.6 to 9.7 | 0.97 | 1.0 | −7.7 to 10.6 | 0.83 | |
| Model 4 | 3.8 | −7.0 to 15.8 | 0.51 | 0.5 | −9.4 to 11.5 | 0.92 | |
| Serum SHBG in men, nmol/L | 32.4 ± 1.5 | ||||||
| Model 1 | −12.4 | −20.2 to −3.9 | 0.005 | −3.9 | −13.3 to 6.5 | 0.45 | |
| Model 4 | −10.3 | −19.2 to −0.5 | 0.04 | 2.7 | −7.9 to 14.6 | 0.63 | |
| Serum SHBG in women, nmol/L | 137.3 ± 2.3 | ||||||
| Model 1 | −33.2 | −46.3 to −16.8 | 0.0003 | −3.3 | −22.3 to 20.3 | 0.76 | |
| Model 4 | −36.6 | −50.9 to −18.0 | 0.001 | 2.0 | −20.4 to 30.6 | 0.88 | |
| Serum FFA, mmol/L | 0.5 ± 1.6 | ||||||
| Model 1 | −3.6 | −11.0 to 4.5 | 0.37 | 3.9 | −4.1 to 12.6 | 0.35 | |
| Model 4 | −6.9 | −15.5 to 2.5 | 0.15 | 2.2 | −6.7 to 12.0 | 0.64 | |
| TC, mmol/L | 4.6 ± 1.2 | ||||||
| Model 1 | −2.9 | −6.5 to 0.9 | 0.14 | 1.9 | −3.9 to 8.1 | 0.53 | |
| Model 4 | −3.9 | −7.5 to −0.2 | 0.04 | −0.3 | −4.0 to 3.6 | 0.88 | |
| HDL-C, mmol/L | 1.6 ± 1.3 | ||||||
| Model 1 | −6.6 | −10.9 to −2.2 | 0.004 | −0.6 | −7.3 to 6.5 | 0.86 | |
| Model 4 | −5.4 | −9.4 to −1.0 | 0.02 | −1.8 | −5.8 to 2.4 | 0.40 | |
| LDL-C, mmol/L | 2.6 ± 1.3 | ||||||
| Model 1 | −1.4 | −7.5 to 5.2 | 0.67 | 2.6 | −6.9 to 13.1 | 0.59 | |
| Model 4 | −4.0 | −9.8 to 2.0 | 0.19 | 0.2 | −5.5 to 6.3 | 0.95 | |
| TGs, mmol/L | 0.9 ± 1.6 | ||||||
| Model 1 | 5.5 | −3.7 to 15.8 | 0.25 | 6.5 | −7.1 to 22.1 | 0.36 | |
| Model 4 | 0.0 | −8.8 to 9.6 | 0.98 | −1.0 | −9.6 to 8.3 | 0.82 | |
| Lipoprotein (a) mg/L | 95.1 ± 3.1 | ||||||
| Model 1 | −18.9 | −33.9 to −0.4 | 0.05 | 4.3 | −16.1 to 29.4 | 0.70 | |
| Model 4 | −10.1 | −30.0 to 15.5 | 0.40 | 6.3 | −17.1 to 36.3 | 0.63 | |
| ApoA1, g/L | 1.5 ± 1.2 | ||||||
| Model 1 | −4.5 | −7.5 to −1.4 | 0.005 | −2.7 | −5.6 to 0.4 | 0.09 | |
| Model 4 | −4.6 | −8.1 to −1.0 | 0.01 | −2.0 | −5.2 to 1.4 | 0.25 | |
| ApoB, g/L | 0.7 ± 1.3 | ||||||
| Model 1 | −1.6 | −6.1 to 3.1 | 0.50 | −0.1 | −2.3 to 2.1 | 0.91 | |
| Model 4 | −4.5 | −9.5 to 0.9 | 0.10 | 0.3 | −4.6 to 5.4 | 0.91 | |
| Plasma uric acid, μmol/L | 279.7 ± 1.3 | ||||||
| Model 1 | 4.5 | −2.8 to 12.2 | 0.23 | 2.9 | −1.9 to 8.0 | 0.23 | |
| Model 4 | −2.9 | −8.4 to 3.1 | 0.35 | −2.8 | −6.7 to 1.2 | 0.17 | |
| hsCRP, mg/L | 1.0 ± 3.7 | ||||||
| Model 1 | −14.6 | −33.6 to 9.7 | 0.22 | −4.3 | −33.9 to 38.7 | 0.82 | |
| Model 4 | −17.0 | −35.8 to 7.4 | 0.16 | 16.4 | −8.7 to 48.6 | 0.22 | |
| Plasma alanine aminotransferase, U/L | 21.1 ± 1.7 | ||||||
| Model 1 | 4.5 | −4.9 to 14.8 | 0.36 | 13.2 | −2.0 to 30.7 | 0.09 | |
| Model 4 | −1.7 | −10.4 to 8.0 | 0.72 | −1.9 | −10.6 to 7.8 | 0.70 | |
| Plasma aspartate transaminase, U/L | 23.3 ± 1.4 | ||||||
| Model 1 | 1.9 | −4.9 to 9.3 | 0.60 | 3.9 | −7.0 to 16.2 | 0.50 | |
| Model 4 | 1.6 | −5.0 to 8.7 | 0.64 | 0.2 | −6.2 to 7.0 | 0.95 | |
| Plasma gamma glutamate, U/L | 18.0 ± 1.7 | ||||||
| Model 1 | 4.9 | −4.6 to 15.4 | 0.32 | 7.8 | −6.2 to 24.0 | 0.29 | |
| Model 4 | −1.3 | −10.5 to 8.9 | 0.79 | −0.3 | −9.2 to 9.6 | 0.96 | |
| Systolic blood pressure, mm Hgb | 122.6 ± 15.0 | ||||||
| Model 1 | −0.9 | −2.7 to 1.0 | 0.36 | 0.0 | −2.0 to 2.0 | 1.0 | |
| Model 4 | −3.6 | −5.7 to −1.5 | 0.001 | −3.5 | −5.7 to −1.4 | 0.001 | |
| Diastolic blood pressure, mm Hgb | 76.0 ± 8.1 | ||||||
| Model 1 | −0.9 | −2.2 to 0.5 | 0.21 | 0.4 | −1.0 to 1.9 | 0.61 | |
| Model 4 | −2.2 | −3.8 to −0.7 | 0.006 | −1.6 | −3.2 to 0.0 | 0.05 | |
| Heart rate, beats/minb | 72.7 ± 12.1 | ||||||
| Model 1 | −1.2 | −3.3 to 0.9 | 0.27 | 1.4 | −0.8 to 3.6 | 0.21 | |
| Model 4 | −1.0 | −3.5 to 1.5 | 0.41 | 1.1 | −1.5 to 3.6 | 0.41 | |
Offspring of normoglycemic mothers with normal prepregnancy weight.
Mean differences for blood pressures expressed as mm Hg and heart rate as beats/min; remaining results presented as percentage of differences.
Multiple linear regression models as follows: model 1, adjusted for age, sex, and source cohort; model 4, adjusted for age, sex, source cohort, gestational age, birthweight SD score, maternal hypertension or preeclampsia during pregnancy, maternal smoking during pregnancy, parental educational attainment, and parental hypertension, diabetes, stroke or myocardial infarction, BMI, height, and daily smoking [models 2 and 3 are provided in an online repository (20)].
We further reran all analyses, replacing the BMI and height with the lean body mass and fat percentage in models 3 and 4 (data not shown). The results remained similar for model 3. In model 4, our findings of lower FFA (−9.2%; 95% CI, −17.6 to −0.1) and high-sensitivity C-reactive protein (hsCRP) (−23.2; 95% CI, −40.3 to −1.1) in the OGDM group both reached statistical significance.
To further distinguish between the effects of maternal GDM and maternal overweight/obesity on adult offspring cardiovascular risk factors, we reran all analyses separately, comparing the offspring of mothers with (i) GDM and prepregnancy BMI <25 kg/m2 (n = 115) and (ii) GDM and prepregnancy BMI ≥25 kg/m2 (n = 71) with the offspring of controls (n = 556). Most of our results remained similar (20). A combination of maternal GDM and overweight/obesity showed a greater effect on fasting glucose and insulin compared with maternal overweight/obesity alone. Adjusting for confounders attenuated these differences between groups and largely resulted from offspring BMI as a mediator in the OGDM group with maternal BMI ≥25 kg/m2.
Cardiometabolic markers in offspring of mothers with overweight/obesity
Associations found between maternal prepregnancy overweight/obesity and adult offspring cardiometabolic markers were mostly explained by the current offspring characteristics and confounders (Table 3). Fasting glucose and insulin were both higher in the ONO group compared with the controls. These findings disappeared after adjustments in models 2 to 4 (Table 3) (20). In men, serum testosterone was lower in model 1. This difference was also attenuated after adjustment in models 2 to 4. All other cardiometabolic markers, including heart rate, SHBG, FFA, TC, HDL-C, LDL-C, TGs, lipoprotein (a), ApoA1, ApoB, liver test results, and uric acid were similar between the ONO and control groups. Only in model 2 was hsCRP higher in the ONO group; however, adjustment for confounders diluted this finding. In addition, although the systolic blood pressure was not different among the groups in model 1, it was somewhat lower in models 2 to 4 for the ONO group (Table 3) (20).
Just as for OGDM, we reran all analyses comparing the ONO and control groups, replacing BMI and height with lean body mass and fat percentage in models 3 and 4. No changes were seen in the results (data not shown).
We further reran all analyses separately to compare the offspring of mothers with prepregnancy BMI ≥30 kg/m2 (n = 28) and the controls. Most results remained similar (data not shown). However, in model 1, hsCRP (66.2%; 95% CI, 3.6 to 166.3), TGs (21.5%; 95% CI, 2.3% to 44.3%) and ApoB (10.8%; 95% CI, 0.1% to 22.7%) were all greater in the offspring exposed to maternal prepregnancy obesity compared with the controls. Furthermore, in model 1, the heart rate was lower (−5.5%; 95% CI, −10.0 to −1.0) and fasting plasma glucose was similar (−1.3%; 95% CI, −4.3% to 1.7%) between the obesity-exposed groups and controls. After full adjustment (model 4), all results were similar between the ONO and control groups for all cardiometabolic markers (data not shown).
Discussion
We combined the data from two longitudinal birth cohorts to study common cardiometabolic markers in the adult offspring of mothers with GDM or overweight/obesity at the start of pregnancy. The present study had two main findings. First, maternal GDM was associated with increased insulin resistance and the risk of an atherogenic lipid profile in the adult offspring. Some, but not all, of this association was explained by the confounding factors or current offspring characteristics, including adiposity. Second, in the offspring of mothers with prepregnancy overweight/obesity without GDM, the consequences were not as clear. They had higher fasting glucose and insulin levels compared with the controls, which was, in part, explained by parental and prenatal confounders or adult BMI or body fat percentage, but similar levels of other cardiometabolic markers. This pattern differed from that of body composition. In this same cohort, exposure to both maternal GDM and overweight/obesity was associated with greater offspring fat percentage and waist circumference, with stronger associations found related to maternal overweight/obesity (11).
Our findings of greater fasting glucose and insulin levels in the OGDM group compared with the controls were attenuated to nonsignificance after adjustment for confounders and current characteristics. To further differentiate between the effects of maternal GDM and maternal overweight/obesity on offspring cardiometabolic health, we divided the OGDM participants into two subgroups according to the maternal prepregnancy weight (BMI <25 kg/m2 vs BMI ≥25 kg/m2). A combination of maternal GDM and overweight/obesity showed a greater effect on fasting glucose and insulin compared with maternal overweight/obesity alone. In the fully adjusted model, the adjustments attenuated these differences in fasting glucose and insulin. This attenuation largely resulted from offspring BMI as a mediator in the OGDM subgroup with a maternal BMI ≥25 kg/m2. Furthermore, we found an atherogenic lipid profile in the OGDM group compared with the controls, with a lower HDL-C and ApoA1 in the OGDM group. ApoA1 is a major component of HDL-C, and low ApoA1 levels are a well-established risk factor for atherosclerosis.
In addition to the commonly measured indicators, we found lower SHGB in both OGDM men and women. SHBG is a measure of insulin resistance and hyperandrogenism, which might reflect increased cardiometabolic risks later in life.
Traditionally, the global obesity epidemic has been explained by the increase in the availability and consumption of energy-dense foods and a simultaneous reduction in physical activity. However, other factors behind this increase in obesity prevalence exist, including genetic factors, an adverse intrauterine milieu, and the epigenetic changes this milieu might provoke (2). GDM is a common cause of such an adverse milieu and can cause epigenetic changes in offspring. For instance, in a GDM mouse model, offspring exposed to GDM showed altered DNA methylation patterns in the pancreas, and this phenotype was characterized by dyslipidemia, insulin resistance, and glucose intolerance (3). Our findings suggest that maternal GDM and prepregnancy overweight without a diagnosis of GDM might have distinct effects on offspring health. Previous studies have shown robust associations between greater maternal prepregnancy BMI and offspring adiposity, as indicated by an increased fat mass, fat-free mass, and percentage of body fat in both neonates (8) and 6- to 7-year-old children (9); a greater BMI and greater waist circumference in adolescence (10); a greater BMI, waist circumference, fat mass, and fat percentage in young adulthood (11); and greater fat mass and BMI at older age (12). Regarding prepregnancy BMI and offspring cardiometabolic risk factors, Gaillard et al. (21) reported an adverse cardiometabolic profile (including lipid levels, glucose, insulin, and homeostatic model assessment of insulin resistance) in 1392 adolescents at a mean age of 17 years. These associations were independent of maternal GDM and were largely mediated by adolescent BMI. In another study of 1400 participants at 32 years of age, a greater maternal prepregnancy BMI was associated with higher offspring blood pressure, insulin, and TGs and lower HDL-C (22), again independent of maternal GDM and fully explained by the current BMI of the offspring. This is consistent with our finding of higher fasting glucose and insulin levels among the ONO participants, who, however, had serum lipids and other biomarkers similar to those of the controls.
Regarding the offspring of mothers with GDM, a previous study of 16-year-old individuals, in one of our source cohorts, showed that they had a higher BMI and waist circumference at adolescence compared with offspring of mothers without GDM (4). Furthermore, in that study, the fasting insulin was greater and the homeostatic model assessment for insulin resistance was lower in the offspring of mothers with GDM, although the blood lipids and glucose were similar to those of the controls. To some extent, maternal GDM has also been associated with adult offspring body composition. In the same cohort participants, for whom we now report the cardiometabolic markers in the present study, higher fat percentages were seen in the offspring exposed to GDM (11). Regarding the maternal diabetes and offspring cardiometabolic risk factors in adulthood, a large Canadian cohort study of 467,850 mother–infant dyads, described an association between both maternal type 2 diabetes mellitus (T2DM) during pregnancy and GDM with T2DM in offspring by age 30 years (23). In that study, exposure to maternal T2DM during pregnancy conferred a greater risk to offspring compared with GDM exposure (3.19 vs 0.80 cases of T2DM/1000 person-years) (23). In line with the Canadian study, we also found increased markers of insulin resistance (i.e., higher fasting insulin and lower SHBG, HDL-C, and ApoA1), in offspring with prenatal exposure to maternal GDM compared with the controls.
Recently, Bellatorre et al. (24) reported an increase in liver fat, independent of offspring adiposity, in both childhood (mean age, 10.4 years) and adolescence (mean age, 16.4 years) in the offspring of mothers with prepregnancy obesity (BMI ≥30 kg/m2). However, no such effect was found in the offspring of mothers with GDM (24). In our study, we did not find any associations between GDM or maternal prepregnancy overweight/obesity and biochemical markers of increased liver fat. The liver enzyme levels of the offspring were similar among the groups.
The strengths of our study included a rather large sample size and long follow-up time. One of the indications for screening GDM was a prepregnancy BMI ≥25 kg/m2; thus, mothers with GDM could be reliably separated from our group of normoglycemic mothers with overweight/obesity. To further distinguish between the effects of maternal GDM and maternal overweight/obesity on offspring cardiometabolic health, we reran all analyses with OGDM participants further divided into two subgroups according to maternal prepregnancy weight (BMI <25 kg/m2 and BMI ≥25 kg/m2 vs controls). In these subgroup analyses with a diminished numbers of participants, our results remained similar. Our participants were from an ethnically homogenous Finnish population, combined from two longitudinal study cohorts. The homogeneity of our study population could have decreased the generalizability of our findings. Furthermore, in the analyses, we adjusted for important confounders, including perinatal- and pregnancy-related factors; parental hypertension, diabetes, stroke, and myocardial infarction; and current participant-related factors. However, residual confounding remained possible. Both treatment and GDM screening guidelines have changed during the previous 25 years. This could have introduced bias, depending on the adequacy of the screening. Thus, the GDM offspring in the present study might represent a more severe end of the GDM spectrum in today’s pregnant women. However, we do not have data on the maternal glucose levels throughout pregnancy.
In conclusion, we found that maternal GDM is associated with increased levels of insulin resistance and a more atherogenic lipid profile in young adult offspring compared with controls. These findings suggest an increased risk of cardiometabolic diseases later in life. Maternal prepregnancy overweight or obesity alone was associated with offspring insulin resistance; however, the association was weaker and explained by current adiposity in the offspring.
Acknowledgments
Financial Support: The present study was supported by the Academy of Finland (SALVE program for 2009–2012 and grants 127437, 129306, 130326, 134791, 263924, and 274794 to E.K., J.G.E., K.R., K.H.), Arvo and Lea Ylppö Foundation (to A.L.), Doctoral Programme for Public Health, University of Tampere (to M.S.), Emil Aaltonen Foundation (to E.K.), European Commission (Framework 5 award QLG1-CT-2000-001643 to M.-R.J.; H2020 award SC1-2016-RTD-733180 RECAP to E.K.), Foundation for Pediatric Research (to E.K., M.T., and A.L.), Finnish Government Special Subsidiary for Health Sciences (to J.G.E.), and Finnish Medical Societies; Duodecim (to E.K.), Finska Läkaresällskapet (to J.G.E., S.A., N.K.), Stiftelsen Dorothea Olivia, Karl Walter och Jarl Walter Perkléns minne (to N.K.), Svenska Kulturfonden (to N.K.), Jalmari and Rauha Ahokas Foundation (to E.K.), Juho Vainio Foundation (to E.K., M.S., M.T., M.V., N.K.), National Graduate School of Clinical Investigation (to M.T.), the Novo Nordisk Foundation (to E.K., M.V.), Signe and Ane Gyllenberg Foundation (to E.K., J.G.E., N.K.), Sigrid Jusélius Foundation (to E.K.), Yrjö Jahnsson Foundation (E.K., M.S., N.K., M.V.), Bundesministerium für Forschung und Technik (Federal Government of Germany, Ministry of Science and Technology) program grants PKE 4 and JUG 14 (grants 0706224, 0706564, and 01EP9504 to D.W.), Samfundet Folkhälsan (to J.G.E.), and Päivikki and Sakari Sohlberg Foundation (to S.A.). The supporters of the study had no role in the study design; collection, analysis, or interpretation of the data; writing of the report; or the decision to submit the report for publication.
Disclosure Summary: The authors have nothing to disclose.
Abbreviations:
- ApoA1
apolipoprotein A1
- ApoB
apolipoprotein B
- AYLS
Arvo Ylppö Longitudinal Study
- BMI
body mass index
- FFA
free fatty acid
- GDM
gestational diabetes mellitus
- HDL-C
high-density lipoprotein cholesterol
- hsCRP
high-sensitivity C-reactive protein
- LDL-C
low-density lipoprotein cholesterol
- OGDM
offspring of mothers with gestational diabetes mellitus
- OGTT
oral glucose tolerance test
- ONO
offspring of normoglycemic mothers with prepregnancy overweight/obesity
- T2DM
type 2 diabetes mellitus
- TC
total cholesterol
- TG
triglyceride
