


Abstract
GH and IGF-1 are crucial for attainment of normal body size and regulation of food intake, nutrient storage, and insulin sensitivity. Enteroendocrine connections exist between the GH–IGF-1 axis and insulin, ghrelin, and glucagon-like peptide 1 (GLP-1). The status of these connections in GH deficiency (GHD) is unknown.
To study the enteroendocrine connections before and after a standard meal test in a homogeneous population of adults with congenital untreated isolated GHD (IGHD) due to a mutation in the GHRH receptor gene.
In a cross-sectional study of 20 individuals with IGHD and 20 control subjects, we measured glucose, insulin, ghrelin, and GLP-1 before and 30, 60, 120, and 180 minutes after a standardized test meal. Homeostasis model assessment index of insulin resistance (HOMA-IR) and homeostasis model assessment (HOMA)-β were calculated. Participants scored feelings of hunger, fullness, and prospective food consumption on a visual analog scale.
Area under the curve (AUC) values of glucose, insulin, ghrelin, GLP-1, hunger, fullness, and prospective food consumption.
Fasting HOMA-IR and HOMA-β were lower in individuals with IGHD than in control subjects (P = 0.002 and P = 0.023, respectively). AUC was higher for hunger (P < 0.0001), glucose (P = 0.0157), ghrelin (P < 0.0001), and GLP-1 (P < 0.0001) and smaller for fullness (P < 0.0001) in individuals with IGHD compared with control subjects. There was no difference in AUC for prospective food consumption or insulin.
Untreated IGHD is associated with increased GLP-1 secretion and reduced postprandial ghrelin and hunger attenuation in response to a mixed meal. These enteroendocrine connections can result in a favorable outcome in terms of environmental adaptation and guaranteeing appropriate food intake and can confer metabolic benefits.
GH and IGF-1 are crucial for the attainment of normal body size and for the regulation of key bodily functions, including food intake, nutrient storage, and insulin sensitivity (1). Pituitary GH secretion is under a balanced control by two stimulatory (GHRH and ghrelin) and one inhibitory (somatostatin) peptide and the feedback control by circulating (mainly from liver origin) IGF-1. The enteroendocrine connections between the GH–IGF-1 axis, insulin, ghrelin, and glucagon-like peptide 1 (GLP-1) are not completely understood, but they must exist because growth requires adequate energy and nutritional input. In this sense, insulin and GH are essential to adjust the energy utilization to the amount of food, promoting anabolism or catabolism when necessary. Insulin is the main metabolic hormone in the fed state, whereas GH assumes a key role as a stimulator of lipolysis during prolonged fasting (2). Additionally, the ghrelin–GH axis seems to have an essential role in surviving starvation, at least in mice (3).
Ghrelin, discovered in 1999 (4), has 28 amino acids and the n-octanoylation of the serine 3 position in the molecule that is necessary for its bioactivity. It is produced in gastrointestinal cells particularly in the fundus of the stomach. Ghrelin increases GH secretion, reduces insulin secretion, and stimulates hunger, peaking before and falling after meals (5–7). In mice, ghrelin seems not be not an essential regulator of food intake but has a redundant action in the regulation of appetite and an important role in determining metabolic fuel preference (8). Although ghrelin is the only known appetite-stimulating hormone in humans (9) and is a potent endogenous enhancer of the GH–IGF-1 axis (10), its role in human pathophysiology is still debated (11).
GLP-1 is a tissue-specific posttranslational proteolytic product of the proglucagon gene. It is secreted by the enteroendocrine L-cells in response to nutrient ingestion. GLP-1 potentiates insulin secretion and inhibits glucagon secretion (incretin effect) and contributes to satiety, peaking about 1 hour after meals (12–14). A novel enteroendocrine connection has recently been described through which ghrelin enhances GLP-1 secretion in mice (15, 16) and probably in humans (7). Additionally, mice with GH deficiency (GHD) with ablation of the GHRH gene eat more and have higher serum ghrelin levels than GH-sufficient mice, suggesting that a negative feedback exists between the GH–IGF-1 axis and ghrelin secretion and that elevated ghrelin in GHD could lead to increased feeding (17). Finally, a feedback loop seems to exist between GLP-1 and somatostatin, by which GLP-1 increases somatostatin release and somatostatin decreases GLP-1 secretion (18–20).
The impact of GHD in these enteroendocrine connections in humans is presently unknown. Acquired GHD is often part of multiple pituitary hormones deficits, often after surgery or pituitary irradiation, and sometimes with inadequate substitutions. Additionally, it often occurs with comorbidities such as obesity, insulin resistance, or dyslipidemia. This myriad of confounding factors makes it difficult to analyze the clear impact of GHD on these connections. We have described a large cohort of subjects residing in Itabaianinha County in northeastern Brazil who are affected by severe dwarfism due to isolated GHD (IGHD) caused by the homozygous c.57+1 G→A mutation in the GHRH gene (GHRHR, OMIM n. 612781), resulting in very low serum GH and IGF-1 throughout life (21). We have previously shown by oral glucose load that these subjects with IGHD exhibit a combination of reduced β-cell function and increased insulin sensitivity (22). Despite the complete resistance to GHRH, in these subjects GH secretion responds, albeit minimally, to ghrelin receptor agonists (23).
It is possible that severe IGF-1 deficiency causes a reduction of somatostatin tone, which in turn may influence the secretion of GLP-1. In addition, we have reported that these subjects with IGHD eat proportionally more than matched control subjects (24). Therefore, we hypothesized that these subjects may have higher circulating ghrelin levels, resulting in reduced insulin secretion, partially compensated by an increase in GLP-1.
The purpose of this work was to study the enteroendocrine connections between these hormones and the feeding perceptions before and after a standard meal test in adult subjects with lifetime, congenital, untreated IGHD.
Subjects and Methods
In a cross-sectional study, 20 (11 men) subjects with IGHD and 20 (11 men) control subjects matched by age and sex were recruited by ads placed in the local Dwarfs Association building and by word of mouth among the inhabitants of the municipality of Itabaianinha. Inclusion criteria for IGHD were short stature and confirmed genotype for GHRHR homozygous c.57+1 A→ G mutation; the control group consisted of individuals of normal height and with the homozygous genotype to the wild-type GHRHR allele. Exclusion criteria were age <25 years and >80 years and use of glucocorticoids, GH, levothyroxine, or sedative or psychiatric stimulant drugs.
All procedures performed in studies involving human participants were in accordance with the ethical standards of the institutional and national research committee and with the 1964 Helsinki declaration and its later amendments or comparable ethical standards.
Study protocol
Anthropometric measurements
Height was measured with a wall-mounted stadiometer (digital wall stadiometer model HM210D; Charder Medical Weighing and Measuring Products, Taichung City, Taiwan). Weight was measured with a portable platform scale (model MS2510; Charder Medical Weighing and Measuring Products). Body mass index (BMI) was calculated by the formula: weight (kilograms)/height (meters)2.
Standard meal test
A standard meal test was performed at the University Hospital of Sergipe. After a 10-hour fast, a catheter for peripheral venous access was inserted. Blood collection times were immediately before ingestion and 30, 60, 120, and 180 minutes after standardized test meal intake. The meal was composed of 70 g of powder diet based on soy protein isolate; the powder was hyposodic and without sucrose, lactose, and gluten. It had 315 Kcal [56% from carbohydrates (44.1 g), 30% from lipids (10.5 g), and 14% (11 g) from proteins] and was diluted in water to a final volume of 250 mL to be consumed in up to 10 minutes. At specified times for blood collection, participants scored feelings of hunger, fullness, and prospective food consumption on a visual analog scale (VAS). The questionnaire had horizontal lines without graduation and was cut into pieces of paper of the same height and 10 cm in length. One question was placed above each line and opposite answers at its ends. Individuals scored on the line which most corresponded to their feelings at the time of the question, and the distance between the left end of the line to the marked mark was quantified (25).
The term “hunger” consists of a subjective idea used to express the motivation to eat. It was judged by the question “How much hunger do you feel?” The answers at the end of the VAS were “I'm not hungry at all” and “I've never been so hungry.” The feeling of fullness was evaluated by the question “How satisfied are you?” The answers at the end of the VAS were “I am completely empty” and “I am completely full.” Prospective consumption was evaluated by the question “How much do you think you can eat?” The answers at the end of the VAS were “nothing” and “too much” (26–28).
At each time point, 10 mL of blood was collected. Blood samples were placed in cooled tubes containing Na2-EDTA (1 mg/mL). Plasma was immediately separated by centrifugation at 4°C. Plasma for total ghrelin and GLP-1 measurement was stored at −70°C and transported in dry ice to the Endocrinology Laboratory of the Ribeirao Preto Medical School, University of São Paulo, until analysis in a single run. The samples were thawed only once at the time of dosing. The concentrations of total plasma ghrelin (ref. EZGRT-89K) and GLP-1 (ref. EZGLP1T-36K) were determined by ELISA assay kits (EMD Millipore Corporation, St. Charles, MO), with sensitivities of 4.1 and 159.4 pg/mL, respectively. These assays quantify total ghrelin (intact and des-octanoyl) and total GLP-1 (isoforms 7-36 and 9-36). The specificity of the ghrelin assay includes human ghrelin (active) 80%, des-octanoyl human ghrelin 100%, and canine ghrelin 70%. The antibody pair used in the GLP-1 assay measures GLP-1 (isoform 7-36) and (isoform 9-26) and has no significant cross-reactivity with GLP-2, GIP, glucagon, and oxyntomodulin. We used two quality controls for each assay. For ghrelin, our results were 607.15 pg/mL (expected range, 371 to 771 pg/mL) and 2504 pg/mL (expected range, 1545 to 3209 pg/mL). For GLP-1, our results were 41.1 pg/mL (expected range, 31 to 65 pg/mL) and 304.2 pg/mL (expected range, 172 to 357 pg/mL).
Glucose was measured by the enzymatic Trinder colorimetric test in the same day of each test. IGF-1 was measured by a solid-phase, enzyme-labeled chemiluminescent immunometric assay (Immulite 2000; Siemens Health Care Diagnostics Products Ltd, Malvern, PA), with a sensitivity of 25 ng/mL. Insulin was measured by a chemiluminescent microparticle immunoassay (Architect; Abbott Laboratories Diagnostic Division, Abbott Park, IL), with a sensitivity of 1.0 µU/mL. These measurements were performed in the laboratory of the University Hospital of the Federal University of Sergipe.
Insulin sensitivity and β-cell function
Insulin sensitivity was estimated by the homeostasis model assessment index of insulin resistance (HOMA-IR) with the formula: fasting serum insulin (µU/mL) × fasting plasma glucose (mmol/L)/22.5. β-Cell function was estimated using the basal glucose and insulin values by the HOMA-β with the formula: [(20 × fasting insulin (µU/mL)]/[fasting glucose (mmol/L) − 3.5].
The Federal University of Sergipe Institutional Review Boards approved these studies, and all subjects gave written informed consent.
Statistics
The variables with normal distribution were expressed as mean (SD) and compared by Student t test. The variables with non-normal distribution (insulin, HOMA-IR, HOMA-β, ghrelin, and GLP-1) were expressed as median (interquartile range) and compared by the Mann-Whitney test (SPSS Statistics 23; IBM, Armonk, NY). The software Origin 9.1 (Origin Laboratory Corporation, Northampton, MA) was used to calculate the area under the curve (AUC) of glucose, insulin, ghrelin, GLP-1, hunger, fullness, and prospective food consumption, with the standard meal test. The mean difference and the 95% CI were calculated for these comparisons. A CI of the difference between the two groups that does not contain zero implies a significant difference between the groups. We also performed comparisons for the studied variables at each time after the meal by the Mann-Whitney test. Statistical significance was set at P < 0.05.
Results
Table 1 shows the anthropometric and baseline data of glucose, insulin, IGF-1, ghrelin, GLP-1, hunger, fullness, and prospective consumption. Height (P < 0.0001), weight (P < 0.0001), IGF-1 (P < 0.0001), glucose (P = 0.0157), insulin (P = 0.002), HOMA-IR (P = 0.002), and HOMA-β (P = 0.023) were significantly lower in patients with IGHD than in control subjects, but no difference was found in the baseline values of the other variables. The analysis of the comparisons for the variables studied at each time point after the meal revealed for glucose a tendency of greater value at 120 minutes (P = 0.06), for insulin a higher value at 180 minutes (P = 0.009), and for GLP-1 higher values at 30 minutes (P = 0.021) and at 120 minutes (P = 0.035).
Anthropometric and Baseline Data of Glucose, Insulin Ghrelin, GLP-1, Hunger, Fullness, and Prospective Consumption Data of 20 Individuals With IGHD and 20 Control Subjects
| IGHD | Control Subjects | P | |
|---|---|---|---|
| Age, y | 49.4 (13.4) | 48.6 (13.6) | 0.889 |
| Male, n | 11 | 11 | 1 |
| Height, m | 1.3 (0.1) | 1.6 (0.1) | <0.0001 |
| Weight, kg | 40.6 (6.4) | 77.8 (15.0) | <0.0001 |
| BMI | 25.8 (5.1) | 28.4 (3.7) | 0.051 |
| Glucose, mg/dL | 102.8 (18.3) | 125.4 (22.5) | 0.0157 |
| IGF-1, ng/mL | 25.0 (3.4) | 165.5 (29.2) | <0.0001 |
| Insulin, µU/mL | 3.9 (5.5) | 7.7 (3.7) | 0.002 |
| HOMA-IR | 0.9 (1.5) | 2.2 (1.2) | 0.002 |
| HOMA-β | 12.3 (13.9) | 20.4 (11.9) | 0.023 |
| Ghrelin, pg/mL | 595.7 (507.4) | 553.7 (364.9) | 0.433 |
| GLP-1, pg/mL | 32.2 (12.0) | 33 (20.4) | 0.862 |
| Hunger | 4.3 (3.0) | 3.3 (2.1) | 0.219 |
| Fullness | 1.9 (1.7) | 2.8 (1.9) | 0.155 |
| Prospective consumption | 3.8 (1.7) | 4.4 (2.0) | 0.292 |
Data are expressed as mean (SD), except for insulin, IGF-1, HOMAIR, HOMA-β, ghrelin, and GLP-1, which are expressed as median (interquartile range).
The AUC for hunger was higher in subjects with IGHD than in control subjects [773.3 (98.9) vs 578.3 (93.5); mean difference, 195.0; 95% CI, 133.4 to 256.6; P < 0.0001]. Mirroring this finding, fullness was lower [649.9 (89.9) vs 816.3 (87.6); mean difference, 166.4; 95% CI, 109.6 to 223.2; P < 0.0001] in subjects with IGHD compared with control subjects. No difference was noticed in the AUC for prospective food consumption between the two groups [776.1 (86.3) vs 751.6 (87.8); mean difference, 24.5; 95% CI, −31.2 to 80.2; P = 0.3793], respectively.
Figures 1, 2, 3, and 4 show the AUC values of glucose, insulin, ghrelin, and GLP-1, respectively. The AUC for glucose was higher in subjects with IGHD than in control subjects [27,608.2 (1647.8) vs 26,149.5 (1983.6) mg/dL; mean difference, 1458.7; 95% CI, 291.4 to 2626.0; P = 0.0157]. In contrast, the AUC for insulin was similar in the two groups [7457.5 (1151.5) vs 7,255.6 (1079.2) µU/mL; mean difference, 201.9; 95% CI, −512.5 to 916.3; P = 0.57], respectively. The AUC for ghrelin was also higher in subjects with IGHD [131,570.2 (21,575.4) vs control subjects 106,205.6 (10,141.2) pg/mL; mean difference, 25,364.6; 95% CI, 14,573.0 to 36,156.2; P < 0.0001]. Similarly, the AUC for GLP-1 was larger in subjects with IGHD [12,049.1 (1844.9) vs 8442.9 (855.0) pg/mL; mean difference, 3606.2; 95% CI, 2685.7 to 4526.7; P < 0.0001].
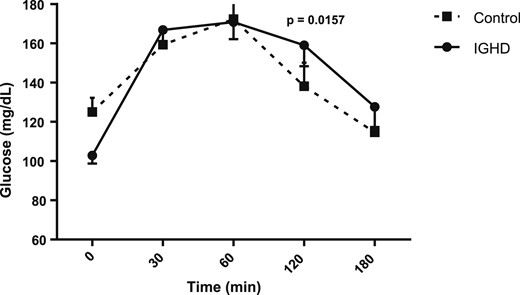
AUC of glucose levels after a standard meal test. Data are expressed as mean (SEM).
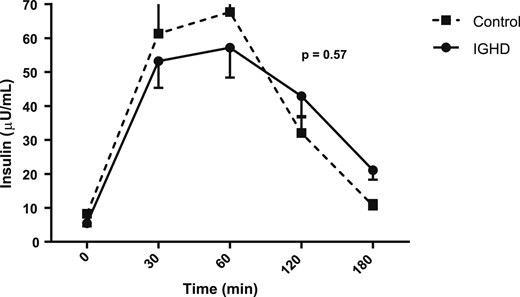
AUC of insulin levels after a standard meal test. Data are expressed as mean (SEM).
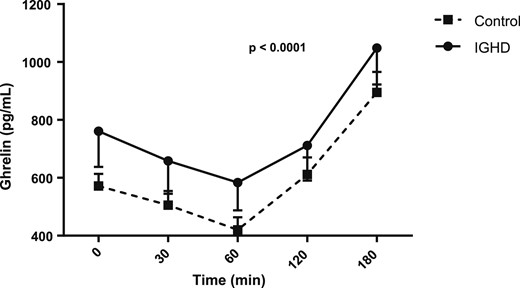
AUC of ghrelin levels after a standard meal test. Data are expressed as mean (SEM).
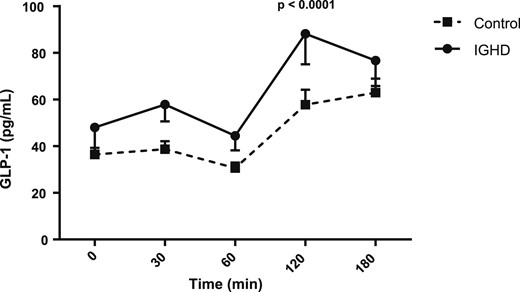
AUC of GLP-1 levels after a standard meal test. Data are expressed as mean (SEM).
Discussion
The goal of this study was to assess the effects of lifetime IGHD on meal-induced secretion of ghrelin and GLP-1 and on feeding perceptions. To this end, we have taken advantage of homogeneous extended kindred of subjects affected by IGHD all due to the same GHRHR mutation. This unique model allows studying the consequences of GHD in subjects who have otherwise normal pituitary function. Subjects with IGHD were compared with normal sex- and age-matched control subjects from the same community. Although height and weight were greatly reduced in the IGHD group, BMI was marginally lower (not reaching significance) the IGHD group. However, this reduction in BMI reflects their small bones and muscles rather than lower adiposity. In fact, we previously reported that, although the fat mass percentage in these subjects with IGHD is similar to control subjects, they have higher visceral adiposity (29).
The baseline data showed that glucose, insulin, HOMA-IR, and HOMA-β were significantly lower in IGHD, as we reported before (22). Ghrelin, GLP-1, and the feeding perceptions at the baseline were not different between the groups. Comparison of each time, after the standard mixed meal, showed mild differences in glucose and insulin, no differences in ghrelin, and higher GLP-1 values at 30 and 120 minutes. However, the individuals with IGHD presented higher AUC values for hunger, glucose, ghrelin, and GLP-1 than control subjects, whereas no difference was observed in AUC values for insulin. These data agree with our previous results obtained with an oral glucose tolerance test, showing larger AUC values for glucose and similar AUC values for insulin in comparison with control subjects (22). In that study, we had concluded that these subjects combine reduced β-cell function with increased insulin sensitivity, as also described in the Ecuadorian cohort of subjects with GH insensitivity (30) and in the GH receptor knockout (GHRKO) mice (31, 32). An oral glucose tolerance test stimulus is critical for the diagnosis of diabetes mellitus or decreased glucose tolerance but may expose the ghrelin-secreting cells of the stomach to a faster increase in simple carbohydrates, which could suppress ghrelin faster and stronger than mixed meals (33). Therefore, we used a physiological approach with a mixed standard meal.
One strength of this work is that we reproduced the well-established pattern of response of ghrelin and GLP-1 after a meal test. Plasma ghrelin levels peak before meals and decline to a nadir during the hour after eating (as we showed in the present study), with changes varying twofold to threefold across the fasting-feeding cycle in healthy subjects (5, 34). On the other hand, GLP-1 is secreted into the circulation after oral nutrient ingestion in a biphasic pattern starting with an early (15-minute) phase that is followed by a longer (60-minute) second phase (14), as we also documented. Another strength of this work was that we used AUC, in addition to using the comparisons at each moment, after the meal. With this approach, we obtained an overall evaluation of the behavior of each metabolite after the meal, calculating the defined integral of the metabolic blood concentration vs time using concentrations measured at the five discrete time points.
In the present study, we found that untreated patients with IGHD have more hunger and less fullness than control subjects. These data fit with the observation that these subjects eat proportionally more than control subjects (24), which inspired the present work. In addition to the subjects with IGHD being active and having low fatigability and adequate muscle function (35), such an increase in hunger may have helped this population to survive and thrive, despite their severe short stature, for centuries in a hostile environmental with several seasons of drought and food scarcity.
The explanation for this increased hunger may come from the higher AUC for ghrelin. Although the stimulatory role of ghrelin on GH secretion is unquestionable, the effects of the GH–IGF-1 axis on ghrelin secretion are still controversial, with some reports of negative feedback between the GH–IGF-1 axis on ghrelin secretion (36, 37) and others showing that serum concentrations of ghrelin are not affected by chronic changes in peripheral GH–IGF-1 action, at least in mouse models (38). We found that this severe GHD is associated with less postprandial ghrelin attenuation. Visceral obesity (29), improved insulin sensitivity (22) with high adiponectin levels (39), and reduced β-cell function (22) accompany this hyperphagia. The seemingly paradoxical association of increased insulin sensitivity with increased visceral adiposity is also found in GHRKO mice, with changes in the secretory activity of visceral fat accompanied by a substantial increase in adiponectin concentrations (40, 41). Transplant of visceral fat from these mice improves insulin sensitivity of normal mice, suggesting a beneficial metabolic role of visceral adipose tissue in states of abolished GH action and severe IGF-1 deficiency (42).
The reduced β-cell function found in our subjects with IGHD, which can lead to the onset of diabetes (22), resembles the reduced development and secretory function of β-cells found in Ames dwarf mice (43) and GHRKO mice (44). Data from the current study add more pieces to this intricate puzzle. Because ghrelin seems to increase insulin sensitivity (36) and reduces β-cell function (7, 36, 45, 46), the lower postprandial ghrelin attenuation could contribute to their reduced β-cell function (22). On other hand, because ghrelin is a potent GLP-1 secretion enhancer (7, 15, 16), we speculate that high ghrelin secretion causes higher GLP-1 secretion, thereby contributing to the increased insulin sensitivity of these subjects with IGHD. Additionally, the reduction of the somatostatin tone can contribute to the increase in GLP-1 in view of the feedback loop between GLP-1 and somatostatin (19–21). Accordingly, the levels of serum TSH are mildly increased in these subjects, possibly reflecting lower secretion of somatostatin release (23). Regardless of the mechanism, due to the beneficial vascular effect of GLP-1 (47) and its analogs (48), this increased endogenous secretion of GLP-1 may contribute to the delay of onset of atherosclerosis in these individuals with IGHD (49, 50) and to their normal life expectancy (51) despite visceral obesity (29) and despite increased blood pressure, total and LDL cholesterol, and C-reactive protein (52). It is also possible that the higher ghrelin secretion contributes to their normal life expectancy because the ghrelin-GH secretagogue receptor-signaling pathway may play an important role in the antiaging mechanism (53).
Our work has some limitations. The higher basal glucose levels in the control group could confound the results. Nevertheless, the AUC for glucose was lower in this group, making it very unlikely that the higher basal glucose contributed to a reduction in AUC for glucose. Furthermore, we did not measure the active acyl-ghrelin and the inactive desacyl-ghrelin (54, 55). However, measurement of total ghrelin has the advantages of measuring both forms of ghrelin. Total ghrelin is also less prone to degradation (important in our case because samples needed to be transported over 2000 km from collection site), and it is desirable when higher levels of ghrelin are predicted, as in our case. Another issue of concern is a possible degradation of total ghrelin because we did not use extraction of plasma with the addition of protease inhibitors and acidification. Therefore, we cannot exclude possible degradation of active ghrelin. However, this possible degradation would have likely occurred in both subjects with IGHD and control subjects, allowing comparison between groups. Furthermore, the observed postprandial ghrelin attenuation and GLP-1 increase seen in both the experimental and control groups suggest the biological relevance of our experiment. For GLP-1 assay, extraction and acidification do not appear to be critical, following the manufacturer’s instructions. Similar handling of the samples was used in a recent study, showing that GLP-1 appears to be the main candidate to promote an increased insulin response and metabolic control after gastric bypass surgery in obese patients (56).
In summary, severe, lifetime, untreated IGHD is associated with increased GLP-1 secretion and less postprandial ghrelin and hunger attenuation in response to a mixed meal. These enteroendocrine changes may result in a favorable outcome in terms of environmental adaptation, providing appropriate food intake (higher total ghrelin) and improving insulin sensitivity (higher GLP-1). These changes may contribute to the normal life expectancy of these subjects despite several cardiovascular risk factors.
Acknowledgments
The authors thank the Associação do Crescimento Físico e Humano de Itabaianinha for assistance and Dr. Clare Lee (Johns Hopkins University) for careful review of the manuscript. R.S. wishes to acknowledge the generous support of Newell Coxon, Jr.
Financial Support: This study was supported in part by Sao Paulo Research Foundation Grant 2014/03989-6 (to M.d.C.).
Disclosure Summary: R.S. serves on the advisory board of Novo Nordisk and Pfizer. The remaining authors have nothing to disclose.
Abbreviations:
- AUC
area under the curve
- BMI
body mass index
- GHD
GH deficiency
- GHRKO
GH receptor knockout
- HOMA
homeostasis model assessment index
- HOMA-IR
homeostasis model assessment index of insulin resistance
- IGHD
isolated GH deficiency
- VAS
visual analog scale
