


Abstract
Menopausal transition is associated with increased cardiovascular risks. Available data on the effect of earlier climacterium on these risks are limited.
To compare cardiovascular risk-associated parameters at the ages of 14, 31, and 46 in relation to climacteric status at the age of 46.
A prospective cohort study including 2685 women from the Northern Finland Birth Cohort 1966.
Follicle-stimulating hormone, body mass index (BMI), waist circumference, waist-to-hip ratio (WHR), blood pressure (BP), body composition, cholesterol levels, testosterone (T) levels, free androgen index (FAI), high-sensitivity C-reactive protein (hs-CRP), and liver enzymes.
Women who were climacteric at the age of 46 had lower BMIs (P = 0.029), T levels (P = 0.018), and FAIs (P = 0.009) at the age of 31. At the age of 46, they had less skeletal muscle (P < 0.001), a higher fat percentage (P = 0.016), higher cholesterol levels [total cholesterol (P < 0.001), low-density lipoprotein cholesterol (P < 0.001), high-density lipoprotein cholesterol (HDL-C; P = 0.022), and triglycerides (P = 0.008)], and higher alanine aminotransferase (P = 0.023) and γ-glutamyltransferase (P < 0.001) levels compared with preclimacteric women. Waist circumference, WHR, BP, and hs-CRP levels did not differ between the groups. Of the climacteric women, 111/381 were using hormone-replacement therapy (HRT). In subanalysis that excluded the HRT users, triglycerides, HDL-C, and body fat percentage did not differ among the groups.
Earlier climacterium is associated with mainly unfavorable metabolic changes.
In Western countries, the average age for natural menopause is 50 to 51 years (1, 2). It is reported that ∼5% to 10% of women face early menopause (EM), defined as the loss of ovarian function at the age of 40 to 44 (3–5). Approximately 1% of women undergoes menopause before the age of 40, termed premature ovarian insufficiency (POI) (1, 6, 7). According to European Society of Human Reproduction and Endocrinology Guidelines, the criteria of POI are oligo/amenorrhea for at least 4 months and follicle-stimulating hormone (FSH) level >25 IU/L repeatedly (6). Perimenopause/menopausal transition is defined as an interval before menopause, in which many women have irregular cycles (8). Menopause is reached when a woman has missed menses for 1 year (8). According to Stages of Reproductive Aging Workshop + 10 staging criteria, FSH levels and menstrual cycles are variable in the late reproductive stage and early perimenopausal stage, whereas FSH value > 25 IU/L and amenorrhea > 2 months are characteristic of being in late menopausal transition (9).
Genetic inheritance has a remarkable effect on the age of natural menopause: EM in a mother or sister multiplies the risk for EM (10–13). Diverse factors are associated with POI, including environmental toxins, genetic and chromosomal disorders, iatrogenic and autoimmune causes, and chromosomal disorders, although the precise etiology remains unknown for the majority of patients (1, 7, 14).
Several adverse changes in cardiovascular disease (CVD) risk factors during menopausal transition have been described in earlier studies: increased waist circumference (15), higher total cholesterol (TC) and low-density lipoprotein (LDL) (15–17), altered concentrations of inflammatory markers (15, 18), increased fat mass (15, 19), central fat accumulation (19, 20), and higher blood pressure (BP) (21). Some studies have suggested that the unfavorable changes in the cardiovascular risk profile of postmenopausal women are likely to be a result of their older age rather than the menopause itself (22, 23).
Many studies have suggested that both natural and surgical EM and POI increase the risk of cardiovascular morbidity (24–26). There is little research on the cardiovascular risk profile of women experiencing premature menopause, but some certain risk factors have been identified, such as an unfavorable lipid profile (27), elevated C-reactive protein (CRP) levels (28), increased waist circumference (28), and metabolic syndrome (29). It has been suggested that the reverse may be at play, namely, that an unfavorable cardiovascular risk profile may trigger earlier menopause (30).
In this population-based cohort study, the aims were to investigate the relationship between climacteric status at the age of 46 and cardiovascular risk-associated anthropometric, hormonal, and metabolic parameters. As cardiovascular risks can be diminished by lifestyle changes, it is important to identify at-risk patients for special counseling.
Materials and Methods
Study population
The study population consisted of the Northern Finland Birth Cohort 1966 (NFBC1966), which is based on 12,058 live births (6169 boys and 5889 girls) in the two northernmost provinces in Finland (Oulu and Lapland), covering 96.3% of all live births in the area in 1966. Cohort members have been prospectively followed since their antenatal period, with questionnaires, clinical examinations, and laboratory samples (31).
This study is based on clinical examinations, at the ages of 14, 31, and 46 years, on laboratory samples taken at the ages of 31 and 46 years and on a follow-up questionnaire at the age of 46. Some study members became lost to follow-up because of death or emigration; at the age of 46, contact information was available for 5118 women from the original cohort. We included in our study population women who had attended every necessary part of the 46-year follow-up survey. Most of these subjects had also taken part in the 14- and 31-year follow-up studies.
Postal questionnaires and clinical examinations
The members of NFBC1966 have been asked to complete several wide-ranging questionnaires and to attend several clinical examinations in the course of their lives. The questionnaires have included a multitude of questions concerning their health, lifestyle, and life situation. In this survey, we were interested in the female participants’ menstruation anamnesis, as asked in the 46-year follow-up questionnaire: “Do you still have menstrual periods?” (i) regularly, (ii) irregularly, (iii) not anymore, (iv) no, because of hormonal medication. The study subjects were also asked to report the date of their last menstrual period. Information on age of menarche, level of education, marital status, smoking, physical activity, pregnancies, deliveries, and current medications was also retrieved from the questionnaires.
We used the results of clinical examinations performed at the ages of 14, 31, and 46 years. Matters of interest were anthropometric measurements: weight, height, waist circumference, hip circumference, and bioimpedance measurements of body composition. Weight and height measurements of the participants were taken at all three examinations. Hip and waist circumference, as well as BP, were measured at the 31- and 46-year clinical examinations. The 46-year examination also included body-composition measurements. The data on current medications was verified by posing the question in person during the clinical examination.
Care Register for Health Care (National Institute for Health and Welfare)
In Finland, every diagnosis made in health care is archived in National Institute for Health and Welfare’s Care Register for Health Care, with a personal identifier using the International Statistical Classification of Diseases and Related Health Problems (ICD) coding system. As there are special ICD codes for POI, we were able to identify the study subjects diagnosed with menopause before the age of 40.
Laboratory analysis and anthropometric measurements
NFBC1966 blood samples were taken after an overnight fasting period. They were analyzed in NordLab Oulu (former name: Oulu University Hospital, Laboratory), a testing laboratory (T113) accredited by the Finnish Accreditation Service (EN ISO 15189).
Serum TC, LDL cholesterol (LDL-C), high density lipoprotein cholesterol (HDL-C), and triglycerides were determined for the NFBC1966 cohort by using an Hitachi 911 automatic analyzer with commercial reagents (Roche, Boehringer Mannheim, Germany) at 31 years and an enzymatic assay method (Advia 1800; Siemens Healthcare Diagnostics Inc., Tarrytown, NY) at 46 years.
Serum testosterone (T) concentration was analyzed using Agilent triple-quadrupole 6410 liquid chromatography/mass spectrometry equipment with an electrospray ionization source operating in positive-ion mode (Agilent Technologies, Inc., Wilmington, DE) at both ages. Sex hormone-binding globulin (SHBG) was assayed by fluoroimmunoassay (Wallac, Inc. Ltd., Turku, Finland) at 31 years and by chemiluminometric immunoassay (Immulite 2000; Siemens Healthcare, Llanberis, UK) at 46 years. As the SHBG analysis method changed, the SHBG values from age 31 were transformed to be comparable with the SHBG values analyzed at age 46 using a formula: 0.7615 × old method 31-year SHBG + 0.7088, and the results are reported according to this method. Free androgen index (FAI) was calculated by 100 × T (nM)/SHBG (nM).
High-sensitivity CRP (hs-CRP) in the NFBC1966 cohort was analyzed by an immunoenzymometric assay (Medix Biochemica, Espoo, Finland) at 31 years and by an immune nephelometric assay at 46 years (BN ProSpec, Siemens Healthcare Diagnostics Inc., Newark, DE).
Alanine aminotransferase (ALT), aspartate aminotransferase (AST), γ-glutamyltransferase (GGT), and FSH levels were analyzed at the age of 46. The activities of ALT, AST, and GGT were measured by photometric International Federation of Clinical Chemistry methods (Advia 1800) (32–34); FSH was determined using an immunochemiluminometric method (Advia Centaur; both Siemens Healthcare Diagnostics, Tarrytown, NY).
Body composition assessments were performed at the age of 46 by using an InBody 720 bioelectrical impedance analyzer (Biospace Co., Ltd., Seoul, Korea). An automated oscillometric BP device and an appropriately sized cuff (Digital Automatic Blood Pressure Monitor Model M10-IT; Omron, Kyoto, Japan) were used for BP measurements. BP results were the average values of three measurements for each individual.
The analyses were adjusted for age at menarche, parity, smoking, level of education, and physical activity. The possible effect of hormone-replacement therapy (HRT) on outcomes was taken into account by including and excluding HRT users in respective subanalyses. The study design was approved by the Ethical Committee of the Northern Ostrobothnia Hospital District. Written consent for scientific purposes was received from all study subjects.
Statistical analyses
Pearson’s χ2 test was used to calculate P values for the categorical variables. The differences in distribution of clinical characteristics were tested using a nonparametric Mann-Whitney U test or Kruskal-Wallis test. The analysis of covariance was used to compare the laboratory analysis and the anthropometric measurements, and the analysis was adjusted for age at menarche, number of pregnancies, smoking status, education, and physical activity.
Binary logistic regression models were used to estimate the factors associated with metabolic syndrome, and the results were reported as crude and adjusted odds ratios (ORs) with 95% CIs. Adjustments were made as with the analysis of covariance model. The results are reported as ORs with 95% CIs. A P value of <0.05 was considered significant. Statistical analyses were performed using SAS 9.4 TS for Windows (SAS Institute, Inc., Gary, NC) and R (version 3.5.0; The R Project for Statistical Computing, http://www.r-project.org).
Study groups
Study subjects were divided into two groups by their climacteric status at the age of 46, defined by menstrual anamnesis and FSH values: cases were climacteric (peri-/postmenopausal) women, and controls were preclimacteric (premenopausal) women. Combined contraceptive pill or ring users were excluded, as this has a possible effect on both the menstrual cycle and the FSH value. Women who reported having progestin-only treatments or a progestin-intrauterine device were classified according to their FSH values, as these treatments typically affect menstrual bleeding. Systemic HRT users were included and classified as climacteric. Tamoxifen users were excluded. For sensitivity analyses, HRT users were included and excluded in the respective subanalyses. The data on present medications were derived from self-reporting in the 46-year questionnaire and verified by posing the question in person during the clinical examination.
As there are no general criteria for perimenopause and climacterium, we set the criteria, applying European Society of Human Reproduction and Endocrinology Guidelines for POI and Stages of Reproductive Aging Workshop +10 criteria for menopausal transition. The criteria of climacteric women were as follows: (i) FSH value ≥ 25 IU/L; (ii) amenorrhea ≥ 4 months (if the duration known) or hysterectomized or having progestin-only treatment or a progestin-intrauterine device. The study subjects having irregular or no more menstrual cycles and who could not report the date of their last menstrual period were classified climacteric if their FSH value was ≥25. Study subjects who reported using systemic HRT were included into the case group.
The criteria of preclimacteric women were as follows: FSH value < 25 IU/L and regular/irregular menstrual cycles or hysterectomized or having a progestin-only treatment or a progestin-intrauterine device.
Women with discrepancy between FSH value and menstrual anamnesis were excluded. For sensitivity analyses, HRT users were included and excluded in the respective subanalyses.
Results
A flow chart of the study population is shown in Fig. 1. At the age of 46, there were 5118 female participants with contact information available in the cohort, of whom 3119 (60.9%) answered the questionnaire and attended the clinical examination. The serum FSH value was available for 2685 (52.5%) of these women. There were 381 females who fulfilled the criteria of being climacteric, including 111 HRT users. The control group included 2304 women.
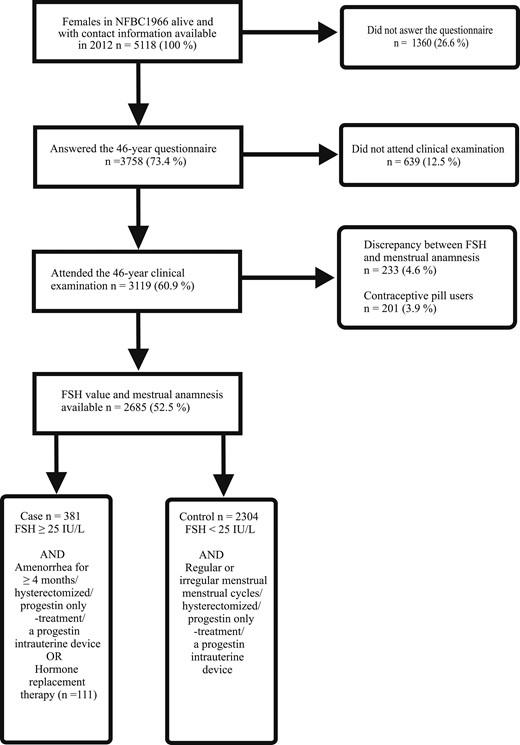
Flow chart of the study population consisting of female participants of the NFBC1966 who took part in all necessary parts of the 46-year follow-up study. Clinical examination included laboratory sampling for FSH value determination.
Unfortunately, many study subjects did not report the date of their last menstrual period in the questionnaire. We considered the bleeding anamnesis to be unreliable in study subjects having HRT, progestin-only treatment, or a progestin-intrauterine hormone device or who were hysterectomized, and their menstrual anamneses were not taken into consideration. There were 74 climacteric study subjects for whom the information on the length of their amenorrhea was available. Of them, 53 reported the time since their last period to be, at the most, 2 years; for 15, it was 2 to 6 years; for four, it was 6 to 8 years; and for two, it was at least 10 years (11 and 16 years, respectively). In the Care Register for Health Care, eight of our study subjects had a POI diagnosis (ICD 10th Revision codes: E28.3, E29.1, E89.4, E89.8, E89.5, E89.5, E29, or Q96). As data on the length of amenorrhea were available for only a minority of the study subjects, subanalysis into subgroups, divided by the duration of amenorrhea, was not performed.
The baseline characteristics of the study population are shown in Table 1. Climacteric subjects had a significantly lower number of pregnancies (2.6 vs 3.0, P = 0.001) and deliveries (1.9 vs 2.2, P = 0.001), and they were significantly more often current smokers (25.7% vs 18.9%, P = 0.003). The groups did not differ significantly in age at menarche (12.8 years vs 12.9 years, P = 0.064), education level (P = 0.077), marital status (P = 0.460), or physical activity (P = 0.093).
Baseline Characteristics of the Study Population
| Baseline Characteristic | Total | Climacteric Women | Preclimacteric Women | P Value |
|---|---|---|---|---|
| Age at menarche (mean, SD) | 12.9 (1.3) | 12.8 (1.2) | 12.9 (1.3) | 0.064 |
| Number of pregnancies (mean, SD) | 2.9 (2.3) | 2.6 (2.1) | 3.0 (2.3) | 0.001 |
| Number of pregnancies (n, %) | <0.001 | |||
| 0 | 298 (11.1) | 67 (17.7) | 231 (10.0) | |
| 1–2 | 993 (37.0) | 129 (34.1) | 864 (37.4) | |
| ≥3 | 1396 (52.0) | 182 (48.1) | 1214 (52.6) | |
| Deliveries (mean, SD) | 2.2 (1.8) | 1.9 (1.6) | 2.2 (1.8) | 0.001 |
| Deliveries (n, %) | <0.001 | |||
| 0 | 408 (15.2) | 84 (22.2) | 324 (14.0) | |
| 1–2 | 1376 (51.2) | 184 (48.7) | 1192 (51.6) | |
| ≥3 | 903 (33.6) | 110 (29.1) | 793 (34.3) | |
| Smoking (n, %) | 0.011 | |||
| Nonsmoker | 1521 (56.9) | 190 (50.8) | 1331 (57.9) | |
| Former smoker <6 mo | 570 (21.3) | 82 (21.9) | 488 (21.2) | |
| Former smoker >6 mo | 47 (1.8) | 5 (1.3) | 42 (1.8) | |
| Current smoker | 533 (20.0) | 97 (25.9) | 436 (19.0) | |
| Currently smoking (n, %) | 0.003 | |||
| No | 2154 (80.2) | 281 (74.3) | 1873 (81.1) | |
| Yes | 533 (19.8) | 97 (25.7) | 436 (18.9) | |
| Education (n, %) | 0.077 | |||
| Basic | 57 (2.1) | 8 (2.1) | 49 (2.1) | |
| Secondary | 1507 (56.1) | 232 (61.4) | 1275 (55.2) | |
| Tertiary | 1123 (41.8) | 138 (36.5) | 985 (42.7) | |
| Marital status (n, %) | 0.460 | |||
| Unmarried | 267 (10.0) | 39 (10.3) | 228 (9.9) | |
| Married/domestic partnership | 2095 (78.1) | 302 (79.9) | 1793 (77.9) | |
| Divorced | 303 (11.3) | 34 (9.0) | 269 (11.7) | |
| Widow | 16 (0.6) | 3 (0.8) | 13 (0.6) | |
| Physical activity (n, %) | 0.093 | |||
| Low | 540 (20.2) | 74 (19.7) | 466 (20.3) | |
| Moderate | 1094 (40.9) | 171 (45.6) | 923 (40.2) | |
| Active | 998 (37.3) | 128 (34.1) | 870 (37.9) | |
| Very active | 41 (1.5) | 2 (0.5) | 39 (1.7) |
Baseline characteristics of the study population: climacteric women (cases) and preclimacteric women (controls) in the NFBC1966.
Anthropometric measurements
The results of the anthropometric measurements are shown in Table 2. As weight and height had been measured in each of the three clinical examinations, we were able to compare body mass index (BMI) between the study groups at the ages of 14, 31, and 46. At the age of 31, BMI values of women in the case group were significantly lower (mean: 23.4 kg/m2) compared with control subjects (mean: 23.8 kg/m2; P = 0.029). BMI values did not differ between cases and controls at the age of 14 (mean 19.4 kg/m2 ± 2.4 (n = 351) vs 19.4 kg/m2 ± 2.5 (n = 2088; P = 0.509) or at the age of 46.
Results of Anthropometric Measurements in Climacteric Women (Cases) and Preclimacteric Women (Controls) at the Ages of 31 and 46
| 31 Years | 46 Years | ||||||
|---|---|---|---|---|---|---|---|
| Variable | Means ± SD (n =) | Pa | Pb | Means ± SD (n =) | Pa | Pb | |
| BMI, kg/m2 | Cases | 23.4 ± 3.9 (354) | 0.077 | 0.029 | 26.4 ± 5.2 (381) | 0.958 | 0.406 |
| Controls | 23.8 ± 4.3 (2073) | 26.5 ± 5.3 (2277) | |||||
| Waist circumference, cm | Cases | 77.8 ± 11.0 (267) | 0.254 | 0.155 | 87.0 ± 13.3 (363) | 0.672 | 0.496 |
| Controls | 78.8 ± 11.8 (1492) | 87.2 ± 13.0 (2262) | |||||
| WHR | Cases | 0.8 ± 0.1 (267) | 0.665 | 0.719 | 0.9 ± 0.1 (363) | 0.571 | 0.448 |
| Controls | 0.8 ± 0.1 (1492) | 0.9 ± 0.1(2261) | |||||
| Systolic BP, mmHg | Cases | 118.8 ± 11.5 (279) | 0.293 | 0.109 | 120.6 ± 16.7 (363) | 0.446 | 0.522 |
| Controls | 119.6 ± 12.0 (1576) | 120.9 ± 15.4 (2270) | |||||
| Diastolic BP, mmHg | Cases | 73.8 ± 10.1 (279) | 0.712 | 0.618 | 83.3 ± 11.4 (363) | 0.386 | 0.712 |
| Controls | 74.3 ± 10.8 (1576) | 82.6 ± 10.7 (2270) | |||||
| Body fat percentage, % | Cases | 34.1 ± 8.3 (362) | 0.007 | 0.016 | |||
| Controls | 32.9 ± 8.4 (2239) | ||||||
| Skeletal muscle mass, kg | Cases | 25.2 ± 3.2 (362) | <0.001 | <0.001 | |||
| Controls | 26.0 ± 3.4 (2239) | ||||||
| Visceral fat volume, m3 | Cases | 111.3 ± 42.6 (362) | 0.090 | 0.377 | |||
| Controls | 108.4 ± 43.1 (2239) | ||||||
The analyses were adjusted for age at menarche, parity, smoking, level of education, and physical activity. The study subjects were participants in the NFBC1966. Climacteric status was determined at the age of 46 by menstrual anamnesis and FSH value.
Abbreviations: BMI, body mass index; WHR, waist-to-hip ratio.
P, crude P value.
P, adjusted P value.
Participants’ body composition had been determined in the 46-year clinical examination. Climacteric women had significantly less skeletal muscle mass (mean 25.2 kg vs 26.0 kg, P < 0.001) and a higher body fat percentage (mean 34.1% vs 32.9%, P = 0.016) compared with controls. No difference in visceral fat volume was noticed. Case subjects and control subjects had no difference in waist circumference, either at the age of 31 or at the age of 46. Waist-to-hip ratios (WHRs) were also similar between the groups, as well as average BP values.
The subanalyses performed without HRT users revealed that the difference in body fat percentage became insignificant, even though means did not change (34.1% vs 32.9%, P = 0.155). The results of the other anthropometric measurements did not change.
Metabolic outcomes
Metabolic outcomes for the study population are shown in Table 3. At the age of 46, climacteric women had significantly higher levels of TC, LDL-C, HDL-C, and triglycerides. These parameters did not differ at the age of 31.
Metabolic Outcomes in Climacteric Women (Cases) and Preclimacteric Women (Controls) at the Ages of 31 and 46
| 31 Years | 46 Years | ||||||
|---|---|---|---|---|---|---|---|
| Variable | Means ± SD (n =) | Pa | Pb | Means ± SD (n =) | Pa | Pb | |
| TC, mM | Cases | 5.0 ± 1.0 (278) | 0.426 | 0.103 | 5.4 ± 0.9 (364) | <0.001 | <0.001 |
| Controls | 4.9 ± 0.9 (1580) | 5.1 ± 0.8 (2275) | |||||
| LDL-C, mM | Cases | 2.8 ± 0.9 (278) | 0.199 | 0.096 | 3.4 ± 0.9 (364) | 0.001 | <0.001 |
| Controls | 2.8 ± 0.8 (1576) | 3.2 ± 0.8 (2275) | |||||
| HDL-C, mM | Cases | 1.7 ± 0.4 (278) | 0.602 | 0.989 | 1.7 ± 0.4 (364) | 0.003 | 0.022 |
| Controls | 1.7 ± 0.4 (1580) | 1.6 ± 0.4 (2275) | |||||
| Triglycerides, mM | Cases | 1.0 ± 0.6 (278) | 0.876 | 0.746 | 1.2 ± 0.7 (364) | 0.028 | 0.008 |
| Controls | 1.0 ± 0.6 (1580) | 1.0 ± 0.5 (2275) | |||||
| T, nM | Cases | 1.9 ± 0.7 (148) | 0.040 | 0.018 | 1.4 ± 0.4 (361) | <0.001 | 0.001 |
| Controls | 2.1 ± 0.9 (873) | 1.4 ± 0.4 (2271) | |||||
| FAI | Cases | 3.4 ± 2.2 (148) | 0.164 | 0.009 | 1.7 ± 0.9 (362) | 0.348 | 0.215 |
| Controls | 3.9 ± 3.1 (870) | 1.8 ± 2.0 (2273) | |||||
| hs-CRP, mg/L | Cases | 2.2 ± 4.6 (269) | 0.006 | 0.056 | 1.5 ± 1.8 (362) | 0.016 | 0.078 |
| Controls | 2.3 ± 4.0 (1542) | 1.6 ± 3.2 (2268) | |||||
| ALT, IU/L | Cases | 27.0 ± 21.2 (364) | <0.001 | 0.023 | |||
| Controls | 23.8 ± 18.4 (2275) | ||||||
| AST, IU/L | Cases | 23.3 ± 16.7 (362) | <0.001 | 0.243 | |||
| Controls | 21.0 ± 27.9 (2274) | ||||||
| GGT, IU/L | Cases | 31.5 ± 42.6 (363) | <0.001 | <0.001 | |||
| Controls | 25.1 ± 29.6 (2274) | ||||||
The analyses were adjusted for age at menarche, parity, smoking, level of education, and physical activity. The study subjects were participants in the NFBC1966. Climacteric status was determined at the age of 46 by menstrual anamnesis and FSH value.
P, crude P value.
P, adjusted P value.
Case subjects had lower levels of T and a lower FAI at the age of 31. At the age of 46, the distribution of T levels was still significantly different, whereas FAI did not differ between the groups.
Levels of hs-CRP did not differ between the groups at the age of 31 or at the age of 46. However, at the age of 46, there were statistically significant differences in some liver function tests, with climacteric women having higher levels of ALT and GGT. Levels of AST were slightly higher in the case group, but the difference was not statistically significant.
In subanalyses without HRT users, the difference in HDL-C levels between cases and controls at the age of 46 became insignificant, even though the means did not change (mean 1.7 vs 1.6 mM, P = 0.0579). Triglyceride levels were lower in the case group without HRT users (mean 1.1 mM), and the difference between the groups became insignificant (P = 0.091).
Discussion
In this population-based cohort study, earlier climacterium was associated with some mild unfavorable changes in metabolic features. Being climacteric at the age of 46 was associated with disadvantageous body composition (higher percentage of body fat, lower skeletal muscle mass), a less favorable lipid profile, and elevated liver enzymes compared with preclimacteric controls. T levels and FAI were lower at the age of 31 among subjects who were climacteric at the age of 46.
Earlier studies have described several changes in lipids among women with POI, as early as in their 30s, similar to the present findings in climacteric women at the age of 46: higher TC (29, 35), HDL-C (29), LDL-C (35), and triglycerides (27). There is little research on the lipid profile of women with POI in their 50s, but Daan et al. (28) found no difference in TC, LDL-C, or triglyceride levels between women with POI and age-matched premenopausal controls, whereas they found HDL-C levels were higher in women with POI. Several studies have compared the lipid profile in midlife, in general, between postmenopausal women and age-matched premenopausal controls, finding that women are prone to higher cholesterol levels after menopause (16, 17, 36). Razmjou et al. (15) followed middle-aged women over a 10-year period, including menopausal transition, and observed an increase in the levels of TC, LDL-C, and HDL-C.
In our study, women who reach climacterium by the age of 46 had lower T levels and FAI at the age of 31. Unfortunately, FSH levels were not measured at the 31-year follow-up examination, so we cannot reliably say how many of the participants were climacteric already at that time. As only eight women in our study population were diagnosed with POI, we assume that most of the case subjects reached climacterium after the age of 31. Hence, we suggest that lower androgen levels may precede earlier climacterium. Some earlier studies have investigated androgen levels in postmenopausal women with POI in their 30s compared with age-matched premenopausal women: no difference was found in the studies by Ates et al. (29) or by Gulhan et al. (35), whereas Daan et al. (37) showed POI women to have lower T and FAI. It is suggested that women with POI had lower levels of T, androstenedione, and dehydroepiandrosterone sulfate in their 50s (28). The evidence on the impact of natural menopausal transition, in general, on androgen levels is controversial; both declining and stable levels have been described (38–40). Higher T levels in postmenopausal women are associated with better performance on several cognitive function tests (41, 42) and decreased carotid intimal-media thickness (43, 44).
The current study found that climacteric women had less skeletal muscle and a higher percentage of body fat at the age of 46. Earlier studies have associated the menopausal transition with a decrease in fat-free mass and an increase in fat mass (15, 19). There is little research on the effect of climacterium on muscle mass particularly, but in a follow-up study by Sowers et al. (45) that included 543 middle-aged women, rising FSH levels were associated with a decrease in skeletal muscle mass. Postmenopausal women have also been suggested to have increased central fat (19, 20, 46), whereas the difference in the amount of visceral fat was not significant in our population. Few studies have investigated the effect of premature menopausal transition on body composition, but a study by Corrigan et al. (47) found no difference in the amount of body fat or central body fat in either karyotypically normal women with POI or women with POI and Turner syndrome in their 30s compared with premenopausal women at the same age. Several studies have shown an association between decreased muscle mass (sarcopenia) and an increased risk of physical disability in the elderly (48–50). According to a recent meta-analysis by Vlietstra et al. (51), exercise may benefit older adults with decreased muscle mass. In a study by Akune et al. (52), physical activity in middle age was associated with a lower prevalence of sarcopenia at ≥65 years.
In our study population, hs-CRP levels did not differ between the study groups. Razmjou et al. (15) found no change in hs-CRP levels during menopausal transition, whereas several other inflammatory markers either increased (haptoglobin, ferritin, soluble CD14, adiponectin) or decreased (soluble TNF receptor 1 and 2, IL-8). Women with POI have been described having higher CRP levels in their 50s compared with premenopausal women of the same age (28). Higher hs-CRP levels are associated with an increased risk of CVD in both women and men (53).
In our study population, women who were climacteric at the age of 46 had lower BMIs at the age of 31, but BMIs did not differ between the groups at the ages of 14 or 46. Corrigan et al. (47) reported lower BMI values in women with POI in their 30s compared with premenopausal controls. Evidence suggests that lower BMI is associated with lower age and higher BMI with higher age at menopause (54). In a recent study by Zhu et al. (55), underweight women were reported to have a more than twofold risk for EM.
Almost one-third of the climacteric women in this study were HRT users. In the subanalysis that excluded HRT users, the difference in body fat percentage and HDL-C became insignificant, even though the means of those parameters did not change, which is most likely a result of the smaller number of study subjects included in the analyses. Hence, our study population was not large enough to estimate the effect of HRT on the metabolic effects of climacterium. Triglyceride levels were slightly lower in the climacteric women when HRT users were excluded, and the difference between the groups was insignificant. The varying effect of HRT on triglyceride levels, depending on the dosage form, is described in earlier studies: there is evidence that transdermal estrogen therapy decreases triglyceride levels, whereas the effect of oral estrogen treatment is neutral or even increases the levels (56–58). It is suggested that in postmenopausal women, HRT has a favorable effect on cholesterol levels (56), as well as on body composition (59, 60).
There is much evidence that the risk of CVD can be modified by lifestyle interventions. In a recent meta-analysis by Colpani et al. (61), physical activity, not smoking, the avoidance of being overweight, and moderate alcohol consumption diminished the risk of CVD in women who were middle-aged or older. As studies have suggested that HRT has beneficial effects on many CVD risk factors, HRT is recommended preventatively for women with POI and EM, although longitudinal studies on outcomes are lacking (4, 6, 62). As HRT also carries some potential risks, it is not recommended for CVD prevention in women who experience menopause at the usual age (63).
Our study has several strengths. As the subjects were members of a large birth cohort, we were able to use data collected at different points of life. The attendance rate for the 46-year follow-up survey was good (60.9%), and most of these women had also taken part in the 14- and 31-year follow-up studies. As data collection for the NFBC1966 has been very comprehensive, much useful information was available for varied analyses. Many anthropometric and metabolic variables, which are known to be related to the risk of CVDs, were measured, often at several ages. Standard methods were used when analyzing laboratory samples and taking anthropometric measurements, ensuring the reliability of these data. We were also able to adjust the analyses for several important confounding factors: age at menarche, parity, smoking, level of education, and physical activity. Subanalyses of the study population without HRT users were performed, although the effect of estrogen treatment on metabolic outcomes in climacteric women was not the key issue of the study.
The study also has some limitations. The data on the time of the last menstrual period were available for only a minority of the case subjects, so many participants’ climacteric status were based on FSH value and on whether they reported to still be menstruating or not. As only eight women in the study population had been diagnosed with POI, and only a few reported that the time since their last menstrual period had been 6 or more years, we assume that most of the case subjects reached climacterium between the ages of 40 and 46. Cohort members with a contradiction between menstrual anamnesis and FSH value were not included into the study population. Many sections of the data collection were based on self-reporting, which might limit reliability. However, the data for current medication were verified by personal interview.
Only a few studies have investigated CVD risks in women undergoing climacteric phase earlier than the average. This population-based study gives novel information about the metabolic changes associated with earlier climacterium. The aim of the current study was not to investigate how HRT would affect risk factors for CVD in climacteric women, as the number of cases was too small. However, based on this study, it is suggested that medical professionals should be aware of the impairing effect of climacteric transition on metabolic features and that women who reach climacterium earlier may be more at risk for adverse long-term health consequences.
Abbreviations:
- ALT
alanine aminotransferase
- AST
aspartate aminotransferase
- BMI
body mass index
- BP
blood pressure
- CRP
C-reactive protein
- CVD
cardiovascular disease
- EM
early menopause
- FAI
free androgen index
- FSH
follicle-stimulating hormone
- GGT
γ-glutamyltransferase
- HDL-C
high-density lipoprotein cholesterol
- HRT
hormone-replacement therapy
- hs-CRP
high-sensitivity C-reactive protein
- ICD
International Statistical Classification of Diseases and Related Health Problems
- LDL-C
low-density lipoprotein cholesterol
- NFBC1966
Northern Finland Birth Cohort 1966
- POI
premature ovarian insufficiency
- SHBG
sex hormone-binding globulin
- T
testosterone
- TC
total cholesterol
- WHR
waist-to-hip ratio
Acknowledgments
We warmly thank the NFBC1966 participants and the NFBC Project Center, especially Paula Pesonen.
Financial Support: This work was supported by the University Hospital of Oulu (Finland), University of Oulu Scholarship Foundation (Finland), and the Finnish Menopause Society.
Disclosure Summary: The authors have nothing to disclose.
References
Author notes
S.S. and H.M. contributed equally to this study.
