


Abstract
Whether patients with Cushing disease (CD) in remission have increased mortality is still debatable.
To study overall and disease-specific mortality and predictive factors in an unselected nationwide cohort of patients with CD.
A retrospective study of patients diagnosed with CD, identified in the Swedish National Patient Registry between 1987 and 2013. Medical records were systematically reviewed to verify the diagnosis. Standardized mortality ratios (SMRs) with 95% CIs were calculated and Cox regression models were used to identify predictors of mortality.
Of 502 identified patients with CD (n = 387 women; 77%), 419 (83%) were confirmed to be in remission. Mean age at diagnosis was 43 (SD, 16) years and median follow-up was 13 (interquartile range, 6 to 23) years. The observed number of deaths was 133 vs 54 expected, resulting in an overall SMR of 2.5 (95% CI, 2.1 to 2.9). The commonest cause of death was cardiovascular diseases (SMR, 3.3; 95% CI, 2.6 to 4.3). Excess mortality was also found associated with infections and suicide. For patients in remission, the SMR was 1.9 (95% CI, 1.5 to 2.3); bilateral adrenalectomy and glucocorticoid replacement therapy were independently associated with increased mortality, whereas GH replacement was associated with improved outcome.
Findings from this large nationwide study indicate that patients with CD have excess mortality. The findings illustrate the importance of achieving remission and continued active surveillance, along with adequate hormone replacement and evaluation of cardiovascular risk and mental health.
Before the modern treatment era, 50% of patients with untreated Cushing syndrome (CS) died within 5 years after diagnosis (1). Since then, various effective treatments have been introduced, including minimally invasive pituitary surgery, radiotherapy, adrenalectomy, and cortisol-lowering medical treatment (2). Despite this, mortality among patients treated for CS, including the most common form, Cushing disease (CD), is still increased, particularly for patients not in remission (3–10).
Remission is associated with improved prognosis. However, the standardized mortality ratio (SMR) in eight studies, including a total of 766 patients in long-term remission, varies greatly, from 0.3 (95% CI, 0.01 to 1.7) to 10.0 (95% CI, 5.3 to 17.1) (3–10). CD is a rare disease with an estimated annual incidence between 1.2 and 1.8 cases per million (3, 4, 6, 11). Because of its rarity, most previous studies on mortality were limited by small numbers of patients (3–8, 12–14). Furthermore, there have been few studies of predictors of mortality in CD, other than remission status.
The primary aim of this study was to investigate overall and disease-specific mortality in a large, nationwide, unselected cohort of patients with CD, and to identify factors that influence long-term outcome.
Methods
Study design
This was a nationwide, retrospective, observational study of patients with CD, based on data obtained from the Swedish National Patient Register (hereafter, Patient Register) and the Swedish National Cause of Death Register (hereafter, Cause of Death Register), both of which are maintained by the National Board of Health and Welfare. In 1987, the Patient Register achieved national coverage and contains information from every patient visit within the Swedish hospital system. By using a unique personal identification number, patients in the register can be cross-linked with other Swedish registers, such as the Cause of Death Register. The Patient Register and the Cause of Death Register have excellent coverage (15, 16).
Identification of patients with CD
The Patient Register was used to identify patients with CD. Eligible for evaluation were patients who had received the International Classification of Diseases, Ninth Revision diagnostic code for CS (255A) between 1987 and 1996 and those who had received the diagnostic code for CD (E24.0) or CS (E24.9) together with the code for benign pituitary adenoma (D35.2) between 1997 and 2013, according to the International Classification of Diseases, Tenth Revision.
Validation of the CD diagnosis
Records of patients identified in the Patient Register were systematically reviewed at all eight university hospitals in Sweden where the patients had received their diagnosis and/or treatment. According to a standardized protocol, the investigators evaluated whether the diagnosis of CD was correct by collecting information on clinical features, biochemical analyses, diagnostic imaging, results from inferior petrosal sinus sampling, and histopathological diagnosis. In addition, information was collected about the date of diagnosis and treatment (i.e., pituitary surgery, pituitary radiotherapy, bilateral adrenalectomy, and medical therapy) as well as the presence of hypopituitarism, hypertension, and diabetes mellitus at the most recent clinical visit.
Of 1317 patients identified in the Patient Register, 534 (41%) had the diagnosis of CD confirmed. The most common diagnoses among patients without CD were suspected CS that was ruled out after clinical and biochemical evaluation (n = 86), cortisol-producing adrenal adenoma (n = 86), ectopic ACTH-producing tumors (n = 52), nonfunctioning adrenal adenoma (n = 44), pituitary tumors other than ACTH-producing tumors (n = 42), and iatrogenic CS (n = 32).
Evaluation of remission status
Evaluation of remission status was based on review of medical records from clinical visits and included collection of information on resolution of clinical features of CS, concentration of urinary free cortisol, concentration of salivary or serum cortisol at midnight, cortisol suppression after dexamethasone suppression test, adrenal insufficiency, and/or bilateral adrenalectomy. Thereafter, the patients were assigned to one of three groups: (1) in remission, (2) not in remission, and (3) remission status unclear.
Collection of mortality data
When the validation of the diagnosis was completed, a list of patients with confirmed CD was sent back to the National Board of Health and Welfare and cross-linked with the Cause of Death Register. Information on the date and cause of death was obtained for patients who had died during the study period (1987 through 2014). For each patient, start of follow-up was defined as either the time when CD was diagnosed or the start of the study (1 January 1987). All patients were followed until 31 December 2014 or until death. At the time of the mortality analysis, the CD diagnosis had not been confirmed for 32 patients, including nine patients (28%) who had died during the study period. Thus, in this analysis, we included 502 patients with available mortality data.
Ethical consideration
The study was approved by the Regional Ethical Review Board in Gothenburg, Sweden (reference no. 145/11; approved 25 April 2013), and by the National Board of Health and Welfare, Stockholm, Sweden.
Statistical Analysis
Descriptive data are presented as mean (SD) or median [interquartile range (IQR)]. For comparison between two groups, an unpaired t test was used for normally distributed data and the Mann-Whitney U test for nonnormally distributed data. For proportions, the Pearson χ2 or Fisher exact test was used.
Person-years at risk were calculated from study inclusion (time of diagnosis or 1 January 1987) to death or end of study, and stratified according to sex, 5-year age groups, and 1-year calendar periods. The expected number of deaths for each stratum was calculated by using the general Swedish population for every calendar year and 5-year age group as the referents. The observed number of deaths among patients with CD was compared with the expected number from the general population and is presented as SMR with 95% CIs. CIs were calculated assuming a Poisson distribution of the observed numbers. Subgroup analyses according to sex and remission status were performed. SMRs for nonoverlapping subgroups were compared with each other (17).
The influence of sex, age at the start of the study, time from diagnosis to curative treatment, and time in remission (i.e., time from remission to end of study) on mortality was analyzed with a Cox regression model with backward elimination (model 1). The variables that were not normally distributed (i.e., time from diagnosis to remission and time in remission) were log transformed before they were used in the regression analyses. In model 2, the influence of treatment of CD (i.e., pituitary surgery, radiotherapy, and bilateral adrenalectomy) on mortality in patients in remission was analyzed after adjustment for the variables that were associated with mortality in model 1 (i.e., age at the start of the study and time in remission). In model 3, the influence of hormone replacement therapy (with glucocorticoids, thyroxine, and GH) on mortality was studied with the same adjustments as in model 2. Finally, in model 4, the association between mortality and treatment of diabetes mellitus and hypertension at the last clinical visit was studied, again adjusted for age at the start of the study and time in remission. The proportional hazards assumption was fulfilled for all models. The results from the Cox regression analyses are presented as hazard ratios (HRs) with 95% CIs.
The level of significance was set to P < 0.050. The statistical analyses were performed with SPSS, version 25 (IBM, Armonk, NY) and STATA SE, version 14 (StataCorp, College Station, TX) software.
Results
Baseline demographics
In total, 502 patients [n = 387 women (77%); n = 115 men (23%)] with confirmed CD identified between 1987 and 2013 were included in the analysis (Table 1). The mean age at diagnosis was 43 (SD 16) years. The median follow-up time was 13 (IQR, 6 to 23) years, resulting in 7165 patient-years of follow-up.
Characteristics of 502 Patients With CD in the Swedish National Patient Register (1987–2013)
| Total (N = 502) | In Remission (n = 419) | Not in Remission (n = 40) | P Value (in Remission vs Not in Remission) | Remission Status Unknown (n = 43) | P Value (in Remission vs Remission Status Unknown) | P Value (Not in Remission vs Remission Status Unknown) | |
|---|---|---|---|---|---|---|---|
| Sex | 0.99 | 0.42 | 0.66 | ||||
| Male | 115 (23) | 94 (22) | 9 (22) | 12 (28) | |||
| Female | 387 (77) | 325 (78) | 31 (78) | 31 (72) | |||
| Age at diagnosis, y | 43 (16) | 41 (15) | 56 (17) | <0.0001 | 46 (16) | 0.041 | 0.0071 |
| Age at start in study, y | 46 (16) | 44 (16) | 57 (17) | <0.0001 | 50 (16) | 0.030 | 0.052 |
| Median follow-up time, y | 13 (6–23) | 15 (7–24) | 4 (2–10) | <0.0001 | 11 (4–25) | 0.30 | 0.0022 |
| Patient-years at risk in the study | 7165 | 6296 | 279 | — | 589 | — | — |
| Treatment | |||||||
| Pituitary surgery | 364 (73) | 315 (75) | 27 (66) | 0.074 | 22 | a | a |
| Radiotherapy | 130 (26) | 116 (28) | 11 (27) | 0.29 | 3 | a | a |
| Bilateral adrenalectomy | 102 (20) | 102 (25) | — | — | — | — | — |
| Medical treatment | 31 (6) | 2 (0.5) | 28 (70) | <0.0001 | 1 | a | a |
| Only one pituitary surgery | 240 (48) | 209 (50) | 13 (33) | <0.0001 | 18 | a | a |
| Owing to Nelson syndrome | 32 (6) | 32 (7) | — | — | — | — | — |
| Hormone replacementb | |||||||
| Glucocorticoids | 234 (54) | 232 (59) | 1 (3) | <0.0001 | 1a | a | a |
| Thyroid hormone | 157 (36) | 151 (38) | 5 (14) | 0.0048 | 1a | a | a |
| Estrogen (women) | 31 (9) | 30 (10) | 1 (4) | 0.72 | —a | a | a |
| Testosterone (men) | 45 (45) | 44 (49) | — | — | 1a | a | a |
| GH | 97 (22) | 95 (24) | 2 (6) | 0.013 | —a | a | a |
| Desmopressin | 30 (7) | 28 (7) | 2 (6) | 0.79 | —a | a | a |
| Treatment of hypertensionc | 178 (41) | 150 (38) | 26 (72) | <0.0001 | 2a | a | a |
| Treatment of diabetes mellitusc | 67 (15) | 55 (14) | 12 (35) | 0.0087 | —a | a | a |
Data are reported as mean (SD), no. (%), or median (IQR).
Abbreviation: —, no data.
Information on treatment, hormone replacement, hypertension, and diabetes was missing in >80% of patients with unknown remission status, which is why percentages and/or P values were not calculated.
Information on hormone replacement was available for 433 patients (86%).
Information on treatment of hypertension and diabetes mellitus at the last follow-up was available for 439 (87%) and 436 (87%) patients, respectively.
Overall mortality
The observed number of deaths was 133 vs 54 expected, resulting in an overall SMR of 2.5 (95% CI, 2.1 to 2.9; Table 2). Men and women had an elevated SMR, with no statistically significant difference between the sexes.
SMR and Causes of Death for 133 of 502 Patients With CD Who Died During the Study Period (1987–2014)
| Observed No. of Deaths | Expected No. of Deaths | SMR (95% CI)a | |
|---|---|---|---|
| Total in the cohort (N = 502) | 133 | 54 | 2.5 (2.1–2.9) |
| Women (n = 387) | 97 | 42 | 2.3 (1.9–2.8) |
| Men (n = 115) | 36 | 11 | 3.2 (2.2–4.4) |
| Certain infectious and parasitic diseases, chapter 1 | 4 | 0.8 | 5.1 (1.4–13) |
| Infection NOS | 3 | ||
| Sepsis | 1 | ||
| Neoplasms, chapter 2 | 21b | 18.5 | 1.0 (0.6–1.5) |
| Pituitary carcinoma | 4 | ||
| Pituitary adenoma | 1 | ||
| Pituitary tumor NOS | 1 | ||
| Other | 15 | ||
| Endocrine, nutritional, and metabolic diseases, chapter 4 | 11 | 1.3 | 8.2 (4.1–15) |
| CS | 5 | ||
| Nelson syndrome | 1 | ||
| Electrolyte disturbance NOS | 1 | ||
| Adrenal gland disorder NOS | 1 | ||
| Diabetes mellitus | 1 | ||
| Hyperlipidemia | 1 | ||
| Amyloidosis | 1 | ||
| Diseases of the nervous system, chapter 6 | 2 | ||
| Neurodegenerative disease | 2 | ||
| Diseases of the circulatory system, chapter 9 | 63 | 18.9 | 3.3 (2.6–4.3) |
| Ischemic heart disease | 32 | 8.9 | 3.6 (2.5–5.1) |
| Cerebral infarction | 9 | 3.0 | 3.0 (1.4–5.7) |
| Aortic aneurysm | 6 | ||
| Intracerebral hemorrhage | 5 | ||
| Hypertensive heart disease | 4 | ||
| Subarachnoid hemorrhage | 2 | ||
| Pulmonary embolism | 1 | ||
| Atrial fibrillation | 1 | ||
| Heart failure | 1 | ||
| Stroke NOS | 1 | ||
| Peripheral arterial disease | 1 | ||
| Diseases of the respiratory system, chapter 10 | 9 | 3.2 | 2.8 (1.3–5.3) |
| Pneumonia | 7 | ||
| Asthma | 1 | ||
| COPD | 1 | ||
| Diseases of the digestive system, chapter 11 | 9 | 1.9 | 4.8 (2.2–9.1) |
| Peptic ulcer | 3 | ||
| Diverticulitis | 2 | ||
| Gallstone disease | 1 | ||
| Peritonitis | 1 | ||
| Pancreatitis | 1 | ||
| Ischemic bowel disease | 1 | ||
| Diseases of the musculoskeletal system and connective tissue, chapter 13 | 1 | ||
| Rheumatoid arthritis | 1 | ||
| Diseases of the genitourinary system, chapter 14 | 2 | ||
| Chronic renal failure | 2 | ||
| Symptoms, signs, and abnormal clinical and laboratory findings, not elsewhere classified, chapter 18 | 2 | ||
| External causes of morbidity and mortality, chapter 20 | 9 | 0.9 | 9.3 (4.3–18) |
| Suicide | 6 | ||
| Other | 3 |
Chapters listed in column 1 refer to the International Statistical Classification of Diseases and Related Health Problems.
Abbreviations: COPD, chronic obstructive pulmonary disease; NOS, not otherwise specified.
SMR was calculated for chapters with at least four events and for two predefined specific causes of death (i.e., ischemic heart disease and cerebral infarction).
There were 21 deaths due to neoplasm. The SMR calculations, however, are based on 18 malignant neoplasms (three neoplasms were benign: one neoplasm of unspecified nature of endocrine glands and other parts of the nervous system, one pituitary adenoma, and one pituitary tumor NOS).
Sixty-three patients, compared with 19 expected, had died due to cardiovascular diseases (SMR, 3.3; 95% CI, 2.6 to 4.3; Table 2). Mortality was increased due to ischemic heart disease (n = 32; SMR, 3.6; 95% CI, 2.5 to 5.1) and to cerebral infarction (n = 9; SMR, 3.0; 95% CI, 1.4 to 5.7). Excess mortality was also associated with infectious diseases; respiratory diseases, including pneumonia; and diseases of the digestive system, including diverticulitis and peritonitis (Table 2). In total, 14 patients died of infections, half of these due to pneumonia. Six of eight patients (75%) in remission who died of infections (pneumonia, n = 4; infection not otherwise specified, n = 2; diverticulitis, n = 1; peritonitis, n = 1) were receiving glucocorticoid replacement therapy; for four patients, glucocorticoid replacement therapy was administered after bilateral adrenalectomy. The number of deaths due to malignant neoplasms was not increased.
Nine patients had died of external causes (SMR, 9.3; 95% CI, 4.3 to 18); six of these (four women and two men) had committed suicide 1, 6, 10, 13, 25, and 28 years after CD had been diagnosed. CD was in remission in three of these patients, not in remission in one, and remission status was unknown for two of this group of patients.
Of 502 patients, 138 (27%) received a CD diagnosis before 1987, 120 (24%) between 1987 and 1995, 128 (25%) between 1996 and 2004, and 116 (23%) between 2005 and 2013. SMR was increased during all time periods without any trend toward improved outcome Fig. 1A).
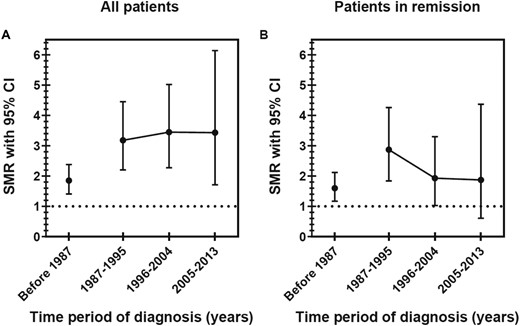
Time trends of overall mortality for patients diagnosed with CD. SMRs with 95% CIs in (A) the whole cohort and (B) patients in remission. For the whole cohort, the numbers of deaths in the relevant time periods for diagnosis were as follows: 61 before 1987, 34 during 1987–1995, 27 during 1996–2004, and 11 during 2005–2013. For patients in remission, the numbers of deaths in the relevant time periods for diagnosis were as follows: 47 before 1987, 24 during 1987–1995, 13 during 1996–2004, and 5 during 2005–2013.
Influence of remission status, age, sex, time from diagnosis to remission, and time in remission on mortality
Of the 502 patients, 419 (83%) were confirmed to be in biochemical remission, 40 (8%) were not in remission, and remission status could not be determined in the remaining 43 (9%) (Table 1). The median time from diagnosis to remission was 6 (IQR, 3 to 13) months and did not differ between time periods when CD was diagnosed. Of the 419 patients in remission, 89 (21%) had died, compared with 22 of 40 patients (55%) not in remission and 22 of 43 patients (51%) with unknown remission status. Among the deceased patients, the median time from start of study to death was 10.8 (IQR, 6.5 to 18.0) years for patients in remission, 2.7 (0.4 to 6.0) years for those not in remission, and 6.1 (1.2 to 10.5) years for those with unknown remission status.
Total SMR was markedly increased (6.9; 95% CI, 4.3 to 10.4) for patients not in remission (Table 3). SMR for patients in remission was lower but still increased (1.9; 95% CI, 1.5 to 2.3; P < 0.0001). In patients in remission, mortality was similar when using the date of remission as baseline (SMR, 1.9; 95% CI, 1.6 to 2.4) instead of the start of follow-up. SMR due to cardiovascular diseases, including ischemic heart disease, was increased for patients in remission and those not in remission.
SMR According to Remission Status
| Observed No. of Deaths | Expected No. of Deaths | SMR (95% CI) | |
|---|---|---|---|
| All | |||
| In remission (n = 419) | 89 | 47.3 | 1.9 (1.5–2.3) |
| Not in remission (n = 40) | 22 | 3.2 | 6.9 (4.3–10) |
| Remission status unknown (n = 43) | 22 | 4.2 | 5.2 (3.3–7.9) |
| Women | |||
| In remission (n = 325) | 66 | 37.0 | 1.8 (1.4–2.3) |
| Not in remission (n = 31) | 16 | 2.8 | 5.8 (3.3–9.4) |
| Remission status unknown (n = 31) | 15 | 3.4 | 4.4 (2.5–7.3) |
| Men | |||
| In remission (n = 94) | 23 | 10.3 | 2.2 (1.4–3.4) |
| Not in remission (n = 9) | 6 | 0.4 | 14.1 (5.2–31) |
| Remission status unknown (n = 12) | 7 | 0.8 | 8.5 (3.4–18) |
| Circulatory diseases | |||
| In remission (n = 419) | 42 | 16.5 | 2.5 (1.8–3.4) |
| Not in remission (n = 40) | 10 | 1.1 | 9.5 (4.5–17) |
| Remission status unknown (n = 43) | 11 | 1.3 | 8.2 (4.1–15) |
| Ischemic heart disease | |||
| In remission (n = 419) | 21 | 7.7 | 2.7 (1.7–4.2) |
| Not in remission (n = 40) | 5 | 0.5 | 10.7 (3.5–25) |
| Remission status unknown (n = 43) | 7 | 0.7 | 10.4 (4.2–22) |
| Malignant neoplasms | |||
| In remission (n = 419) | 15 | 15.9 | 0.9 (0.5–1.6) |
| Not in remission (n = 40) | 2 | 0.9 | 2.0 (0.3–7.4) |
| Remission status unknown (n=43) | 1 | 1.7 | 0.6 (0.02–3.3) |
In a Cox regression analysis, older age at the start of the study and time in remission were associated with mortality risk, but sex and time from diagnosis to remission were not (model 1; Table 4). After adjustment for age at study start, the HR for overall mortality was 3.0 (95% CI, 1.9 to 4.9; P < 0.0001) for patients not in remission and 2.5 (95% CI, 1.6 to 4.1; P < 0.0001) for patients with unknown remission status, when using patients in remission as a referent (Fig. 2). HR for death due to circulatory diseases in patients not in remission was 2.7 (95% CI, 1.4 to 5.6; P = 0.0051) and 2.5 (95% CI, 1.3 to 5.1; P = 0.0089) for patients with unknown remission status.
Cox Regression Analyses
| HR | 95% CI | P Value | |
|---|---|---|---|
| Model 1 | |||
| Age at study start, y | 1.12 | 1.08–1.15 | <0.0001 |
| Male sex | 1.5 | 0.6–3.7 | 0.41 |
| Time from diagnosis to remission, moa | 0.8 | 0.6–1.1 | 0.16 |
| Time in remission, moa | 0·3 | 0.1–0.6 | 0.0018 |
| Remission status | |||
| Age at study start, y | 1.11 | 1.09–1.12 | <0.0001 |
| Not in remission | 3.0 | 1.9–4.9 | <0.0001 |
| Remission status unknown | 2.5 | 1.6–4.1 | <0.0001 |
| Model 2 | |||
| Age at study start, y | 1.11 | 1.09–1.13 | <0.0001 |
| Time in remission, moa | 0.2 | 0.1–0.4 | <0.0001 |
| Pituitary surgery | 1.5 | 0.8–3.1 | 0.24 |
| Pituitary radiotherapy | 0.9 | 0.6–1.6 | 0.86 |
| Bilateral adrenalectomy | 2.7 | 1.7–4.3 | <0.0001 |
| Model 3 | |||
| Age at study start, y | 1.11 | 1.09–1.14 | <0.0001 |
| Time in remission, moa | 0.3 | 0.2–0.6 | 0.0002 |
| Treatment with glucocorticoids | 2.6 | 1.5–4.8 | 0.0014 |
| Treatment with thyroxine | 1.2 | 0.7–2.1 | 0.59 |
| Treatment with GH | 0.4 | 0.2–0.8 | 0.014 |
| Model 4 | |||
| Age at study start, y | 1.12 | 1.10–1.14 | <0.0001 |
| Time in remission, moa | 0.2 | 0.1–0.4 | <0.0001 |
| Hypertension | 0.8 | 0.5–1.2 | 0.28 |
| Diabetes mellitus | 1.2 | 0.7–2.2 | 0.52 |
Time from diagnosis to remission and time in remission were not normally distributed; therefore, they were log transformed before they were used in the regression analyses.
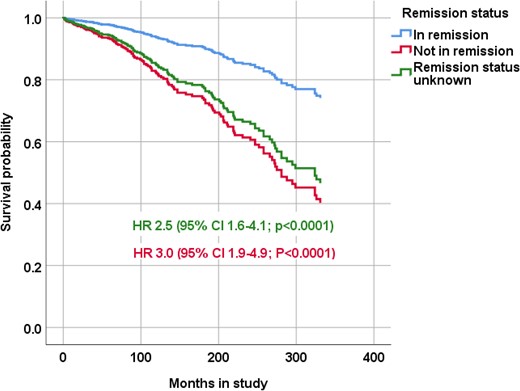
Survival probability, according to remission status, of patients diagnosed with CD. The Cox regression model was adjusted for age at start of the study and shows HRs with 95% CIs for all causes of death of patients not in remission and patients with unknown remission status.
SMR for patients in remission was increased in those with CD diagnosed before 1987, between 1987 and 1995, and between 1996 and 2004 (Fig. 1B). SMR for patients in remission in whom CD was diagnosed most recently (2005 to 2013) was 1.9 (95% CI, 0.6 to 4.4).
Influence of treatment on mortality
Of 419 patients in remission, 315 (75%) had undergone pituitary surgery, 116 (28%) radiotherapy, and 102 (24%) bilateral adrenalectomy (Table 1). Of 419 patients, 281 (67%) had attained remission after a single treatment, 78 (19%) after two treatments, 35 (8%) after three treatments, and 22 (5%) after four or more treatments.
In a Cox regression analysis adjusted for age at the start of study and time in remission, and including only patients in remission, the HR for mortality in patients who had undergone bilateral adrenalectomy was increased (2.7; 95% CI, 1.7 to 4.3; P < 0.0001; Fig. 3), but it was not in patients who had undergone pituitary surgery or pituitary radiotherapy (model 2; Table 4). Adding glucocorticoid treatment to the model did not influence the results (data not shown). The HR for mortality was not increased for patients who had received more than one treatment compared with patients who had only received a single treatment and was not decreased in patients who had attained remission after a single pituitary operation (data not shown).
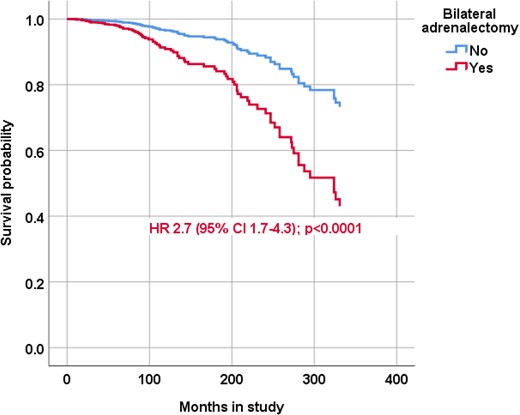
Survival probability of patients with CD according to bilateral adrenalectomy status. The Cox regression model was adjusted for age at start of the study and time in remission and the HR with 95% CIs is reported for patients in remission treated with bilateral adrenalectomy.
Of 102 patients who had undergone bilateral adrenalectomy, 32 (31%) developed Nelson syndrome; of these nine (28%) were treated with pituitary surgery, 11 (34%) with radiotherapy, and 12 (38%) underwent both surgery and radiotherapy. In a regression analysis including only patients treated with bilateral adrenalectomy, treatment administered because of development of Nelson syndrome was not associated with excess mortality (HR, 1.1; 95% CI, 0.6 to 2.0; P = 0.80).
Of 419 patients in remission, 22 (5%) had been treated for recurrent disease after a median of 8 years (IQR, 3.5 to 14; range, 3 to 40) from first treatment. Only one of these patients had died during the follow-up period.
Influence of hypopituitarism, hypertension, and diabetes mellitus on mortality
Information on hormone replacement therapy was available for 395 of 419 patients (94%) in remission. Of these, 232 (59%) were receiving glucocorticoid replacement, 151 (38%) thyroxine, 95 (24%) GH replacement, and 28 (7%) desmopressin. The median daily hydrocortisone dose was 24 (range, 20 to 30) mg. Thirty women (10%) were receiving estrogen and 44 men (49%) were receiving testosterone.
The HR for mortality for patients in remission who were receiving glucocorticoid replacement was 2.6 (95% CI, 1.5 to 4.8; P = 0.0014), 1.2 (95% CI, 0.7 to 2.1; P = 0.59) for patients receiving thyroxine, and 0.4 (95% CI, 0.4 to 0.8; P = 0.014) for patients receiving GH replacement (model 3, Table 4; Fig. 4). The HR for mortality for patients receiving <25 mg hydrocortisone did not differ from the HR for patients receiving ≥25 mg (Fig. 4B).
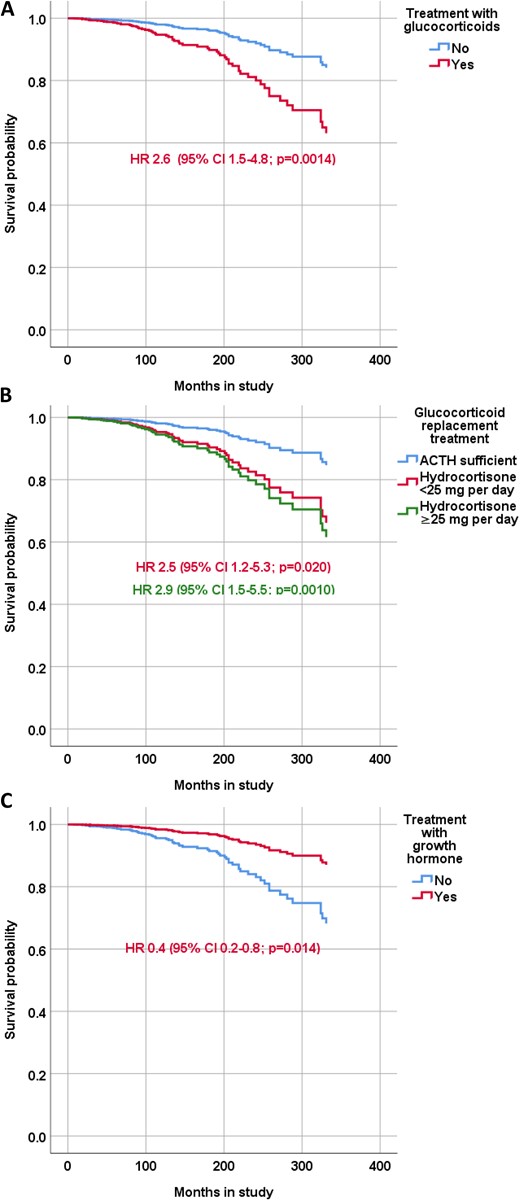
Survival probability of patients with CD according treatment status. The Cox regression model was adjusted for age at start of the study and time in remission and shows the HRs with 95% CIs for patients in receiving (A) glucocorticoid replacement therapy, (B) hydrocortisone <25 mg/d or ≥25 mg/d, and (C) GH replacement therapy.
Information on treatment of hypertension and diabetes mellitus at the last follow-up was available in 400 (95%) and 399 (95%) patients in remission, respectively. A total of 150 patients (38%) were treated for hypertension and 55 (14%) for diabetes mellitus. In patients in remission, the HR for mortality was not increased in patients with hypertension (0.8; 95% CI, 0.5 to 1.2; P = 0.28) or diabetes mellitus (1.2; 95% CI, 0.7 to 2.2; P = 0.52; model 4, Table 4).
Discussion
This nationwide study presents data from the largest Swedish cohort published to date of well-characterized patients with CD. The study not only confirms the previously reported poor overall outcome in patients with CD but also presents a comprehensive analysis of disease-specific mortality. With data from >7000 patient-years, we have also been able to identify clinical factors such as treatment with bilateral adrenalectomy and chronic glucocorticoid dependency that are associated with worse outcome.
The most common cause of death in the current study was from cardiovascular diseases, including ischemic heart disease and cerebral infarction, with a more than doubled mortality risk for patients in remission. Thus, the adverse impact of transient hypercortisolemia on the cardiovascular system in patients with CS seems to be chronic and irreversible in parallel with the sustained negative effects on the central nervous system (18). Thus, our results imply that a more aggressive treatment of hypertension, dyslipidemia, and other cardiovascular risk factors might be warranted in patients with CS in remission in a similar manner to the approach taken in patients with diabetes mellitus. SMR due to diseases of the respiratory and digestive system, as well as infectious diseases, was also increased. Interestingly, the majority of deaths due to diseases of the respiratory system were pneumonias and a substantial number of deaths due to diseases of the digestive system were also due to infections. Furthermore, three-quarters of patients in remission who died of infections had received chronic glucocorticoid replacement therapy. These findings emphasize the importance of adequate adjustment of glucocorticoid replacement during intercurrent illness in patients with secondary adrenal insufficiency (19).
Major depressive disorder is common in patients with CS, both before and after treatment (20–22). Suicide is considered to be an important cause of early death in patients with endogenous CS (23). However, in previous epidemiological studies on mortality in patients with CS (3–10, 12–14), only one patient was reported to have died of suicide (3). Otherwise, only single case reports have been published (24–26). Six patients in our cohort had committed suicide (i.e., 5% of all deaths), illustrating that psychiatric illness is a serious and important comorbidity in patients with CS even after obtaining biochemical remission.
Previously, age at diagnosis (4, 9, 12), duration of active disease (14), hypertension (6, 12), diabetes mellitus (4, 6, 12), and treatment with bilateral adrenalectomy (4) have been associated with increased mortality. We found higher age at diagnosis and bilateral adrenalectomy, but not hypertension or diabetes mellitus, were associated with increased mortality. However, because bilateral adrenalectomy is not first-line treatment, our data suggest that the patients in this subgroup might have had more severe CD. In our study, information on the duration of active CS was not available. However, a related measure of untreated CS in our study (i.e., time from diagnosis to curative treatment) was not associated with increased mortality risk. Finally, and in contrast with findings of a previous study (27), we did not observe any association between the number of treatments and survival, although one-third of the patients needed two or more treatments to attain remission. This may suggest that the most important goal in the treatment of CD is to achieve remission by any means, without considering how this is achieved. One inclusion criterion in the previous study was biochemical remission for ≥10 years (27). The reason for the normal SMR in that study, therefore, may be explained by a survival bias (i.e., patients deceased within 10 years from treatment were not included in the analysis). In fact, the lowest SMR in our study was observed in patients whose CD was diagnosed before 1987 (i.e., patients who were captured in the national patient registry in 1987 or later but had received their diagnosis earlier). This is most probably also explained by a survival bias (i.e., patients diagnosed, and deceased, before 1987 were not captured with our search criteria).
An interesting finding in our study was that glucocorticoid dependency after remission was associated with a more than twofold increased mortality. Glucocorticoid replacement therapy has been associated with increased mortality in patients with nonfunctioning pituitary adenoma (28–30) and in patients with acromegaly (31). Furthermore, higher glucocorticoid doses have been associated with worse outcome (28–31). In our study, GH replacement therapy was associated with reduced mortality risk and is in line with a previous report on patients with nonfunctioning pituitary adenoma (32). Although we find this observation to be interesting, it has to be interpreted with caution. First, we did not have information on how many patients actually had GH deficiency, only how many received replacement. Second, GH replacement was generally not available until the mid-1990s and patients diagnosed with CD earlier are less likely to have been evaluated for GH deficiency.
Mortality time trends in patients with CD have not been studied systematically. However, recently, our group demonstrated a declining mortality rate in patients with nonfunctioning pituitary adenoma (33) and patients with acromegaly (34). This positive development was not observed in the current study, in which the mortality ratio during the three time periods between 1987 and 2014 did not differ.
The major limitation of the study is the retrospective design—an almost unavoidable method when studying mortality in patients with a rare disease such as CD. The strengths of this study are, however, the large number of well-characterized patients and the long follow-up time. Another major strength is the thorough review of the medical records performed to ensure the diagnosis of CD was correct and to confirm remission status. Thus, we consider the current study to be the most comprehensive analysis of mortality in patients with CD to date.
In conclusion, our findings from this large, nationwide study show that patients with CD continue to have excess mortality even after remission. The highest mortality was in subgroups of patients with persistent disease, those who were treated with bilateral adrenalectomy, and those who required glucocorticoid replacement. Although main causes of death were cardiovascular, this is the first study to our knowledge to uncover a high rate of death from suicide. Additional studies should focus on identifying best approaches to obtaining remission, active surveillance, adequate hormone replacement, and long-term management of cardiovascular and mental health in these patients (35).
Abbreviations:
- CD
Cushing disease
- CS
Cushing syndrome
- HR
hazard ratio
- IQR
interquartile range
- SMR
standardized mortality ratio
Acknowledgments
Editorial support was provided by Peter Todd of Tajut Ltd. (Kaiapoi, New Zealand), which was funded by The Gothenburg Society of Medicine and The Health and Medical Care Committee of the Regional Executive Board (Region Västra Götaland).
Financial Support: This work was supported by grants to O.R. from the Gothenburg Society of Medicine and The Health and Medical Care Committee of the Regional Executive Board (Region Västra Götaland). The funder of the study had no role in the study design, data collection, data analysis, data interpretation, or writing the report.
Author Contributions: O.R. and G.J. conceived the project and designed the study. O.R., E.P., D.C., P.D., E. Segerstedt, T.O., M.P., K.B., S.B., C.H., B.E.-E., P.B., L.B., C.F., D.P., E.M.E., J.W., B.E., A.-K.Å., and E. Schwarcz collected data and performed medical record reviews. O.R., D.S.O., and I.-L.B. performed the statistical analyses. O.R. wrote the first draft of the report. All authors made critical revisions of the report and approved the final report. O.R. had full access to all the data in the study and had final responsibility for the decision to submit for publication.
Disclosure Summary: O.R. has received lecture fees from Novo Nordisk, Ipsen, Sandoz, and Pfizer; an unrestricted research grant from HRA Pharma; and consultancy fees from Novartis and HRA Pharma. D.S.O. has received consultancy fees from Pfizer, Ipsen, and Sandoz; and unrestricted research grants from Sandoz. D.C. has received lecture honoraria from Otsuka Pharma Scandinavia AB and Sanofi Genzyme. C.H. has received lecture fees from Novo Nordisk, Ipsen, Sandoz, Otsuka, and Pfizer. P.B. has received consultancy fees from Pfizer; independent research grants from Novartis; and lecture fees from Ipsen, Pfizer, and Novartis. D.P. has received lecture fees from Novo Nordisk, Boehringer-Ingelheim, and Sanofi. E. Schwarcz has received lecture fees from Novo Nordisk, Sanofi, Eli Lilly, and AstraZeneca. G.J. has received lecture fees from Novartis, Novo Nordisk, Pfizer, Sandoz, Merck Serono, and Otsuka, as wells as consultancy fees from AstraZeneca and Shire. The remaining authors have nothing to disclose.
