


Abstract
Insulin resistance is an adverse health outcome that accompanies obesity. Fat mass is negatively associated with the bone mass after adjustment for confounders. Insulin resistance might be an intermediary in this relationship.
To determine whether insulin resistance is an intermediary in the relationship between adiposity and bone mass in adolescents.
Cross-sectional secondary analysis of baseline data from a previous randomized trial.
University research facility.
A total of 240 adolescents (68% female), aged 7 to 15 years.
Using dual energy x-ray absorptiometry, bone mineral content (BMC), areal bone mineral density, lean mass, and fat mass were measured. Skeletal sites of interest included the total body and lumbar spine (LS). Waist circumference was measured using an anthropometric tape measure. Insulin and glucose were measured in fasting sera, and the homeostasis model assessment of insulin resistance (HOMA-IR) was calculated. Path analysis was performed to determine whether the relationship between adiposity and bone was mediated through insulin resistance.
Fat mass (r = 0.467; P < 0.001) and waist circumference (r = 0.487; P < 0.001) correlated positively with HOMA-IR. Controlling for race, sex, maturation, lean mass, and height, fat mass, waist circumference, and HOMA-IR were negatively associated with LS BMC and total body areal bone mineral density (P < 0.05 for all). Additionally, path models for fat mass (95% CI, −5.893 to −0.956) and waist circumference (95% CI, −15.473 to −2.124) showed a negative relationship with LS BMC via HOMA-IR.
These results support an intermediary role of insulin resistance in the relationship between adiposity and LS bone mass.
Childhood obesity is a global health concern, with recent estimates indicating that >100 million children and adolescents worldwide are obese (1). Because of these data and because childhood is a pivotal period of bone growth (2), attention has heightened regarding the role of excess adiposity on childhood skeletal health. Numerous studies have shown that children who are overweight and have obesity have similar or even greater bone mass, geometry, and strength compared with those who are normal weight (3–5). However, after accounting for lean body mass, adiposity appears to be a negative predictor of bone mass in children and adolescents (3, 5, 6). This discrepancy might help explain the results from epidemiological studies indicating that adolescents with obesity are at an increased risk of fracture (7).
Insulin resistance is a common metabolic complication of obesity, a component of type 2 diabetes (8, 9), and has been implicated in the fat–bone connection (5, 10, 11). In boys and girls aged 9 to 13 years, who were at the early stages of sexual maturation, insulin resistance was associated with deficits in cortical bone size and estimated bending strength (10). In addition, results from a recent cross-sectional study of females nearing the age of peak bone mass (age, 18 to 19 years) suggested that insulin resistance might play an intermediary role in the link between fat and bone (5).
The present study was a cross-sectional secondary analysis of baseline data from a previously completed randomized controlled dairy intervention of boys and girls aged 7 to 15 years (12). Our primary objective was to determine whether insulin resistance was an intermediary in the relationship between adiposity and bone mass using path analysis. Path analysis is an extension of multiple regression analysis and is a component of structural equation modeling, a statistical method used to test networks of measured variables and unmeasured constructs (13, 14). One of the main strengths of path analysis is that it provides an opportunity to test a priori causal (or “mediation”) hypotheses using nonexperimental data. However, the results from path analyses should still be interpreted with caution, because causal inference is not appropriate for studies using observational data. Our hypothesized path model is presented in Fig. 1. Because the relationships among adiposity, metabolic health, and bone strength appear to be dependent on the region of adipose deposition (9, 11, 15), we included both total body fat mass and waist circumference as measures of adiposity, with the latter a measure of abdominal fat, which is associated with insulin resistance in children (16).
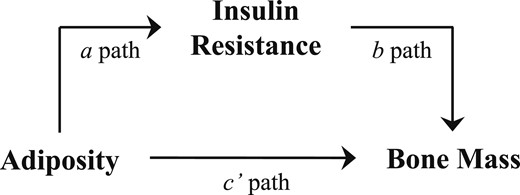
A priori path model for the insulin resistance-dependent relationship between adiposity and bone mass in children. The rationale for this approach is based on previous pediatric data showing that (i) insulin resistance is an adverse health outcome accompanying obesity (a path) (23); (ii) fat mass (c’ path) (3, 5, 24) and insulin resistance (b path) (10, 25) are negatively associated with bone mass; and (iii) obesity-related skeletal inadequacies are nullified when controlling for insulin resistance (5).
Materials and Methods
Study participants
We performed a secondary analysis of data collected during a multisite [Purdue University (PU) and Indiana University (IU)] intervention aimed at examining the influence of dairy consumption on bone mass accrual during adolescence (12). A total of 240 black and white boys and girls aged 7 to 15 years participated in the baseline data collection. Using the body mass index (BMI)-for-age percentile (17), participants were required to be either healthy weight (5th to 75th percentile) or overweight (>85th percentile). Of the cohort, 47% were overweight and 53% were at a healthy weight. We did not report the results stratified by body weight group, because the relationship between adiposity/insulin resistance and bone measurements were similar between the overweight and healthy weight groups (data not shown). Prospective participants were excluded from the present study if they had a previous diagnosis of any chronic disease or growth disorder, were currently taking any medications and/or supplements known to affect bone metabolism, or had sustained a skeletal fracture within the previous year. Additionally, all participants were required to have a self-reported usual calcium intake of <800 mg/d, which was measured using a validated food frequency questionnaire (18). The human institutional review board at PU and IU approved all study protocols and procedures. The participants and their parents or guardians provided written informed assent and consent, respectively.
Anthropometric measurements
Anthropometric measurements were performed with the study participants wearing light indoor clothing, without shoes. Weight was measured using an electronic scale and recorded to the nearest 0.1 kg. The Scale-Tronix digital scale (Welch Allyn, Inc., Skaneateles, NY) was used at PU, and the Health O Meter professional digital scale, model 349KLX (Health O Meter Products, Bedford Heights, OH) at IU. Height was measured using a wall-mounted Measurement Concepts stadiometer (QuickMedical, Issaquah, WA) at PU and the QuickMedical Heightronic 235 digital stadiometer at IU. Sex-specific height, weight, and BMI-for-age Z-scores were calculated using the 2000 Centers for Disease Control and Prevention growth charts (17). Furthermore, waist circumference was measured to the nearest 0.1 cm using an anthropometric tape measure with a spring tension control (Gulick II, model 67020; FitnessMart, Division of County Technology, Gay Mills, WI) (19).
Sexual maturation rating stage
The sexual maturation rating stage was assessed using the method set forth by Tanner (20). All participants were provided a self-report form with drawings, which were used to assess the genital and breast development for boys and girls, respectively.
Dual-energy x-ray absorptiometry
Bone and body composition (fat mass and lean mass) were measured using dual energy x-ray absorptiometry [DXA; Lunar iDXA at PU (Madison, WI) and Hologic Discovery W (Waltham, MA) at IU]. We report the bone mineral content (BMC) and areal bone mineral density (aBMD) at the total body minus the head (TB) and lumbar spine (LS), in accordance with recommendations from the International Society for Clinical Densitometry (21). The same researcher at both study sites performed and analyzed all scans, using instrument-specific software and procedures. The PU and IU DXA scanners were cross calibrated by scanning 10 individuals on both machines and generating regression formulas to adjust the data obtained at IU to the PU values. The coefficients of variation based on phantom scans for LS BMC, TB BMC, fat mass, and lean mass were 1.18%, 1.93%, 1.10%, and 0.72%, respectively.
Biochemistry tests
In the morning after an overnight fast, blood samples were collected and stored at −80°C. A single serum glucose measurement was performed using the RX Daytona analyzer (Randox Engineering, Antrim, UK). Insulin was measured in duplicate (coefficient of variation, 7.0%) using an immunoradiometric assay kit from DiaSorin (Stillwater, MI). The homeostasis model assessment of insulin resistance (HOMA-IR) was calculated (22).
Statistical analysis
Descriptive participant characteristics are presented as the mean ± SD, unless otherwise indicated. Lean mass, fat mass, waist circumference, and HOMA-IR were log transformed to correct for non-normal distributions. Relationships between adiposity, as measured by TB fat mass and waist circumference, and HOMA-IR were performed using partial correlations with race, sex, sexual maturation, and height included as covariates. To assess the relationships between adiposity measures and insulin resistance with bone mass, bivariate correlations were performed. Additionally, partial correlations and multiple regression analyses were performed with race, sex, maturation, height, and lean mass included as covariates.
After establishing significant relationships between adiposity and HOMA-IR, adiposity and LS BMC, and HOMA-IR and LS BMC, path analysis [model 4 mediation, as described by Hayes (14)] was used to determine whether the relationship between adiposity and LS BMC and TB aBMD was mediated through HOMA-IR. Assumptions included the linearity of relationships, normality, and independence of errors. Regression residuals for each of these individual analyses were inspected for skewness, kurtosis, and outliers and followed an approximately normal distribution. Separate path analyses were performed using fat mass and waist circumference as measures of adiposity. Race, sex, sexual maturation, height, and lean mass were included as covariates for all analyses. Simplified models that included only sex, height, and lean mass as covariates were also performed (data not shown), yielding results similar to our primary analyses. Bias-corrected 95% CIs were calculated after 10,000 bootstrap iterations. This bootstrapping procedure does not include any assumptions regarding the shape of the sampling distribution of the indirect effect tests, which is calculated as the product of the a and b paths (Fig. 1). All statistically significant P values within each path model remained statistically significant after adjusting for multiple comparisons using the Holm-Bonferroni procedure. All P values < 0.05 were considered statistically significant, and all analyses were performed using SPSS, version 23 (IBM Corp., Armonk, NY). Path analyses were performed using the SPSS PROCESS program (14).
Results
Descriptive participant characteristics for the males and females are presented in Table 1. After adjusting for race, sex, sexual maturation, and height, fat mass (r = 0.447; P < 0.001) and waist circumference (r = 0.468, P < 0.001) correlated positively with HOMA-IR. Fat mass, waist circumference, and HOMA-IR were negatively associated with LS BMC and TB aBMD, controlling for race, sex, sexual maturation, height, and lean mass (P < 0.05 for all; Tables 2 and 3).
Participant Characteristics
| Characteristic | Boys (n = 78) | Girls (n = 162) | ||
|---|---|---|---|---|
| n | Mean ± SD | n | Mean ± SD | |
| Black race, % | 78 | 74.4 | 162 | 56.8 |
| Age, years | 78 | 12.03 ± 1.77 | 162 | 11.77 ± 1.47 |
| Sexual maturation, n | 76 | 156 | ||
| 1 | 14 | 22 | ||
| 2 | 16 | 38 | ||
| 3 | 16 | 55 | ||
| 4 | 15 | 23 | ||
| 5 | 15 | 18 | ||
| Height, cm | 78 | 152.9 ± 13.2 | 162 | 150.8 ± 11.2 |
| Height, Z-score | 78 | 0.31 ± 0.90 | 162 | 0.28 ± 1.06 |
| Weight, kg | 78 | 51.0 ± 20.7 | 162 | 51.1 ± 19.6 |
| Weight, Z-score | 78 | 0.69 ± 1.20 | 162 | 0.70 ± 1.19 |
| BMI, kg/m2 | 78 | 21.3 ± 6.3 | 162 | 21.9 ± 6.3 |
| BMI, Z-score | 78 | 0.64 ± 1.12 | 162 | 0.73 ± 1.09 |
| BMI-for-age percentile, % | 78 | 66.0 ± 29.4 | 162 | 68.9 ± 28.5 |
| Waist circumference, cm | 78 | 72.7 ± 16.6 | 162 | 74.8 ± 15.8 |
| LS BMC, g | 78 | 38.0 ± 14.5 | 162 | 39.4 ± 14.0 |
| LS aBMD, g/cm2 | 78 | 0.77 ± 0.17 | 162 | 0.84 ± 0.18 |
| Total body BMC, g | 77 | 1330 ± 518 | 162 | 1282 ± 406 |
| Total body aBMD, g/cm2 | 78 | 0.89 ± 0.16 | 162 | 0.87 ± 0.14 |
| Fat mass, g | 76 | 12,821 ± 7795 | 162 | 17,102 ± 10,536 |
| Lean mass, g | 77 | 36,173 ± 12,058 | 162 | 32,814 ± 9797 |
| Insulin, µU/mL | 63 | 14.3 ± 5.7 | 135 | 22.0 ± 13.2 |
| Glucose, mg/dL | 60 | 95.6 ± 9.8 | 136 | 92.3 ± 8.2 |
| HOMA-IR | 56 | 3.36 ± 1.49 | 134 | 5.03 ± 3.04 |
Bivariate and Partial Correlations Between Adiposity and Insulin Resistance With TB and LS BMC and aBMD in Children
| Variable | TB Fat Mass | Waist Circumference | HOMA-IR | |||
|---|---|---|---|---|---|---|
| r Value | P Value | r Value | P Value | r Value | P Value | |
| Unadjusteda | ||||||
| TB BMC | 0.619b | < 0.001b | 0.683b | < 0.001b | 0.402b | < 0.001b |
| TB aBMD | 0.571b | < 0.001b | 0.646b | < 0.001b | 0.402b | < 0.001b |
| LS BMC | 0.523b | < 0.001b | 0.575b | < 0.001b | 0.337b | < 0.001b |
| LS aBMD | 0.545b | < 0.001b | 0.575b | < 0.001b | 0.369b | < 0.001b |
| Adjustedc | ||||||
| TB BMC | 0.029 | 0.662 | 0.001 | 0.986 | −0.091 | 0.224 |
| TB aBMD | −0.151b | 0.024b | −0.145b | 0.029b | −0.161b | 0.031b |
| LS BMC | −0.180b | 0.007b | −0.169b | 0.011b | −0.237b | 0.001b |
| LS aBMD | −0.051 | 0.445 | −0.023 | 0.732 | −0.085 | 0.259 |
Statistical analyses were performed using Pearson bivariate analyses.
Statistically significant.
Statistical analyses were performed using Pearson partial correlations; race, sex, sexual maturation, height, and lean mass were included as covariates for partial correlation analysis.
Multiple Linear Regression Models for LS BMC and TB aBMD and HOMA-IR, Waist Circumference, and Fat Mass
| Variable | HOMA-IR | Variable | Waist Circumference | Variable | Fat Mass | ||||||
|---|---|---|---|---|---|---|---|---|---|---|---|
| b | SE | P Value | b | SE | P Value | b | SE | P Value | |||
| LS BMC | |||||||||||
| Constant | −336.0 | 30.90 | < 0.001 | Constant | −376.8 | 29.59 | < 0.001 | Constant | −345.7 | 30.52 | < 0.001 |
| Race | 0.148 | 0.924 | 0.873 | Race | −0.466 | 0.807 | 0.564 | Race | −0.129 | 0.808 | 0.874 |
| Sex | 6.350 | 1.114 | < 0.001 | Sex | 6.309 | 1.017 | < 0.001 | Sex | 6.590 | 1.101 | < 0.001 |
| Maturation | 0.864 | 0.578 | 0.137 | Maturation | 0.205 | 0.521 | 0.694 | Maturation | 0.355 | 0.526 | 0.500 |
| Height | 0.240 | 0.084 | 0.005 | Height | 0.130 | 0.088 | 0.139 | Height | 0.225 | 0.086 | 0.009 |
| Lean mass | 73.07 | 8.885 | < 0.001 | Lean mass | 99.43 | 11.17 | < 0.001 | Lean mass | 82.80 | 10.46 | < 0.001 |
| HOMA-IR | −8.254 | 2.438 | 0.001 | Waist circumference | −33.92 | 9.097 | < 0.001 | Fat mass | −8.490 | 3.014 | 0.005 |
| Total body aBMD | |||||||||||
| Constant | −4.062 | 0.285 | 0.000 | Constant | −4.094 | 0.256 | 0.000 | Constant | −3.889 | 0.268 | 0.000 |
| Race | 0.015 | 0.009 | 0.090 | Race | 0.012 | 0.007 | 0.077 | Race | 0.015 | 0.007 | 0.040 |
| Sex | 0.035 | 0.010 | 0.001 | Sex | 0.037 | 0.009 | 0.000 | Sex | 0.037 | 0.010 | 0.000 |
| Maturation | 0.006 | 0.005 | 0.287 | Maturation | 0.008 | 0.005 | 0.088 | Maturation | 0.009 | 0.005 | 0.061 |
| Height | −0.001 | 0.001 | 0.077 | Height | −0.002 | 0.001 | 0.005 | Height | −0.001 | 0.001 | 0.052 |
| Lean mass | 1.125 | 0.082 | 0.000 | Lean mass | 1.271 | 0.096 | 0.000 | Lean mass | 1.141 | 0.092 | 0.000 |
| HOMA-IR | −0.052 | 0.022 | 0.021 | Waist circumference | −0.293 | 0.079 | 0.000 | Fat mass | −0.066 | 0.026 | 0.013 |
HOMA-IR, waist circumference, fat mass, and lean mass were log-transformed for all analyses; b represents the unstandardized regression coefficient.
The path models presented in Fig. 2 depict the HOMA-IR–dependent relationship between adiposity (fat mass and waist circumference) and LS BMC and TB aBMD, controlling for race, sex, maturation, height, and lean mass. Fat mass was a positive predictor of HOMA-IR, and HOMA-IR was a negative predictor of LS BMC (P < 0.01 for all; Fig. 2A). Fat mass did not correlate with LS BMC after controlling for the mediator, HOMA-IR. The test for an indirect effect was statistically significant and negative (95% CI, −5.893 to −0.956). Waist circumference was a positive predictor of HOMA-IR, and HOMA-IR was a negative predictor of LS BMC (Fig. 2B). Even with adjustment for the mediator, HOMA-IR, waist circumference remained negatively associated with LS BMC (P < 0.05 for all). The test for an indirect effect was statistically significant and negative (95% CI, −15.473 to −2.124). The test for an indirect effect for TB aBMD was negative but was not statistically significant for either fat mass or waist circumference (Fig. 2C and 2D).
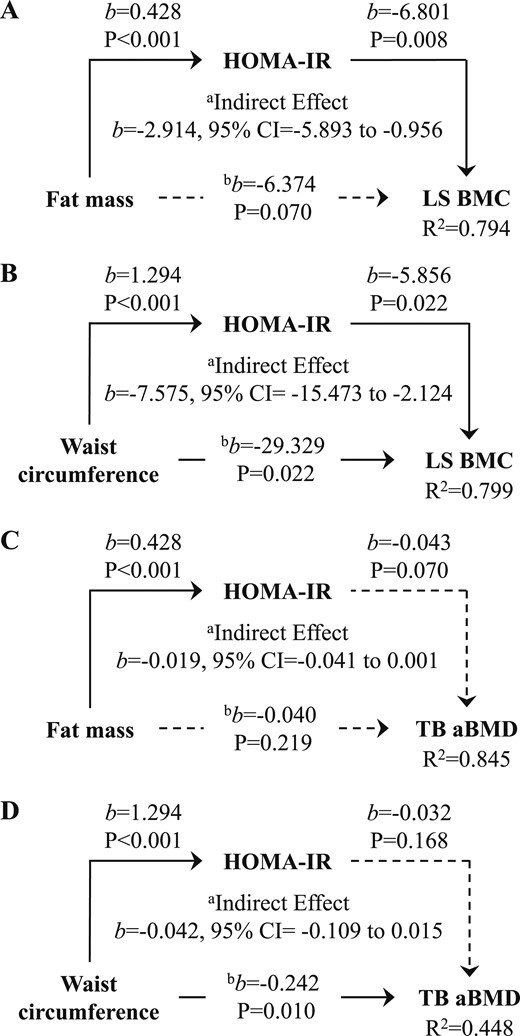
(A) Fat mass and (B) waist circumference are negative predictors of LS BMC but not (C,D) TB aBMD, via HOMA-IR, controlling for race, sex, sexual maturation, height, and lean mass. aRelationship between respective adiposity and bone measure through HOMA-IR. bRelationship between respective adiposity and bone measure, controlling for the mediator, HOMA-IR. Solid and broken lines represent statistically significant and nonsignificant relationships, respectively. b, unstandardized regression coefficient.
Discussion
The rationale for assessing the role of insulin resistance in the fat–bone relationship was determined from previous data showing that (i) insulin resistance is an adverse health outcome accompanying obesity (23); (ii) fat mass (3, 5, 24) and insulin resistance (10, 25) are negatively associated with bone mass; and (iii) obesity-related skeletal inadequacies are nullified, controlling for insulin resistance (5). Visceral adiposity is a pathogenic fat depot associated with insulin resistance (26) and suboptimal bone strength in children (27, 28) and adults (29, 30). Therefore, we included both fat mass and waist circumference as measures of adiposity, with the latter a commonly used indicator of visceral fat. That our path analysis results support a negative insulin resistance-dependent relationship between adiposity and LS BMC, but not total body aBMD, builds on earlier results involving insulin resistance and trabecular bone microarchitecture in obese adolescent females (5). Furthermore, subtle differences in the path models for waist circumference vs fat mass suggest that the fat–bone relationship might differ by the location of adipose deposition.
The idea that obesity-related metabolic health manifestations might adversely influence bone strength was introduced by Afghani et al. (25) In overweight Hispanic children, fasting insulin and insulin response after an oral glucose tolerance test were negatively associated with bone mass. Thereafter, several studies have shown that children with insulin resistance (10, 25), prediabetes (27), and multiple cardiometabolic risk factors (11) have inferior bone mass, size, and strength compared with their healthier counterparts after accounting for relevant confounders such as body weight and lean mass. Additionally, obesity-related deficits in trabecular bone microarchitecture were attenuated after adjustment for HOMA-IR in sexually mature females (age 18 to 19 years) (5), implicating insulin resistance as an intermediary in the relationship between adiposity and bone. To the best of our understanding, the present study was the first to test whether the fat–bone relationship is mediated through insulin resistance using path analysis. We identified a significant negative relationship between adiposity and LS bone mass via insulin resistance. This association was evident with respect to both fat mass and waist circumference, although subtle differences were found between these two adiposity measures and the relationships were inconsistent between skeletal sites.
Our correlational analyses showed that greater adiposity and insulin resistance were associated with lower LS BMC and total body aBMD after adjusting for confounders. However, fat mass, waist circumference, and HOMA-IR did not correlate significantly with total body BMC or LS aBMD, and HOMA-IR did not mediate the relationship between adiposity and total body aBMD. The reason for these discrepancies with respect to skeletal site (LS vs total body) and measure (BMC vs aBMD) are unclear but might involve the inability of DXA to distinguish between cortical and trabecular bone compartments and the heterogeneity of our study sample. Bone area and BMC are components of aBMD, both of which change considerably throughout childhood. The participants in our study ranged in age from 7 to 15 years and from pre- to postpuberty, which might have limited the utility of aBMD in this context. Considering these discrepancies, further studies using more sensitive bone and adiposity imaging modalities are needed to confirm these findings. With respect to visceral fat, magnetic resonance imaging and computed tomography are the reference standards; however, a valid measure of visceral adiposity can now be acquired via a conventional whole body DXA scan (31). Because the latter technique has not yet been fully refined for pediatric use, we elected not to include this measure in the present study.
Earlier studies have highlighted the utility of considering pathogenic fat depots within the context of the fat–bone connection. Although relationships among whole body fat mass, BMI, and subcutaneous fat with bone parameters have been mixed, visceral fat has been a consistent negative predictor of bone mass and geometry (11, 15, 28). Most earlier studies measured visceral adiposity using computed tomography or magnetic resonance imaging; however, in the present study, we used waist circumference as an estimate of abdominal fat. Waist circumference is a good predictor of visceral adipose tissue (32) and correlates with changes in insulin resistance in children (16). However, this approach could introduce unwanted error, because waist circumference encompasses both subcutaneous and visceral fat. This is an important consideration given that both positive (15) and negative (11) relationships between subcutaneous abdominal fat and bone health have been reported. However, our results involving waist circumference are in line with those reported earlier that focused on visceral fat (11, 15, 28).
Visceral obesity is associated with an increased risk of type 2 diabetes, hypertension, and cardiovascular disease (26). Certain biological factors that contribute to disease progression have also been linked to suboptimal bone health. Proinflammatory cytokines, including C-reactive protein and tumor necrosis factor-α, modify bone turnover and are negative predictors of bone mass and structure (27, 33). Insulin-like growth factor 1 (IGF-1) is a pivotal hormone in childhood bone development and shares a downstream signaling pathway with insulin (34–36). In vivo studies have shown that proinflammatory factors, including tumor necrosis factor-α (37), mitigate IGF-1 function. Skeletal deficits have been identified in a murine model of early-onset type 2 diabetes (38), prepubertal overweight children with prediabetes (27), and adolescents with insulin resistance (10). Animal and human studies have suggested that IGF-1 might contribute to these discrepancies (10, 39).
The primary strength of the present study was our use of path analysis to test whether insulin resistance was an intermediary of the relationship between adiposity and bone mass in children. The directionality of our hypothesized path model was based on previously reported data and these data were cross-sectional; thus, causal inference would not be appropriate. Another limitation of the present study was our lack of data pertaining to bone microarchitecture. Cohen et al. (40) showed that elevated abdominal fat was associated with inferior trabecular bone stiffness, but not cortical bone width, assessed using labeled transiliac bone biopsies in premenopausal women. In the present study, adiposity and insulin resistance were negatively associated with BMC at the spine and aBMD at the whole body. These skeletal sites are composed of predominantly trabecular and cortical bone, respectively. Future studies should use more sophisticated bone imaging technologies such as high-resolution peripheral quantitative CT to assess trabecular and cortical bone microarchitecture in relation to visceral adiposity.
Conclusions
Our results suggest that insulin resistance is an intermediary in the link between adiposity and LS bone mass in children, supporting earlier findings involving insulin resistance in the connection between adolescent obesity and trabecular bone (5). However, the inconstancy of these relationships between bone measures should prompt additional work to more clearly define the complex interrelations among adiposity, metabolic health, and bone strength in children. Future studies should consider additional subclinical measures of cardiometabolic risk that are mechanistically plausible mediators of the relationship between fat and bone to identify targets for interventions aimed at optimizing cardiovascular, metabolic, and skeletal health in youth.
Abbreviations:
- aBMD
areal bone mineral density
- BMC
bone mineral content
- BMI
body mass index
- DXA
dual energy x-ray absorptiometry
- HOMA-IR
homeostasis model assessment of insulin resistance
- IGF-1
insulin-like growth factor 1
- IU
Indiana University
- LS
lumbar spine
- PU
Purdue University
- TB
total body
Acknowledgments
FinancialSupport: This trial was funded by Dairy Management, Inc. (to C.M.W.).
Current Affiliation: J. M. Kindler’s current affiliation is the Division of Gastroenterology, Hepatology and Nutrition, Children’s Hospital of Philadelphia, Philadelphia, Pennsylvania 19146.
Disclosure Summary: The authors have nothing to disclose.
