


Abstract
A somatostatin-dopamine chimera (BIM23B065) was under investigation to reduce GH secretion for the treatment of pituitary adenomas.
To determine pharmacokinetics, safety, and tolerability and to monitor hormonal changes after single and multiple subcutaneous BIM23B065 administrations.
Randomized, double-blind, placebo-controlled, parallel-group design with five single and three 13-day multiple ascending-dose cohorts.
A total of 63 healthy male white volunteers were enrolled (47 active, 16 placebo).
Pharmacokinetics, GH, prolactin (PRL), IGF-1, GH after GHRH administration, and general clinical safety criteria.
The maximum dosage of BIM23B065 administered in this study was 1.5 mg. BIM23B065 reduced the mean GH concentrations after 8 and 13 days of treatment. A decrease in GH release after GHRH administration indicated inhibition of the hypothalamic-pituitary-somatotropic axis. IGF-1 was not altered after single doses but showed a significant change from baseline after multiple dosing. PRL secretion was reduced in all subjects who were treated. Orthostatic hypotension and injection site reactions were commonly observed at high dosages. A 6-day uptitration period was included to successfully lower the cardiovascular effects in the multiple ascending dose part of the study.
Proof of pharmacology of BIM23B065 was shown by a reduction in GH, IGF-1, and PRL concentrations in healthy male volunteers, supporting activity of the somatostatin analog and dopamine agonist moieties. The safety and tolerability of the higher dosing regions was limited mainly by orthostatic hypotension.
Pituitary tumors often express somatostatin (SST) and dopamine receptors, which are major pituitary function regulators (1). Nonsurgical therapy to inhibit GH secretion consists of treatment with SST and dopamine analogs, targeting the SST2, SST5, and dopamine-2 (D2) receptors, which are specifically expressed on GH-secreting cells (2, 3). Furthermore, it has been hypothesized that interaction between SST2/5 and D2 receptors results in an enhanced functional response (4–6). This suggests a benefit from simultaneously targeting these receptors (7, 8). Indeed, a combination of SST and dopamine analogs is more effective in reducing GH levels than SST analogs alone in patients with GH-secreting SST analog–resistant adenomas (9–11). Furthermore, the combined effects are enhanced by the use of a chimeric molecule that can interact with both the SST and dopamine receptors (12, 13).
A previously developed SST-dopamine chimeric molecule (BIM-23A760) showed positive clinical results; however, an active metabolite was being formed that after multiple dosing interacted with the parent compound, after which development was halted (12, 14). As a novel treatment of GH secreting pituitary tumors, BIM26B065 was developed. BIM23B065 is a second-generation dopastatin, a chimeric dual SST-dopamine agonist compound. In vitro, BIM26B065 activates the SST2 and D2 receptors as a full agonist and the SST5 receptor as a partial agonist, comparable to octreotide. BIM23B065 shows higher potency (IC50 = 0.6 pM) and efficacy (GH inhibition = 63%) compared with octreotide (IC50 = 126.4 pM, GH inhibition = 45%) and cabergoline (IC50 = 4.6 pM, GH inhibition = 28%), given alone or in combination (IC50 = 2.9 pM, GH inhibition = 44%) in cultured human pituitary adenoma cells of patients with partially octreotide-responsive acromegaly (15). In vivo, GH secretion decreased in normal rats after stimulation with GHRH in a dose-related manner ranging from 44% to 99% inhibition (16). In vitro experiments with the main metabolite, BIM23B133, showed no binding to any of the SST receptors and no interference with the activity of BIM23B065 (14). Besides GH, it was expected that other hormones were influenced by this chimeric molecule, such as IGF-1, a downstream target of GH, and prolactin (PRL), which is inhibited by dopamine (17).
The aim of this first-in-human study was to characterize the pharmacokinetics, pharmacodynamics, safety, and tolerability, with a focus on endogenous and stimulated GH, IGF-1, and PRL, after single and multiple subcutaneous (SC) injections of BIM23B065 in healthy male volunteers.
Subjects and Methods
This was a single-center, randomized, double-blind, placebo-controlled, parallel-group study in which both single ascending doses (SADs) and multiple ascending doses (MADs) of 1 mL SC administered BIM23B065 were investigated (EudraCT number = 2014-004561-24). All subjects gave their informed consent, and the Medical Ethics Committee (BEBO Foundation, Assen, Netherlands) approved the study (NL152019.056.15), which was conducted in accordance with good clinical practice guidelines and pertinent legal requirements.
Subjects
Eligible volunteers were defined as healthy Caucasian men aged 18 to 45 years with a body mass index between 19 and 30 kg/m2. Good health was determined at a complete medical screening, and subjects were excluded in case of hypersensitivity to drugs, cholelithiasis (history or detected with ultrasound), a systolic blood pressure <110 mm Hg, or a heart rate <48 beats per minute. Drug use (including over-the-counter drugs and supplements) was not permitted within 21 days before drug administration, except for occasional use of paracetamol or ibuprofen.
Study design
Subjects in the SAD part of the study were enrolled in five cohorts. The administered dosage per cohort was 0.1, 0.4, 0.8, 1.2, and 1.5 mg. Each cohort comprised eight subjects (six BIM23B065, two placebo). For placebo, the same excipients were used without the active compound. Two subjects started per cohort as a sentinel group, and if no safety issues arose within 24 hours after dosing, the remaining six subjects were dosed. Subjects fasted up to 3 hours after dosing, were hospitalized up to 24 hours postdose, and had a follow-up visit on day 7. Once the follow-up was completed, the next ascending dose was given to the subsequent cohort after a blinded data review, according to the same procedure as in the preceding cohort.
Subjects in the MAD part of the study were enrolled in three cohorts. Subjects received 1.2 mg once daily, 0.8 mg twice daily, or 1.0 mg twice daily; twice-daily dosing was performed at 8 hour/16 hour intervals. Dosing started with a 6-day uptitration period, followed by the target dose administration for 7 days. The number of subjects per cohort and the active/placebo ratio were identical to those of the SAD part. Subjects fasted up to 3 hours after the morning dose, hospitalized for 14 days, and had a follow-up visit 7 days thereafter. Once the follow-up was completed, the next ascending dose was given to the subsequent cohort, according to the same procedure as in the preceding cohort. Injection sites were rotated for each injection in the abdominal region. The schematic clinical trial design of the SAD and MAD parts is depicted in Fig. 1.
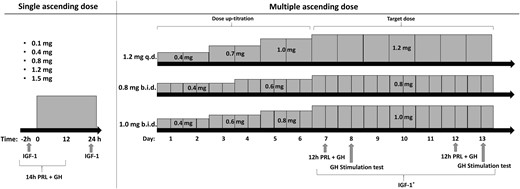
Clinical trial design for the SAD and the 13-d MAD part of the study. In the SAD part, PRL and GH were sampled from 2 h predose until 12 h postdose. IGF-1 was sampled before dosing and 24 h after dosing. In the MAD part, dosage uptitration consisted of 2 or 3 steps, after which the target dose was administered for a 7-d period. PRL and GH were sampled for 12 h (1 h predose until 11 h postdose) on days 7 and 12. A GH stimulation test was performed on days 8 and 13. IGF-1 was sampled 1 h after the morning dose on days 7 to 13. Subjects treated with placebo followed the same schedule. IGF-1* indicates once-daily sampling. b.i.d., twice-daily dosing; q.d., once-daily dosing.
Pharmacokinetics
The pharmacokinetic (PK) samples of BIM23B065 and its main metabolite, BIM23B133, were sampled from venous blood. In the SAD part, samples were taken before dosing and 0.25, 0.5, 1, 2, 3, 4, 6, 8, 12, 24, 48, and 72 hours after dosing. In the MAD part, samples were taken before and 0.5 hours after dosing on days 7, 11, and 12. Additionally, on the last dosing day, samples were collected before dosing and 0.5, 1, 2, 4, 6, 8, 12, 24, 48, and 72 hours after daily dosing. For twice-daily dosing cohorts, sampling took place on the last dosing day before dosing and at 0.5, 1, 2, 4, 6, 8 (predose for second dosing), 8.5, 9, 10, 12, 22, 32, 48, and 72 hours after the morning dose. PK parameters were calculated by noncompartmental analyses. A nonlinear power model was used to assess dose proportionality.
Pharmacodynamics
For the pharmacodynamic (PD) assessments, the levels of GH, PRL, IGF-1, ACTH, cortisol, TSH, FSH, and LH were determined. In the SAD part, the GH, PRL, and cortisol sampling was performed from 2 hours before dosing up to 12 hours after dosing at 20-minute intervals (including t = 0), except in the first hour after dosing, when sampling followed the PK sampling schedule. IGF-1 and ACTH were assessed before and 24 hours after dosing. In the MAD part, the 12-hour GH, PRL, and cortisol samples were taken both on day 7 and day 12, from 1 hour before the morning dose up to 11 hours after at 20-minute intervals. In addition, a GH stimulation test was executed by 1 µg/kg IV GHRH administration (Somatorelin, Ferring) 1 hour after dosing on days 8 and 13. The GH concentrations were determined before GHRH injection and 0.5, 1, 1.5, 2, and 2.5 hours thereafter. For each day during the target dosing period, IGF-1 was determined 1 hour after dosing. ACTH, TSH, FSH, and LH were determined once before the first and last dose.
An exploratory statistical analysis of the pharmacodynamic effects was performed by comparing the mean or area under the curve (AUC) of the endogenous GH, stimulated GH, and PRL secretion, and the mean of the IGF-1 change from baseline during the target dose period with the placebo cohort with an unpaired t test.
Safety
Safety assessment included recording of serious treatment-emergent adverse events (TEAEs), physical examination including local tolerability, vital signs, ECG, gallbladder ultrasound, urinalysis, and hematology tests (including coagulation and biochemistry) on day 14 in the MAD part. AEs were coded according to the Medical Dictionary for Regulatory Activities version 18.
Assay information
The BIM23B065 and BIM23B133 plasma concentrations were measured with a validated HPLC tandem mass spectrometry method [lower limit of quantification (LLOQ) = 0.1 ng/mL]. GH analysis was performed with the Immulite 2000 assay (World Health Organization International Standard 98/574), and IGF-1 was analyzed with the IDS-iSYS IGF-1 Assay (World Health Organization International Standard 02/254). Prolactin was analyzed with a two-step immunoassay (Architect prolactin assay).
Results
Subjects
The subject characteristics for all placebo and active treated subjects in the SAD and MAD parts of the study are summarized in Table 1. In the SAD part, one subject was diagnosed with a non–clinically significant diastolic murmur before randomization, and he withdrew consent and was not replaced. One subject in the placebo group withdrew 5 hours after dosing because of a predose headache that did not resolve. In the MAD part, two subjects receiving BIM23B065 1.0 mg twice daily were withdrawn by the investigator, one because of orthostatic hypotension, the other because of increases in serum amylase and lipase, which will be discussed later.
Characteristics of Subjects Treated With Placebo and BIM23B065
| Placebo (n = 16) | BIM23B065-Treated SAD (n = 29) | BIM23B065-Treated MAD (n = 18) | |
|---|---|---|---|
| Age, y | 23.1 (4.0) [18–33] | 24.0 (5.9) [19–44] | 23.7 (5.8) [18–40] |
| Weight, kg | 78.0 (10.3) [61.2–99.9] | 79.4 (9.8) [61.7–96.2] | 76.2 (12.3) [53.3–101.5] |
| Body mass index, kg/m2 | 22.6 (2.3) [19.1–26.5] | 23.6 (2.3) [20.0–27.7] | 23.0 (2.9) [19.1–29.1] |
| Height, m | 1.86 (0.06) [1.78–1.96] | 1.83 (0.06) [1.71–1.96] | 1.82 (0.07) [1.67–1.97] |
Data are presented as mean (SD) [minimum-maximum].
Pharmacokinetics
A summary of the noncompartmental analysis of the PK profiles can be found in Table 2 for the SAD part and in Table 3 for the MAD part. Considering the subcutaneous dosing, a fast absorption of BIM23B065 was observed, with observed time of maximal plasma concentration (tmax) consistently reached between 0.25 and 0.5 hours for all doses. The plasma concentrations of BIM23B133 peaked later, ranging from 2.5 to 6 hours after dose administration.
Summary of PK Parameters of BIM23B065 and BIM23B133 for the SAD Cohorts
| Parameter | BIM23B065 | BIM23B133 | ||||||||
|---|---|---|---|---|---|---|---|---|---|---|
| 0.1 mg (n = 6) | 0.4 mg (n = 5) | 0.8 mg (n =6) | 1.2 mg (n = 5) | 1.5 mg (n = 6) | 0.1 mg (n = 6) | 0.4 mg (n = 5) | 0.8 mg (n = 6) | 1.2 mg (n = 5) | 1.5 mg (n = 6) | |
| Cmax, ng/mL | 0.7 (52.9) | 4.7 (25.3) | 8.1 (37.6) | 10.7 (40.9 | 19.4 (13.1) | 0.50 (29.5) | 2.42 (20.8) | 2.95 (47.1) | 3.94 (45.7) | 6.36 (22.9) |
| tmax, ha | 0.25 (0.25, 0.48) | 0.25 (0.23, 0.50) | 0.50 (0.25, 0.52) | 0.50 (0.25, 0.50) | 0.27 (0.25, 0.50) | 3.51 (2.00, 4.03) | 3.02 (1.00, 4.02) | 2.50 (2.00, 6.00) | 6.00 (2.00, 8.02) | 3.01 (2.02, 4.00) |
| AUC0-t, h·ng/mL | 0.58 (54.5) | 4.53 (24.2) | 12.4 (28.4) | 19.5 (35.5) | 32.0 (22.2) | 4.0 (62.4) | 18.3 (22.3) | 34.8 (20.5) | 52.4 (25.9) | 80.7 (10.4) |
| AUC0-∞, h·ng/mL | 0.63 (48.7) | 4.61 (24.6) | 12.8 (28.7) | 19.8 (35.0) | 32.5 (22.3) | 4.3 (61.6) | 18.6 (22.6) | 35.6 (19.3) | 53.4 (25.0) | 84.3 (8.9) |
| t1/2, h | 0.64 (31.9) | 0.93 (87.4) | 5.36 (106) | 4.42 (95.3) | 6.85 (50.9) | 3.73 (51.0) | 4.53 (43.2) | 10.1 (70.1) | 12.3 (49.6) | 18.0 (40.4) |
Data are presented as the geometric means (% coefficient of variation).
Abbreviations: AUC0-∞, area under the plasma concentration-time curve from time 0 to infinity; AUC0-t, area under the plasma concentration-time curve from 0 hours to last measurable concentration.
Median (minimum, maximum) presented for tmax.
Summary of PK Parameters of BIM23B065 and BIM23B133 During the Last Day of Dosing for the MAD Cohorts
| Parameter | BIM23B065 | BIM23B133 | |||||
|---|---|---|---|---|---|---|---|
| 1.2 mg q.d. (n = 6) | 0.8 mg b.i.d. (n = 6) | 1.0 mg b.i.d. (n = 3) | 1.2 mg q.d. (n = 6) | 0.8 mg b.i.d. (n = 6) | 1.0 mg b.i.d. (n = 3) | ||
| Cmax, ng/mL | Post morning dose | 11.6 (14.9) | 7.8 (23.9) | 8.1 (32.2) | 3.5 (36.8) | 4.6 (32.3) | 3.5 (8.6) |
| Post evening dose at 8 h | — | 7.9 (39.6) | 10.8 (12.3) | — | 5.0 (11.8) | 5.9 (26.5) | |
| tmax, ha | Post morning dose | 0.51 (0.50, 0.55) | 0.50 (0.50, 0.50) | 0.50 (0.50, 0.52) | 3.01 (2.00, 4.02) | 2.00 (0.97, 6.00) | 4.00 (4.00, 6.00) |
| Post evening dose at 8 h | — | 8.50 (8.50, 8.50) | 8.50 (8.50, 8.50) | — | 12.0 (10.0, 12.0) | 12.0 (12.0, 12.0) | |
| AUC0-t, h·ng/mL | 30.1 (16.7) | 25.9 (29.1) | 41.2 (3.8) | 66.0 (20.3) | 118 (20.2) | 121 (6.0) | |
| AUC0-∞, h·ng/mL | 31.1 (16.9) | 26.2 (28.6) | 42.3 (4.3) | 79.5 (19.5) | 140 (22.6) | 146 (17.3) | |
| t1/2, h | 13.4 (70.9) | 4.69 (68.0) | 12.4 (142) | 29.1 (38.7) | 31.9 (38.9) | 28.8 (41.8) | |
Data are presented as the geometric means (% coefficient of variation).
Abbreviations: AUC0-∞, area under the plasma concentration-time curve from time 0 to infinity; AUC0-t, area under the plasma concentration-time curve from 0 hours to last measurable concentration; b.i.d., twice-daily dosing; q.d., once-daily dosing.
Median (minimum, maximum) presented for tmax.
The apparent maximal plasma concentration (Cmax) reached during single doses varied from 0.7 ng/mL for a 0.1-mg dose to 19.4 ng/mL for 1.5 mg. No strong accumulation of BIM23B065 after 13 days of dosing could be observed. The Cmax of BIM23B065 in both the 1.2 mg daily and 0.8 mg twice-daily cohorts were comparable to those of similar single doses. An increase in Cmax after the evening dose was observed in the 1.0-mg twice-daily cohort, in which Cmax increased by 33% from 8.1 to 10.8 ng/mL. The Cmax of BIM23B133 in the 0.8-mg twice-daily cohort increased from 2.95 to 4.6 ng/mL, compared with the 0.8-mg single-dose cohort.
In the SAD part, the apparent elimination half-life (t1/2) of BIM23B065 ranged between 4.4 and 6.9 hours for doses of 0.8 mg and higher. After multiple dosing, the t1/2 was more variable between the dosing regimens, with half-lives ranging from 4.7 to 13.4. In general, high coefficients of variation (>30%) on this parameter were observed. The t1/2 of BIM23B133 was longer than for BIM23B065, with a mean t1/2 of 3.7 to 18 hours in the SAD and 29 to 32 hours in the MAD part.
A more than dose-proportional increase in the AUC from 0 to infinity of BIM23B065 was observed in the SAD part, according to a nonlinear power model, which indicated possible nonlinearity in the pharmacokinetics of BIM23B065. This was confirmed in a population PK analysis, where the pharmacokinetics of BIM23B065 and BIM23B133 were best described with two-compartment models with both linear and nonlinear elimination for BIM23B065 and first-order elimination for BIM23B133 (reported separately).
Pharmacodynamics
Endogenous GH secretion
A high percentage of the observations were below the LLOQ in the 12-hour GH profiles (20% of placebo data, 45% of active data). Therefore, data below the LLOQ were fixed to the LLOQ of 0.05 ng/mL for calculation of the summary statistics. Figure 2A shows the mean GH levels after dosing of BIM23B065 for the observation period after dosing of all cohorts. No change from placebo was observed in the 0.1- and 0.4-mg cohorts. The 0.8-mg (P = 0.02) and 1.2-mg cohorts (P = 0.005) show a significant reduction in GH secretion, whereas GH levels are increased again in the 1.5-mg cohort. The prolonged exposure to BIM23B065 in the MAD cohorts gave a clear reduction in the GH concentrations for all the daily and twice-daily cohorts (P < 0.05), except for the 1.2 mg daily dosing on day 12 (P = 0.24).
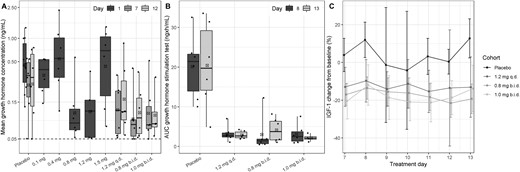
Box-and-whisker plot of the (A) mean GH concentrations after BIM23B065 dosing per cohort for days 1, 7, and 12. (B) AUC of GH response during the GH stimulation test (up to 2.5 h after the GHRH dose) per cohort on days 8 and 13. (C) Percentage mean ± SD change from baseline in IGF-1 concentrations over time during the 7-d target dose period (days 7 to 13). Day 1 represents data from subjects in the single ascending dose part of the study. Horizontal black line in boxes indicates median; crossed black box indicates mean; boxes indicate 25%–75% interval; whisker indicates range; solid dots indicate individual data; dashed horizontal line indicates lower limit of quantification. b.i.d., twice-daily dosing; q.d., once-daily dosing.
GH stimulation test
After GH stimulation with GHRH, a clear difference between the GH secretion of subjects treated with placebo and the GH secretion of subjects treated with BIM23B065 was observed, on days 8 and 13 (Fig. 2B). In the placebo group, the mean ± SD AUC0–2.5h was 20.12 ± 8.27 ng × h/mL and 20.41 ± 10.97 ng × h/mL, respectively. After BIM23B065 administration, the AUC0–2.5h was lower, and the median AUC between cohorts ranged on days 8 and 13 between 1.46 and 2.74 ng × h/mL (P < 0.001) and between 2.09 and 3.74 ng × h/mL (P < 0.001), respectively. No significant differences between active treated cohorts were identified. The same pattern was noted for the maximal GH concentration reached (data not shown). No dose-response relationship could be discerned between the received BIM23B065 dosage and the GH exposure after GHRH administration.
IGF-1
No changes in IGF-1 were observed in the SAD part of the study. However, a reduction in the IGF-1 concentrations was observed during the MAD part of the study, in which the maximal decrease from baseline was already achieved on the first day of the target dose (Fig. 2C). The percentage change from baseline was calculated to correct for the natural variability in IGF-1 with age and allow better comparison between individuals. In general, the placebo observations showed a broad scatter with high SDs, indicating that there is a high level of day-to-day variability in healthy male volunteers. On average, subjects treated with placebo showed a 3.82% ± 17.8% increase from baseline. The 1.2 mg daily, 0.8 mg twice daily, and 1.0 mg twice daily cohorts showed significant reductions (P < 0.001) of −12.9% ± 15.0%, −17.3% ± 7.1%, and −18% ± 10.1% from placebo, respectively.
Prolactin
The AUC of the endogenous PRL profiles showed wide variability in the placebo cohort between days 1, 7, and 12 (Fig. 3A). None of the SAD cohorts showed a significant reduction. However, both twice-daily dosing cohorts in the MAD part of the study showed a significant reduction of the AUC (P < 0.05). The inhibitory effect of BIM23B065 on PRL could best be observed in the concentration-time profiles, where a fast decline in the PRL concentrations after dose administration was identified in all cohorts (Fig. 3B, 3C). In the SAD part, the largest reduction from baseline was reported after a dose of 1.5 mg (mean: −6.61 ng/mL at 1.7 hours after dosing) (Fig. 3B). All cohorts in the SAD part showed decreased mean PRL concentrations until 5 hours after dose administration. In the MAD part, similar decreases can be observed in the three cohorts after the morning dose on day 12 (Fig. 3C). Furthermore, the evening dose resulted in large reductions in the PRL concentrations as well. Additional population PK and PD analysis has been performed that quantified a significant maximal inhibition of 91% in PRL secretion (EC50 = 1.27 ng/mL) by BIM23B065.
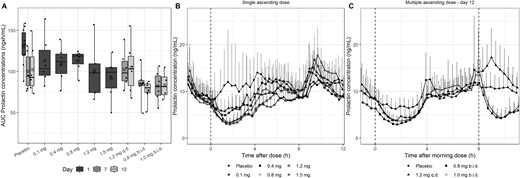
(A) Box-and-whisker plot of the AUC of PRL after BIM23B065 dosing per cohort for days 1, 7, and 12. (B) PRL mean and upper SD over time after dose for all single ascending-dose cohorts. (C) PRL mean + upper SD over time after morning dose for all multiple ascending-dose cohorts on day 12. Day 1 represents data from subjects in the single ascending dose part of the study. Horizontal black line in boxes indicates median; crossed black box indicates mean; boxes indicate 25%–75% interval; whisker indicates range; solid dots indicate individual data; vertical dashed line at 0 h indicates time of dose administration for all cohorts; vertical dashed line at 8 h indicates second dose administration of 0.8 mg and 1.0 mg b.i.d. cohorts. b.i.d., twice-daily dosing; q.d., once-daily dosing.
No effects were evident on ACTH, cortisol, TSH, FSH, or LH concentrations after single or multiple doses of BIM23B065 when compared with placebo.
Safety and tolerability
The TEAE incidence increased with higher total daily exposure of BIM23B065 (Table 4). The most common TEAEs in both parts of the study were injection site reactions, hypotension, and gastrointestinal (GI) disorders. Other less common but noteworthy TEAEs occurred in multiple biochemical parameters and are described in more detail below.
Summary of TEAEs per Cohort
| TEAE | SAD | MAD | ||||||||
|---|---|---|---|---|---|---|---|---|---|---|
| Placebo (n = 10) | 0.1 mg (n = 6) | 0.4 mg (n = 6) | 0.8 mg (n = 6) | 1.2 mg (n = 5) | 1.5 mg (n = 6) | Placebo (n = 6) | 1.2 mg q.d. (n = 6) | 0.8 mg b.i.d. (n = 6) | 1.0 mg b.i.d. (n = 6) | |
| Injection site reactions | 5 | 3 | 6 | 6 | 5 | 6 | 5 | 6 | 6 | 6 |
| Dizziness | 1 | 1 | — | 2 | 1 | 4 | 1 | 4 | 2 | 3 |
| (Orthostatic) hypotension | — | 2 | 1 | 2 | — | 3 | 4 | 6 | 5 | 5 |
| Abdominal complaints | — | — | — | 1 | — | — | 1 | 2 | 5 | 5 |
| Nausea | — | — | — | 1 | — | 2 | 1 | 3 | 4 | 4 |
| Vomiting | — | — | — | — | — | — | — | — | 1 | 1 |
Presented are the numbers of subjects per treatment who experienced a specific TEAE.
Abbreviations: b.i.d., twice-daily dosing; q.d., once-daily dosing.
Injection site
Injection site reactions were present at all dosage levels in both parts of the study, both in active subjects and subjects treated with placebo. These reactions were transient and accompanied by swelling and pruritus. At higher dosages, a typical reaction was observed as erythema (diameter 4 to 5 cm) spreading outward and resolving within 2 hours after dosing. Two subjects in the MAD part (one on 1.2 mg daily, one on 1.0 mg twice daily) experienced a single recurrence of the reaction that resolved without sequelae. All injection site reactions were of mild intensity, and none was considered to be a dose-limiting toxicity.
Cardiovascular
Hypotension occurred frequently after dosing in both parts of the study. In the SAD part, 28% of subjects had orthostatic hypotension after receiving the active dose. Although we could not discern a clear dose-response relationship, decreases in blood pressure predominantly were asymptomatic after lower dosages (0.1 to 0.4 mg). After the 1.5-mg dose, one subject had a vasovagal syncope and three subjects had symptomatic orthostatic hypotension. Therefore, no dosages higher than 1.5 mg were investigated. In the MAD part, 50% of the dosed subjects had symptomatic hypotension, without a clear reduction in the effect after repeated dosing. After the 1.2 mg daily dose, blood pressure was lower for dosed subjects than it was for subjects receiving placebo. After the first full morning dose of 0.8 and 1.0 mg twice daily, standing systolic pressure decreased compared with placebo and recovered before the evening dose. This was more evident in subjects receiving 1.0 mg twice daily. One subject (receiving 1.0 mg twice daily) was withdrawn because of orthostatic hypotension (Δ systolic blood pressure = −29 mm Hg, 25 minutes after the morning dose). Supine and standing heart rates dropped with all doses in the MAD part, with the greatest reduction after the 1.0 mg twice-daily dose.
Gastrointestinal
The incidence of GI adverse events was higher after multiple days of dosing compared with the SAD part. In the SAD part, one and two subjects had GI complaints after the 0.8 and 1.5 mg dose, respectively. However, during the MAD part, six GI adverse events were reported in five subjects after 1.2 mg daily, 14 events were reported in six subjects after 0.8 mg twice daily, and 10 events were reported in five subjects after 1.0 mg twice daily. Most subjects on the daily regimen experienced the events after dosing in the morning. During the twice-daily regimen, most subjects experienced abdominal discomfort, especially after the evening dose and less often after the morning dose.
Biochemistry
A few TEAEs occurred in the routine laboratory parameters. In one subject, receiving 1.0 mg twice daily, leukopenia or neutropenia was observed after completion of the treatment period. Neither neutropenia nor leukopenia was associated with clinical symptoms, and values returned to normal 4 weeks after the last dose. Isolated increases in alanine transaminase (ALT) were observed in all dosing groups and placebo, but these were not accompanied by increases in aspartate aminotransferase (AST) and bilirubin. A single subject was withdrawn because of an increase in amylase to 126 IU/L (normal range, 0 to 107 U/L) and lipase to 120 IU/L (normal range, 13 to 60 U/L) observed after receiving the target dose level of 1.0 mg twice daily for 5 days. Importantly, there were no accompanying abdominal complaints, there were no increases in ALT, AST, and bilirubin, and abdominal ultrasound did not show abnormalities of the gallbladder, the biliary or intrahepatic ducts, or the pancreas. The amylase and lipase values of this subject returned to normal at the final visit. For all other safety parameters (hematology, coagulation, and chemistry) we observed no discernible trends and no differences between active subjects and subjects treated with placebo.
Discussion
This first-in-human study showed proof of pharmacology of BIM23B065 in healthy male volunteers by reducing GH, IGF-1, and PRL concentrations and determined the maximal administrable dosage. The safety and tolerability in the high dosing regimens was limited by cardiovascular effects, specifically orthostatic hypotension.
The pharmacokinetics of BIM23B065 were studied in both the single and multiple ascending dose parts of the study. There was a fast absorption of BIM23B05 with a highly variable half-life. The estimation of a short t1/2 (<1 hour) in the lowest doses of the SAD part may be the result of disposition of BIM23B065 to a peripheral compartment that could not be identified by noncompartmental analysis. Furthermore, the t1/2 of BIM23B133 showed differences between the SAD and MAD cohorts in the study, indicating that the elimination of BIM23B133 may be reduced after multiple dosing.
In Fig. 2A, a dose-response relationship is observed in which increasing dosages of BIM23B065 inhibit GH, with the highest level of inhibition after multiple days of dosing, regardless of the dosing regimen used. However, this relationship is distorted by the high mean 12-hour GH levels in the 1.5-mg cohort. On further exploration of the individual concentration-time profiles in this cohort (data not shown), a clear reduction in the GH levels between 2 and 6 hours after dosing was observed, with GH levels returning to a highly pulsatile secretion pattern quickly thereafter. The high variability in pulse amplitude and frequency between individuals and extrinsic factors stimulating GH secretion (e.g., stress, blood glucose, ghrelin) could have caused the distorted GH response in this cohort (18). The quantification of a concentration-effect relationship on the endogenous GH secretion could further improve decision making compared with the use of summary statistics (19). This study observed endogenous GH secretion during the day; however, peak GH levels are normally reached during sleep (20). Investigating the impact of GH inhibition by BIM23B065 on a full 24-hour profile is warranted and perhaps should be combined with a change in dosing time from morning to evening.
The inhibition of endogenous GH results in a downstream effect on IGF-1. However, no effect was observed in the SAD cohorts. After multiple days of dosing, the maximal inhibition in the IGF-1 concentrations was already achieved on the first day of the target dose, at which a >15% decrease from baseline was observed, with a clear overlap in IGF-1 concentrations between active treated cohorts. A striking observation was the high level of variability in IGF-1 in healthy male subjects treated with placebo (3.82% ± 17.8% change from baseline), because IGF-1 is the most commonly used, and assumed to be stable, marker to assess the efficacy of treatment in a clinical setting (21, 22). In future clinical development, especially in patients, a power analysis should be performed to determine appropriate sample sizes, because outcomes can be more variable than in healthy volunteers and the patient population is more heterogeneous.
In the GH stimulation test, the lowest tested dosage of BIM23B065 (0.8 mg twice daily) already resulted in the maximal reduction in stimulated GH secretion, indicating adequate inhibition of the hypothalamic-pituitary-somatotropic axis by this dosage. This indicates that therapeutic dosages <0.8 mg twice daily should be further investigated in clinical trials to be able to quantify the dose-response relationship of BIM23B065 for stimulated GH secretion.
PRL secretion decreased after dose administration; however, no clear effect on the AUC was observed in the SAD cohorts. This result may be due to the short effect of BIM23B065 on PRL secretion (~5 out of 12 hours) and the generally higher PRL concentrations in the evening. The duration of the effect is doubled in the twice-daily dosing cohorts, where BIM23B065 showed significant inhibition of PRL secretion after the morning and afternoon doses.
A well-recognized phenomenon of treatment with dopamine agonists, such as cabergoline and bromocriptine, is the blood pressure–lowering effects (23–25). These effects are commonly monitored in clinical practice by uptitration of the dosage (25), which also reduced the severity of the orthostatic hypotension of BIM23B065 in this study. Therefore, if this compound were to progress through the clinical development phases, the use of uptitration is recommended to counter the hypotensive effects of the dopamine moiety. An additional cardiovascular effect is the reduction in heart rate, caused by binding to SST receptors located in presynaptic nerve endings of the vagus nerve. Therefore, treatment with SST analogs (e.g., octreotide) are known to cause a significant decrease in heart rate in patients with acromegaly (26, 27).
The finding that BIM23B065 could suppress endogenous GH, stimulated GH, IGF-1, and prolactin secretion is a major step in dopastatin development. A previously promising developmental compound, BIM23A760, did not affect GH levels after multiple dosing because its metabolite interfered with the activity of the parent molecule (12, 14). The current findings show that the metabolite of BIM23B05 did not interfere with the effect on endogenous GH, stimulated GH, IGF-1, and prolactin after 13 days of treatment. This study showed proof of pharmacology of BIM23B065, because the PD effects supported activity of the SST analog by reducing GH secretion and the dopamine agonist by reducing PRL secretion.
Abbreviations:
- ALT
alanine transaminase
- AST
aspartate aminotransferase
- AUC
area under the curve
- Cmax
apparent maximal plasma concentration
- D2
dopamine-2
- GI
gastrointestinal
- LLOQ
lower limit of quantification
- MAD
multiple ascending dose
- PD
pharmacodynamic
- PK
pharmacokinetic
- PRL
prolactin
- SAD
single ascending dose
- SC
subcutaneously
- SST
somatostatin
- t1/2
apparent elimination half-life
- TEAE
treatment-emergent adverse event
- tmax
observed time of maximal plasma concentration
Acknowledgments
Financial Support: This study was funded by Ipsen.
Clinical Trial Information: EudraCT no. 2014-004561-24 (registered 16 October 2014).
Disclosure Summary: L.P. is employed by Ipsen. I.P. was previously employed by Ipsen. The remaining authors have nothing to disclose.
References
Author notes
W.M.I.d.B. and M.J.v.E. are co-first authors.
