


Abstract
Our previous study demonstrated that the expression of long noncoding RNA (lncRNA) H19 was frequently downregulated in human primary pituitary adenomas and negatively correlated with tumor progression. However, the role of exosomal lncRNA H19 in the inhibition of pituitary tumor growth remains unclear.
To investigate whether exosomal H19 could be transported across the cell membrane to exert its inhibitory effect on pituitary tumor growth.
Empty lentivirus GH3 cells with or without H19 overexpression were used to establish a xenograft model. Isolated exosomes were identified by transmission electron microscopy, nanoparticle tracking, and Western blotting. The expression levels of serum exosomal H19 from 200 healthy subjects and 206 patients with various subtypes of pituitary tumors were detected by ultracentrifugation and quantitative real-time PCR.
The growth of distal tumor cells was inhibited by transferring exosomal H19, which could be transported through cell membrane and exert its inhibitory effect. Cabergoline increased H19 expression and played a synergic therapeutic effect with exosomal H19. Exosomal H19 inhibited phosphorylation of the mTORC1 substrate 4E-BP1. Of note, the expression level of exosomal H19 in the patients with all subtypes of pituitary tumors was significantly lower than that in the healthy subjects. The change of plasma exosomal H19 level may be correlated with the prognosis or drug response of the patients.
Exosomal H19 inhibits the growth of distal pituitary tumors through inhibiting 4E-BP1 phosphorylation. Plasma exosomal H19 may serve as an important biomarker for predicting medical responses of patients with prolactinomas.
Pituitary adenoma (PA) is a common intracranial tumor, accounting for ∼25% of all primary intracranial tumors. Prolactinoma is the most common subtype of functional PA (1). Dopaminatic agonists (DAs), including bromocriptine (BRC) and cabergoline (CAB), represent the mainstay of clinical treatment of prolactinomas, as it can decrease the serum prolactin level to the normal range and shrink the tumor size markedly in 80% to 90% patients (2–4). However, there are still 10% to 20% of patients with prolactinomas who fail to respond to DA therapies (2, 5). Treatment of these drug-resistant patients is a clinical challenge, because surgery or stereotactic radiotherapy is unable to control prolactin satisfactorily in some of these patients. Therefore, exploration of the drug resistance mechanisms and novel therapeutic targets for prolactinoma is very important and needs to be tackled urgently.
Exosomes are small extracellular vesicles with a diameter of 30 to 150 nm. They are secretory vesicles containing cytoplasmic proteins and RNA with phospholipid bilayers. Exosomes exist almost in all eukaryotes and prokaryotes, where they serve as a means of short- or long-distance intercellular communication (6, 7). Working as a transport vehicle, exosomes help forming a complex network by connecting tumor cells in the tumor microenvironment and playing an important role in this network (8). For instance, exosomes can promote tumor progression, inhibit apoptosis, help in immune escape of tumor cells, stimulate tumor angiogenesis, and transfer genetic material (9–12). Recent studies have demonstrated that exosome release may play an important role in chemotherapy resistance of tumor cells by mediating transfer of drugs, nucleic acids, and proteins (7, 13–15). However, the role of exosomes in medical treatment of PAs remains unclear.
Recently, we have found that the expression of long noncoding RNA (lncRNA) H19 was decreased in PAs, and H19 overexpression could markedly inhibit the growth of pituitary tumor cells. Additionally, H19 inhibited the phosphorylation of 4E-BP1 by preventing it from combining with Raptor (16). During the process of conducting the experiment, we accidentally noticed that lncRNA H19 overexpression could inhibit the growth of remote xenograft tumors. However, the effect of exosomal lncRNA H19 on pituitary tumors has not been reported despite some recent reports about exosomal lncRNA H19 (13–15). Thus, we want to investigate whether exosomal lncRNA H19 could be transported across the cell membrane to exert its inhibitory effect on pituitary tumor growth.
In this study, we further detected the expression level of exosomal lncRNA H19 in the plasma of 206 patients with pituitary tumors and found that the prognostic outcome of medically treated patients with prolactinoma was significantly correlated with the change of exosomal lncRNA H19 level, and that CAB could increase the expression level of H19, exhibiting a synergic therapeutic effect with exosomal lncRNA H19.
Methods
Cell culture
The GH3 cell line was purchased from the American Type Culture Collection (CCL-82.1TM) without mycoplasma contamination (tested by a Mycoplasma stain assay kit, Beyotime, Beijing, China, catalog no. C0296). GH3 cells were cultured in DMEM (Gibco™, 11965-118) supplemented with 10% (v/v) fetal bovine serum, 100 U/mL penicillin, and 100 μg/mL streptomycin (Gibco™, 15140122).
H19 overexpression adenovirus packaging
H19 was subcloned into a pShuttle vector (Clonetech Laboratories, Mountain View, CA) using EasyFusion Assembly Master Mix (New Cell & Molecular Biotech, Suzhou, China). The resulting H19 expression cassette was then cloned into the E1-deleted region of human adenovirus AdHu5 using I-CeuI and PI-SceI. Following PacI linearization, the recombinant construct was then transferred into HEK293 cells (American Type Culture Collection) for adenovirus packaging. Rescued AdHu5-expressing H19 adenovirus was expended from HEK293 cells and purified by cesium chloride density gradient centrifugation. Viral particle numbers were measured by spectrophotometry. Adhu5-empty with no insertion in the E1-deleted region was used as the control virus. The adenovirus was obtained from Shanghai Pasteur Institute, Chinese Academy of Sciences (Shanghai, China).
Xenograft animals model
All animal work was approved by the Animal Care Committee of Shanghai Jiao Tong University School of Medicine in accordance with the Institutional Animal Care and Use Committee guidelines, and was performed in accordance with the National Institutes of Health Guide for the Care and Use of Laboratory Animals. The number of approval of the animal studies is SCXK 2013-0018. Six-week-old nu/nu athymic female mice were purchased from Shanghai Slack Laboratory Animal Co. (Shanghai, China) and kept under specific pathogen-free conditions. One million normal GH3 cells, H19-overexpressing cells, or empty lentivirus GH3 cells were mixed in normal saline and injected subcutaneously into the nude mice. Xenograft volumes were evaluated by caliper measurements of two perpendicular diameters and calculated individually using the formula volume = a × b2/2, where a represents the length and b represents the width. Weights of the mice and tumor dimensions were measured every other day. After 14 days, all of the mice were euthanized, tumors were harvested and photographed, and proteins extracted from tumors were analyzed by Western blot.
For the exosome treatment model, the conditioned medium from the H19-overexpressing GH3 cells was collected, and the exosomes were centrifuged by ultracentrifugation and then dissolved in PBS, after which 1 × 10⁶ GH3 cells per mouse were used to establish xenografts. Then, the mice were randomly divided into two groups: a control group and a H19+ group. Exosomes (100 µg of total protein in volume of 100 μL) were injected twice a week via the tail vein. The tumor volume was calculated as described above.
Gene silencing
Cells were transfected with 100 nM nontargeting short hairpin RNA using Lipofectamine RNA iMAX transfection reagent (catalog no. 13778-075, Invitrogen, Carlsbad, CA), in accordance with the manufacturer’s instructions, for 72 hours. The target sequences are listed in an online repository (17).
Cell proliferation assays
Cells were seeded in 96-well plates at a density of 5000 cells in triplicate. After 24, 48, 72, and 96 hour, the number of viable cells was measured with a CellTiter-Glo luminescence cell viability assay (G3588, Promega, Madison, WI). Upon addition of MTS solution, the plate was incubated at 37°C for 1 to 4 hours, and the absorbance at 490 nm was determined with a plate reader (Tecan, Männedorf, Switzerland).
Colony formation assay
Cells were seeded in six-well plates (500 cells per well), cultured for 2 weeks, fixed in 4% paraformaldehyde, and stained with 1% crystal violet staining solution (E607309-0100, Sangon Biotech, Shanghai, China) for 15 minutes at room temperature. The plates were photographed after extensive washing and air drying.
RNA extraction and quantitative real-time PCR
Total RNA was purified from cells using TRIzol reagent (catalog no. 15596018, Invitrogen) according to the manufacturer’s instructions. The RNA concentration was assessed with a NanoDrop 1000 spectrophotometer. An equal amount of RNA (500 ng) was reverse transcribed using a cDNA synthesis kit (RT 036A, Takara Bio, Shiga, Japan). Diluted cDNAs (1:5 final) were subjected to quantitative PCR analysis using SYBR Green Supermix reagent (catalog no. AB1285B, Invitrogen). The quantitative real-time-PCR (qRT-PCR) primers are listed in an online repository (17).
Exosome isolation
Exosomes were collected by serial ultracentrifugation. Briefly, GH3 cells were cultured in DMEM supplemented with 10% exosome-depleted fetal bovine serum for 48 hours, and culture supernatants were collected. For exosome isolation, the debris and apoptotic bodies in the supernatants were removed first by centrifugation at 2000 × g (10 minutes) and 10,000 × g (30 minutes). Then, the supernatants were collected and ultracentrifuged at 110,000 × g for 70 minutes. Afterward, the exosomes were washed with sterilized PBS and purified by centrifugation at 110,000 × g for 1 hour. Subsequently, the exosomes were resuspended in PBS and filtered through 0.22-μm filters (C8848, Millipore, Boston, MA). The exosome pellets were resuspended in PBS or serum-free medium for analysis or experiments and stored at −80°C.
Electron microscopic analysis of exosomes
The exosomal morphology was examined by transmission electron microscopy (TEM) using negative staining (JEM-2100, JEOL, Tokyo, Japan). A drop of exosome suspension (∼10 μL) was incubated on a copper grid for 1 minute, dried at 65°C, and observed using an HT7700 TEM equipped and operated at an acceleration voltage of 80 kV. Images were acquired using a charge-coupled device (Gatan, Pleasanton, CA).
Nanoparticle tracking analysis
Purified exosomes were resuspended in 100 μL of 0.22-μm-filtered PBS. The particle size and concentration of exosomes were determined by nanoparticle tracking analysis (NTA) in accordance with the manufacturer's instructions (Shanghai XP Biomed, Shanghai, China) and the data were analyzed using NTA 3.0 software. Each sample was independently analyzed three times.
Immunofluorescence assays
For exosome tracking, GH3 cells were infected with a lentiviral construct encoding CD63–enhanced green fluorescent protein (EGFP) fusion protein (Shanghai Biomedical Technology Co., Shanghai, China). Cultured GH3 cells were fixed in 4% paraformaldehyde for 5 minutes at room temperature. 4′,6-Diamidino-2-phenylindole staining was performed at room temperature for 10 minutes at the concentration of 1 μg/mL. After three washes with PBS, cells were mounted (S3023, Dako Glostrup, Denmark) and observed by the Cell Observer microscopy system (Zeiss Oberkochen, Germany).
Immunoblot analysis
Cells were normally lysed in cell lysis buffer [50 mM Tris (pH 7.5), 120 mM NaCl, 0.5% Nonidet P-40, containing protease and phosphatase inhibitors]. The total protein concentrations of whole-cell lysates were measured with a Supermax i3 spectrophotometer using Bio-Rad protein assay reagent. The same amount of whole-cell lysates was subjected to SDS-PAGE and immunoblotted with the indicated antibodies. Images were developed using an LAS 4000 system (GE Healthcare). The antibody information is listed in an online repository (17).
Immunohistochemistry
Antigens were retrieved from formaldehyde-fixed, paraffin-embedded tumor tissue sections by boiling in sodium citrate buffer (pH 6.0) for 30 minutes using a microwave histoprocessor. The tissue sections were dehydrated and subjected to peroxidase blocking. Immunohistochemical staining was performed by incubating the tissue sections with primary antibodies overnight at 4°C, followed by incubation with goat anti-mouse horseradish peroxidase secondary antibody conjugated with horseradish peroxidase (ab6788, 1:200 in 1% BSA/Tris-buffered saline with Tween 20, Abcam, Cambridge, UK) for 1 hour at room temperature. The sections were then exposed to diaminobenzidine substrate (dissolved in Dako substrate buffer, 760-500, Roche, Indianapolis, IN), followed by Gill’s hematoxylin counterstaining and standard dehydration treatment. The staining images were obtained using an Axiovert 200 microscope (Zeiss).
Patient blood samples
Blood samples were obtained from the 206 patients admitted in Ruijin Hospital, Shanghai Jiao Tong University School of Medicine (17). Ethical approval was obtained from the Institutional Ethics Committee of Shanghai Jiao Tong University Medical School. Whole blood was collected from the cubital vein, and cellular components were eliminated by centrifugation (twice at 3000 × g, 4°C, 15 minutes). The supernatant was filtered through an 0.8-μm filter (Merck, Darmstadt, Germany) by hydrostatic pressure to remove the remaining platelets and apoptotic bodies. Knowing that differential centrifugation is a gold standard and the most common method to isolate exosomes, 4 mL of plasma was first centrifuged twice at 3000 × g and 10,000 × g for 20 minutes at room temperature to remove cells and other debris in the plasma. The supernatants were then centrifuged at 100,000 × g for 30 minutes at 4°C to remove microvesicles larger than exosomes, harvested, and again centrifuged at 10,000 × g for 70 minutes at 4°C. Subsequently, the supernatants were gently decanted, and the exosome sediments were resuspended in PBS.
Statistical analyses
GraphPad Prism 5.0 (Graphpad Software) was used for the statistical analyses. To determine significance between two groups, an unpaired t test was performed. A Kruskal–Wallis test was used to evaluate the differences between more than two groups. P values of <0.05 were considered statistically significant.
Results
H19 overexpression inhibits contralateral GH3 tumor growth in vivo
We have found previously that lncRNA H19 was expressed at a low level in pituitary tumors, and H19 overexpression could markedly inhibit pituitary tumor growth, especially in the in vivo transplant tumor model, where pituitary tumor growth was inhibited almost completely (16).
In the current study, we divided the nude mice into group A and group B. Tumor cells were injected subcutaneously into both flanks of the nude mice in the following manners: in group A, normal GH3 pituitary tumor cells were injected into the left flank and GH3 cells transfected with blank lentivirus were injected into the right flank; in group B mice, normal GH3 pituitary tumor cells were injected into the left flank and GH3 cells with H19 overexpression (adenovirus stable cell line) were injected into the right flank, both at a density of 1 × 10⁶ cells. The mice were euthanized 2 weeks after injection (Fig. 1A and 1B). In addition to the obvious growth inhibitor of H19 overexpression xenograft tumors, it was surprisingly found that the mean size of the normal GH3 tumors in group B reduced significantly by 72.77% as compared with that in normal GH3 tumors of group A (0.27 ± 0.06 g vs 0.91 ± 0.23 g, P < 0.0001; Fig. 1A and 1C–1E), suggesting that the effect of H19 overexpression might be transmitted to the contralateral side through some unknown pathway and suppressed the growth of the normal GH3 tumors. Then, we detected the H19 expression level in the four tumor groups and found that the H19 expression level in normal GH3 tumors of group B was significantly higher than that in the normal GH3 tumors of group A (P < 0.0001, Fig. 1F). The xenograft tumor weights are listed in an online repository (17). These unexpected findings led us to postulate that H19 expression may inhibit the growth of the contralateral GH3 tumors through some unknown way by increasing the H19 expression level.
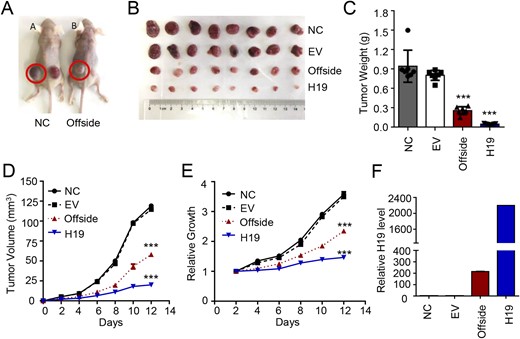
H19 overexpression inhibits in vivo growth of the contralateral GH3 tumor. (A) Normal GH3 cells were injected into the left flank and lentivirus-transfected GH3 cells were injected into the right flank of nude mice in group A, whereas normal GH3 cells were injected into the left flank and H19-overexpressing GH3 cells were injected into the right flank of nude mice in group B, both at the concentration of 1 × 10⁶ cells (n = 8); the mice were euthanized after a 2-wk culture. (B) The tumors were removed, photographed and weighed. (C) The mean weight of the tumors on the contralateral H19 side was significantly lower than that on the normal GH3 side. ***P < 0.0001. (D and E) The volume and growth rate of the subcutaneous tumor formation were measured daily using the following equation: volume = a × b2/2, where a represents the length and b represents the width. ***P < 0.0001. (F) The H19 expression level in the four groups was detected and H19 RNA was measured by qRT-PCR and normalized to β-actin.
H19 overexpression cell medium inhibits in vitro proliferation of GH3 cells
We cultured the GH3 cells overexpressing H19, collected the culture medium, and used the conditioned medium to treat the normal GH3 cells. MTS assays showed that the growth of the normal GH3 cells treated with the H19-overexpression medium was significantly suppressed compared with the control group (P < 0.001, Fig. 2A), showing a 30.3% inhibitory rate at 72 hours. The H19-overexpressing GH3 medium also potently inhibited the colony formation of GH3 cells (Fig. 2B). qRT-PCR showed that the H19 expression level in the conditioned medium from the H19-overexpressing GH3 cells was significantly increased compared with the control medium/cells (Fig. 2C). Alternatively, we knocked down the H19 expression in GH3 cells with short hairpin RNA (16), collected the culture medium, and used the conditioned medium to treat the normal GH3 cells. The growth of GH3 cells was promoted compared with the control group (P < 0.05, Fig. 2D). These results suggested that H19 might be secreted outside the expressing cells and exert its inhibitory effect on other cells.
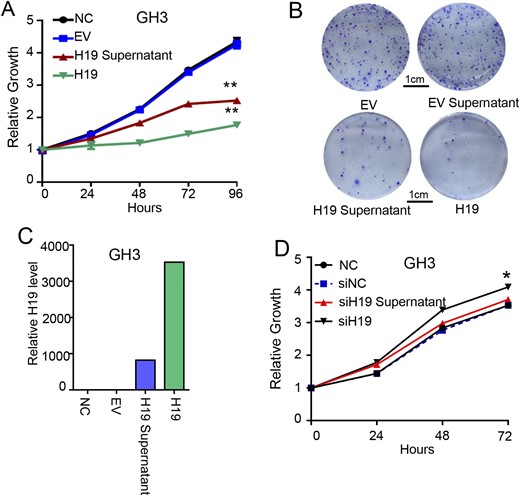
The H19-overexpression cell medium can inhibit normal GH3 cell proliferation in vitro. (A) The H19-overexpression cell medium can inhibit normal GH3 cell proliferation in vitro. For 4 d, cell viability was periodically measured with an MTS assay (n = 3). **P < 0.001. (B) H19-overexpression cell medium reduced the colony formation rate of GH3 cells. GH3- and H19-overexpressing GH3 cells were seeded to six-well plates with 500 cells per well and cultured separately with the normal medium, lentivirus supernatant, and H19-overxpression supernatant for 14 d, stained with crystal violet, and counted for the number of colonies. (C) The H19 expression level in the four groups was determined, and the H19 RNA level was detected by qRT-PCR and normalized to β-actin. (D) The H19 low expression cell medium promotes GH3 cell proliferation in vitro. For 3 d, cell viability was periodically measured with an MTS assay (n = 3). *P < 0.05.
Exosomes serve as the medium for H19 to achieve transmembrane transport and exert its inhibitory effect
Recent studies demonstrated that exosomes could play their role of extracellular transfer (7, 9, 18–21). A study using deep sequencing of human plasma exosomes showed that exosomes contained various forms of RNA, among which lncRNA accounted for 3.36% (22). Additionally, functional lncRNA transmitted by exosomes was found to be associated with tumor sensitivity to chemotherapy (6, 13, 23). Therefore, we postulated that exosomes might serve as a specific medium to transport H19 to other cells. TEM showed that there were large numbers of exosomes in the conditioned medium from the H19-overexpressing GH3 cells, exhibiting typical lipid bilayer membrane encapsulation and cup-shaped morphology (Fig. 3A). As CD63, Alix, and TSG101 are well-known protein markers of exosomes (24), we detected whether these specific markers were expressed in isolated exosomes. Indeed, Western blotting revealed the presence of these proteins in the conditioned medium from the H19-overexpressing GH3 cells (Fig. 3B). To further determine whether those exosomes containing H19, we extracted total RNA from the exosomes and found that H19 was highly expressed in the conditioned medium from the H19-overexpressing GH3 cells (P < 0.0001, Fig. 3C).
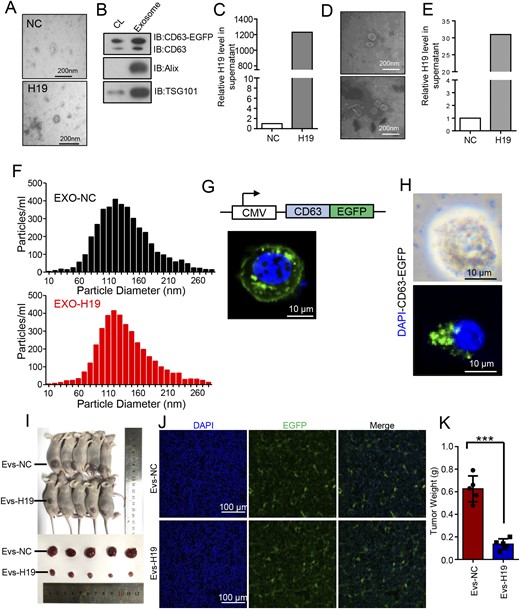
Exosomes serve as the medium for H19 to achieve transmembrane transport and exert its inhibitory effect. (A) Representative TEM images of GH3- and H19-overexpressing GH3 cells from exosomes (scale bars, 200 nm). (B) Detection of exosomal markers CD63, Alix, and TSG101 in GH3 cells and cell supernatant by Western blot analysis. (C) Exosomes were extracted from normal GH3- and H19-overexpression media by ultracentrifugation, from which total RNA was extracted to measure H19 RNA by qRT-PCR and normalized to β-actin. ***P < 0.0001. (D) Whole blood was drawn from nude mice of two groups in Fig. 1 and transferred to the EDTA coagulation-promoting tube and centrifuged at 3000 rpm for 10 min to extract the plasma. Representative images of the exosomes in the two groups were analyzed by TEM (scale bars, 200 nm). (E) The H19 expression level in the plasma exosomes in nude mice of the two group was detected by qRT-PCR and normalized to β-actin. **P < 0.001. (F) Size distribution of exosomes isolated from GH3- and H19-overexpressing GH3 cells was analyzed by NTA. (G) Absorption of normal exosomes by GH3 cells was detected by exosome tracing method; EGFP-labeled exosomes were added to the cell medium for 8 h and observed under a fluorescence microscope (scale bar, 100 μm). (H) Absorption of H19-overexpression exosomes by GH3 cells was detected by exosome tracing method; EGFP-labeled exosomes were added to the cell medium for 8 h and observed under a fluorescence microscope (scale bars, 10 μm). (I) H19-overexpressing GH3 cells that could stably express exosome-specific markers were constructed; using the injection method described in Fig. 1, the animals were treated, cultured for 7 d, and exosomes (100 µg of total protein in a 100μL volume) were injected twice a week in the tail vein and then euthanized. The tumors were removed, photographed, and weighed. (J) Absorption of H19-overexpression exosomes by the xenograft tumor was detected by a fluorescence microscope (scale bars, 100 mm). H19-overexpression exosomes, which were fluorescently labeled, were expressed in the tumors. (K) The mean weight of the tumors injected with exosomal H19 was significantly lower than that for injected exosomal normal controls. ***P < 0.0001.
Large numbers of exosomes were found in the plasma from the mice with H19-overexpressing GH3 cells (Fig. 3D). The H19 expression in the plasma exsomes of group B was by much higher than that in group A (P < 0.0001, Fig. 3E), indicating that the subcutaneously implanted tumors from the H19-overexpressing GH3 cells secreted large numbers of H19-containing exosomes into the blood.
Using NTA (25), we detected the number and size of exosomes in the supernatant of the two groups and found no significant difference in both the number and size of the exosome particles in the blood from the mice in two groups (Fig. 3F). Subsequently, the exosomes secreted by H19-overexpressing GH3 cells were labeled with fluorescence to observe whether these exosomes were absorbed by normal GH3 cells under the laser scanning confocal microscope. The result showed that EGFP fluorescence-labeled exosomal H19 was present in the cytoplasm of the normal GH3 cells (Fig. 3G and 3H), indicating that the exosomes secreted by H19-overexpressing GH3 cells could be effectively transferred to normal GH3 cells.
Additionally, we established H19-overexpressing GH3 cells that could secrete EGFP-labeled exosomes and used them in an in vivo experiment. We divided the nude mice into two groups. The nude mice were injected subcutaneously with 1 × 10⁶ GH3 cells on one side. After 1 week of feeding, the nude mice in group A and group B were injected with control exosomes and exosomal H19 in the tail vein, respectively. Both exosomes were labeled with EGFP fluorescence. Exosomes (100 μg of total protein in a 100-μL volume) were injected twice a week. After 2 weeks, the animals were euthanized and photographed (Fig. 3I). The result showed that the fluorescent label was expressed in the tumors of group B (Fig. 3J), indicating that the exosomes containing H19 could be transferred smoothly to distal tumors. Furthermore, the mean weight of the tumors with exosomal H19 was significantly lower than the control group injected with normal exosome [0.093 ± 0.05 g vs 0.51 ± 0.18 g, P < 0.0001; Fig. 3K; (17)].
Based on these findings, we postulated that overexpressed H19 was transferred to normal GH3 cells through exosomes, where it exerted its growth inhibitory effect.
Exosomal H19 increases the sensitivity of GH3 cells to CAB
It has been shown that CAB could increase H19 expression in cells in a time- and dose-dependent manner (17). Therefore, we used CAB to treat GH3 cells for 24 hours and collected the culture medium to detect the exosomal H19 expression in exosomes. The results showed that exosomal H19 expression was increased after CAB treatment (Fig. 4A).
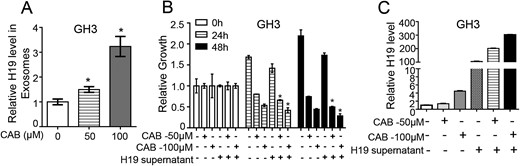
Exosomal H19 increases the sensitivity of GH3 cells to CAB. (A) Extracellular H19 expression in GH3 cells was induced by CAB at 0, 50, and 100 μM for 24 h; exosomes were extracted from the media of all groups by ultracentrifugation; total RNA was extracted from the exosomes to measure the H19 RNA level by qRT-PCR. *P < 0.05. (B) After 48 h action of 0, 50 or 100 μM CAB and/or H19-overexpression medium on GH3 cells, cell viability was detected by MTS in each group, showing that H19 and CAB in the exosomes worked synergically. *P < 0.05. (C) H19 RNA level was detected by qRT-PCR to determine the H19 expression level in each group. The result showed that the H19 expression level in cells was increased after coaction of CAB and H19 in a concentration-dependent manner.
To determine whether exosomal H19 had a synergic effect with CAB, conditioned medium from H19-overexpressing GH3 cells was used in combination with CAB to treat the normal GH3 cells. MTS assay showed that the conditioned medium combined with CAB inhibited cell proliferation more effectively than did either the conditioned medium or CAB alone (P < 0.05, Fig. 4B). Additionally, the H19 expression in cells treated with the conditioned medium combined with CAB was substantially increased (Fig. 4C). These results indicate that exosomal H19 had a synergic effect with CAB to inhibit tumor growth.
Exosomal H19 inhibits phosphorylation of mTORC1 substrate 4E-BP1
We have shown that H19 could inhibit the activity of mTORC1 by blocking the interaction between 4E-BP1 and Raptor, and then inhibiting phosphorylation of 4E-BP1 (16). In the current study, we found that the expression level of phosphorylated 4E-BP1 (p-4E-BP1) was downregulated after H19 overexpression, and the expression level of p-4E-BP1 was also downregulated in cells treated with the conditioned medium from H19-overexpressing GH3 cells. However, mTORC1-mediated S6K1 phosphorylation was not affected by overexpression of exosomal H19 (Fig. 5A). The expression of p-4E-BP1 in GH3 cells cultured in the presence of the conditioned medium from H19-overexpressing GH3 cells combined with CAB was significantly low as compared with that in GH3 cells cultured in the presence of the conditioned medium from H19-overexpressing GH3 cells or CAB alone (Fig. 5B). Similarly, the expression level of p-4E-BP1 was inhibited in group B xenograft tumors (Fig. 5C). However, the mTORC1-mediated S6K1 phosphorylation was not affected by either H19 overexpression or downregulation. Representative images of immunohistochemical staining showed that the conditioned medium from H19-overexpressing GH3 cells decreased 4E-BP1 phosphorylation, but not S6K1 phosphorylation (Fig. 5D). Similarly, in the experiment of tail vein–injected overexpressing H19 exosomes, the expression level of p-4E-BP1 was also downregulated (Fig. 5E). These results indicate that exosomal H19 could inhibit 4E-BP1 phosphorylation.
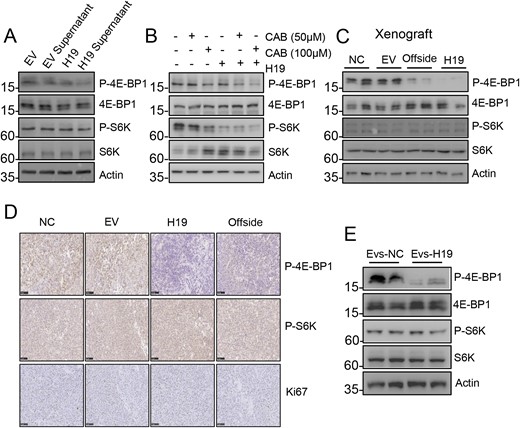
Exosomal H19 markedly inhibits 4E-BP1 phosphorylation. (A) The H19-overexpression medium inhibited phosphorylation of 4E-BP1 in GH3 cells. S6K and 4E-BP1 phosphorylation levels were detected by Western blot analysis. (B) The H19-overexpression medium and CAB worked together to further inhibit 4E-BP1 phosphorylation. S6K and 4E-BP1 phosphorylation levels were detected in the each group by Western blot. (C) H19 overexpression inhibited 4E-BP1 phosphorylation of the contralateral normal tumor. The expression levels of S6K and 4E-BP1 phosphorylation in the four groups were detected by Western blot. (D) The expression levels of S6K and 4E-BP1 phosphorylation in the four groups were detected by immunohistochemistry (scale bars, 100 μm). (E) In vivo experiment in which H19-overexpression exosomes inhibited 4E-BP1 phosphorylation of the normal tumor. The expression levels of S6K and 4E-BP1 phosphorylation in the two groups were detected by Western blot.
Significance of exosomal H19 in clinical therapeutic outcomes
It is reported that large numbers of exosomes are present in plasma, where they serve as a medium to transmit signals throughout the body; additionally, they have been suggested as diagnostic and prognostic biomarkers of cancers (26–28). However, plasma exosomes in patients with pituitary tumor have yet to be explored.
Therefore, we first used TEM to detect exosomes in the plasma from patients with pituitary tumors. We collected plasma samples from 200 healthy individuals and 206 patients with pathologically confirmed pituitary tumors of different types, including 123 prolactinomas, 49 nonfunctioning PAs, 29 GH adenomas, and 5 ACTH tumors (17). TEM clearly confirmed their existence in the patient plasma (Fig. 6A). We further found that the expression level of exosomal H19 in the patients with all subtypes of pituitary tumors was significantly lower than that in the healthy subjects (P < 0.001, Fig. 6B). We investigated the 24 pairs of PA tissues and plasma exosomes (including 8 prolactinomas, 9 nonfunctioning PAs, 4 GH adenomas, and 3 ACTH adenomas) and found that there was a positive correlation in the H19 expression between the two groups (17).
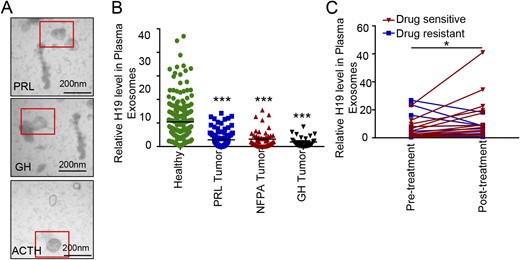
Clinical significance of exosomal H19 in therapeutic outcomes. (A) Representative images of plasma exosomes in healthy subjects, patients with pituitary tumors sensitive to drug therapy, and those with pituitary tumors resistant to drug therapy (scale bars, 200 nm). (B) Exosomes were isolated from plasma by ultracentrifugation, from which total RNA was extracted. The H19 RNA level was detected by qRT-PCR, and H19 expression levels in plasma exosomes from the 200 healthy subjects and 206 patients with pituitary tumors were detected. ***P < 0.0001. (C) H19 expression levels in plasma exosomes from 25 patients with prolactinoma before and after DA treatment. Correlation analysis is based on patient sensitivity to BRC or CAB, which indicates that the change of H19 expression may be used as an indicator of the patient’s response to DAs (*P < 0.05).
Next, we further measured the expression levels of H19 in 25 patients with prolactinoma before treatment and at least 3 months after CAB or BRC treatment. The clinical data of these patients are shown in an online repository (17), among them 14 patients who received BRC and 11 who received CAB treatment. According to the definition of BRC or CAB resistance (5, 29–31), there were seven BRC-resistant patients and four CAB-resistant patients in this group. Among 11 DA-resistant patients, plasma H19 level was increased in four patients and decreased in the remaining seven patients after DA treatment. Alternatively, in 14 DA-sensitive patients, plasma H19 level was increased in 13 patients and decreased in 1 patient. There was a significant difference in the trend of plasma H19 levels between the DA-sensitive and DA-resistant patients (P = 0.0101, Fig. 6C). These results suggest that the change of exosomal H19 level may be correlated with the prognosis or drug response of the patients. A higher exosomal H19 level after DA treatment may predict a good prognosis.
Discussion
Exosomes serve as a mean of exchanging information between cells, and they play an important role in the treatment of tumors (7, 9, 32). The current study demonstrated that lncRNA H19 was able to inhibit distal tumor cells via exosomes; CAB could increase H19 expression and played a synergic therapeutic effect. Also, the prognostic outcome of patients with prolactinoma who received DA treatment was correlated with the change of exosomal H19 level.
In the past decade, extracellular vesicles have been recognized as an important medium for intercellular communication, participating in biological information transfer in prokaryotic and eukaryotic cells to regulate diverse biological processes, including tumor progression, invasion, metastasis, and chemoresistance (33–38). Several studies have indicated that extracellular vesicles can also transfer functional lncRNAs, which plays an important role in chemotherapy resistance (8, 13, 26, 38–42). For example, lncRNA activated in renal cell carcinoma with sunitinib resistance can be transmitted to peripheral sensitive cells through exosomes and reduce the sensitivity of these cells to chemotherapy drugs by competitively binding miR-34/miR-449 of target cells (13). Therefore, lncRNA activated in renal cell carcinoma with sunitinib resistance could be used as a predictive molecule and therapeutic target for renal cell carcinoma with potential sunitinib resistance (13). Xu et al.’s (38) recent study indicates that exosomal lncPSMA3-AS1 mediates resistance of multiple myeloma to proteasome inhibitors by regulating the stability of encoding proteasome subunit α7 (PSMA3). Ren et al. (14) reported that cancer-associated fibroblasts promoted the chemoresistance of colorectal cancer by transferring exosomal H19. In our study, exosomal H19 inhibited the growth of PAs and showed a synergic therapeutic effect with CAB.
We have recently found that the expression level of H19 was often downregulated in human primary PAs, and this downregulation of H19 was negatively correlated with tumor progression (16). Similarly, increased H19 expression inhibited the proliferation of the GH3 cell line and its tumor growth in vivo through inhibiting the function of mTORC1 rather than mTORC2. H19 could prevent mTORC1-mediated 4E-BP1 phosphorylation without affecting the activation of S6K1. A recent study reported that exosomal H19 could activate the β-catenin pathway by acting as a competing endogenous RNA sponge for miR-141 (14). Exosomal H19 released from cancer stem cell–like CD90+ cells could influence their tumor microenvironment by promoting angiogenesis (18). In the current study, we found that exosomal H19 was transferred to the cytoplasm and inhibited tumor cell proliferation and growth through inhibiting the phosphorylation of 4E-BP1.
DAs are first-line drugs for the treatment of prolactinoma (1). However, DAs are ineffective with regard to drug-resistant prolactinomas and other types of pituitary tumors. The GH3 cell line lacks DRD2 and is therefore considered drug-resistant (43, 44). Our previous study showed that H19 overexpression could effectively inhibit GH3 cell growth both in vitro and in vivo (16), indicating that H19 is effective to drug-resistant and other types of pituitary tumors. In the current study, we found that CAB and exosomal H19 exerted a synergic effect on the suppression of GH3 growth. CAB was able to increase the H19 expression level in cells, and then exosomal H19 was secreted to the extracellular fluid in an exocrine manner; these exosomes were absorbed by nearby cells and worked together with the existing CAB on cells to further increase the H19 expression level in cells, which further inhibited 4E-BP1 phosphorylation and tumor growth.
Surprisingly, we found that the H19 expression level in the plasma of 206 patients with pituitary tumors was lower than that in the 200 healthy subjects. This finding is consistent with our hypothesis that H19 works as a tumor suppressor to inhibit the development and progression of PAs. We detected dynamic changes of H19 expression levels in the plasma of patients with prolactinoma and at least 3 months after medical treatment, and patients with an increased H19 level after CAB or BRC treatment responded well to DA therapy, suggesting that exosomal H19 in patients with prolactinomas may be used as a promising biomarker for predicting drug response.
Conclusion
In summary, the current study further explored the molecular mechanism of exosomes in blocking mTORC1-mediated 4E-BP1 phosphorylation via lncRNA H19 transfer, and thus provided a novel target for the clinical treatment of pituitary tumors. Additionally, the findings highlight the possibility of using plasma exosomal H19 as an important biomarker for predicting medical response of patients with prolactinomas.
Acknowledgments
Financial Support: This work was supported by National Natural Science Foundation of China Grants 81671371, 81271523 (to Z.B.W.) and 81801367 (to Z.R.W.), Shanghai Science and Technology Commission Grant 18XD1403400 (to Z.B.W.), the Program of Shanghai Academic Research Leader (to Z.B.W.), and by the Shanghai Municipal Education Commission–Gaofeng Clinical Medicine Grant Support with Grant 20161407 (to Z.B.W.).
Additional Information
Disclosure Summary: The authors have nothing to disclose.
Data Availability: All data generated or analyzed during this study are included in this published article or in the data repositories listed in References.
Abbreviations:
- BRC
bromocriptine
- CAB
cabergoline
- DA
dopaminatic agonist
- EGFP
enhanced green fluorescent protein
- lncRNA
long noncoding RNA
- NTA
nanoparticle tracking analysis
- PA
pituitary adenoma
- p-4E-BP1
phosphorylated 4E-BP1
- qRT-PCR
quantitative real-time-PCR
- TEM
transmission electron microscopy
References and Notes
Author notes
Y.Z., Y.T.L., and H.T. contributed equally to this study.
