


Abstract
Antithyroid drug (ATD) therapy in early pregnancy is associated with birth defects, but more data are needed to substantiate the risk associated with different types of ATD. Furthermore, the role of abnormal maternal thyroid function per se remains unclarified.
To evaluate the risk of birth defects associated with the use of ATD in an extended nationwide cohort and the role of abnormal maternal thyroid function in birth cohorts including stored maternal blood samples from early pregnancy.
Danish pregnant women and their live-born children, including 1,243,353 children from a Nationwide Register-Based Cohort (NRBC), 1997 to 2016; 8830 children from the Danish National Birth Cohort (DNBC), 1997 to 2003; and 14,483 children from the North Denmark Region Pregnancy Cohort (NDRPC), 2011 to 2015.
Birth defects diagnosed before 2 years of age.
In the NRBC, altogether 2718 (0.2%) children had been exposed to ATD in early pregnancy. The overall frequency of birth defects was 6.7% (95% CI, 6.7% to 6.8%) in nonexposed children and higher after exposure to methimazole/carbimazole (9.6%; 95% CI, 8.2% to 11.2%) and propylthiouracil (8.3%; 95% CI, 6.7% to 10.3%). On the other hand, the frequency of maternal thyroid dysfunction in early pregnancy was similar in the random cohort and in cases of birth defect in the DNBC (12.4 vs 12.6%, P = 0.8) and the NDRPC (15.1 vs 15.4%, P = 0.8).
Results corroborate an increased risk of birth defects associated with the use of ATD in early pregnancy and suggest that abnormal maternal thyroid function is not a major risk factor for birth defects.
Antithyroid drug (ATD) is preferred for the treatment of hyperthyroidism in pregnancy (1, 2). The hyperthyroidism of Graves disease in pregnant women should be treated to prevent maternal and fetal complications, but it raises concern about the risk of birth defects associated with the use of ATD (3). An embryopathy of specific, severe birth defects associated with the use of methimazole (MMI) and carbimazole (CMZ) has been known for years, but analytical observational studies were not reported until a decade ago (4). These findings have challenged and rephrased the clinical guidance for the management of hyperthyroidism in pregnant women, because birth defects have been associated with MMI/CMZ and also with propylthiouracil (PTU) (5). Thus, a clinical focus on balancing the need for treatment against the potential teratogenic side effects has been introduced in revised clinical guidance, although the evidence regarding ATD withdrawal in early pregnancy is inadequate at present (1, 2). An increased risk of birth defects associated with the use of MMI/CMZ has been consistently described (6–8). On the other hand, human observational and experimental animal studies have shown divergent results considering the risk of birth defects after exposure to PTU (6–11). Uncertainty remains regarding the risk of birth defects associated with the different types of ATD, and more data are needed.
We previously evaluated the risk of birth defects in a nationwide study of all children in Denmark born from 1996 to 2008 (7). We extended the cohort and included children born during the 20-year period from 1997 to 2016. Furthermore, we measured maternal thyroid function in stored blood samples from pregnant women who were part of different birth cohorts in Denmark in the years 1997 to 2003 and 2011 to 2015. This method allowed evaluation of the unresolved role of maternal thyroid function per se in the development of birth defects.
Materials and Methods
Study population
The study included the Nationwide Register-Based Cohort (NRBC), participants from the Danish National Birth Cohort (DNBC), and participants from the North Denmark Region Pregnancy Cohort (NDRPC). The NRBC included all children live-born in Denmark from 1 January 1997 to 31 December 2016 who were identified in the Danish Medical Birth Register (MBR) (12) and had available information on gestational age at birth (Fig. 1). The registration procedure in the MBR was changed from 1 January 1997, and only children born from 1997 and onward were included in the current study to ensure similar registrations throughout the study period. The NRBC was used to evaluate the association between maternal use of ATD and birth defects, but no information on biochemical measurements was available in the register-based cohort.
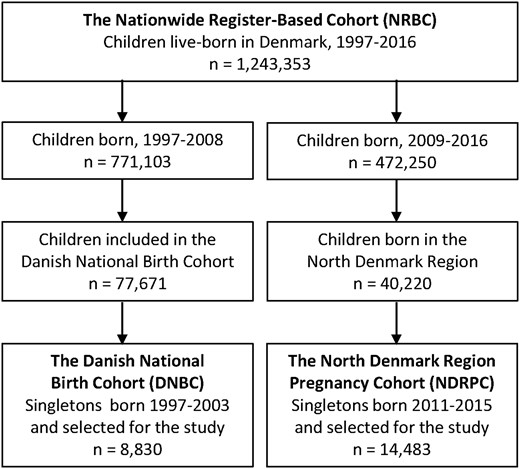
Flowchart illustrating selection of the study populations.
The DNBC and the NDRPC included the measurement of maternal thyroid function in a stored blood sample from the early pregnancy, and these cohorts were used to evaluate the association between abnormal maternal thyroid function and birth defects. The DNBC was established from 1997 to 2003 and included 77,671 children live-born in Denmark (Fig. 1). For the present case-cohort study, pregnant women were selected as part of a 12% random subcohort (n = 7624) and/or because their child had diagnosed birth defects within 2 years of follow-up (n = 1383). The NDRPC was established from 2011 to 2015. It included all pregnant women in the North Denmark region who had a blood sample drawn in early pregnancy as part of prenatal screening for chromosomal anomalies, and women who gave birth to singleton live-born children were included in the study (Fig. 1).
The study and the data handling were approved by the Danish Data Protection Agency (no. 2008-58-0028). Furthermore, the biochemical measurements in stored blood samples was approved by the North Denmark Region Committee on Health Research Ethics (N-20130054 and N-20150015).
Exposure definitions
In the NRBC, the exposure of main interest was the use of ATD in early pregnancy, which was assessed from redeemed prescriptions of the drugs in the period ranging from 6 months before pregnancy start through the 10th week of pregnancy, as described previously in detail (7). The Danish National Prescription Register (13) includes information on redeemed prescriptions of drugs coded according to the Anatomical Therapeutic Classification system, and drugs used for the treatment of thyroid disease are included in the Anatomical Therapeutic Classification group: H03. The latest redeemed prescription before pregnancy start (or the first in pregnancy if no previous treatment) was used to determine the exposure status in the early pregnancy, and women who redeemed both MMI/CMZ and PTU after pregnancy start were grouped separately and considered double exposed. CMZ is a prodrug to MMI and was combined with MMI and described as MMI exposure in the current study. The nonexposed group was defined as children whose mother had no diagnosis of hyperthyroidism, no registration of thyroid surgery, and no redeemed prescription of ATD or levothyroxine before, during, or after the pregnancy under study and up to 31 December 2017.
In the DNBC and NDRPC, the exposure of interest was abnormal maternal thyroid function, which was assessed from the measurement of TSH and free T4 (fT4) in a stored blood sample from the early pregnancy (median weeks 9 to 10), as described previously in detail (14, 15). Thyroid function parameters were measured with a Dimension Vista (Siemens Healthineers, Erlangen, Germany) immunoassay in the DNBC and an Advia Centaur (Siemens Healthineers) immunoassay in the NDRPC. In both cohorts, pregnancy week specific reference ranges had been established (14, 15) and were used for the classification of maternal thyroid function as normal (euthyroid) or abnormal (overt and subclinical hyperthyroidism and hypothyroidism as well as isolated low and high fT4).
Outcome assessment
Information on birth defects in the child was assessed from inpatient and outpatient hospital diagnoses in the Danish National Hospital Register (16) coded according to the International Classification of Diseases, 10th Edition (ICD-10). All diagnoses of birth defects (ICD-10: Q00 to Q99) diagnosed before the child was 2 years old were assessed in the NRBC and grouped in accordance with our previous report (7). In the DNBC, children were selected for the study if they had a diagnoses within the eight groups of birth defects [Q10 to 15 (eyes), Q18 (face and neck, others), Q20 to 28 (circulatory), Q30 to 38 (respiratory), Q39 to 45 (digestive), Q60 to 64 (urinary), Q79 (musculoskeletal, others), Q80 to 84 (integumentary system)] previously associated with the use of ATD (7), and these groups of birth defects were likewise assessed in the NDRPC.
Statistical analyses
In the NRBC, the frequency of birth defects by ATD exposure was compared via χ2 test. Furthermore, we reported the results of a Cox proportional hazards model with 95% CI adjusting for multiple birth, maternal age, parity, and smoking (from the MBR), origin (from Statistics Denmark), and diabetes (from the Danish National Hospital Register and Danish National Prescription Register). Information on maternal prepregnancy body mass index (BMI) was available only in the MBR from 2004 and onward and was included in a subanalyses. In the DNBC and NDRPC, the association between abnormal maternal thyroid function and birth defects was evaluated via a Cox proportional hazards model, which was a weighted model in the DNBC to account for the sampling procedure and the overlap between cases and the random subcohort, as previously described (17). The adjusted model evaluating these associations included information on maternal age, parity, origin, smoking, BMI, and diabetes.
Results
Study populations
The extended NRBC cohort included 1,243,353 pregnancies (Fig. 1 and Table 1) corresponding to the birth year period of the previous cohort (1997 to 2008) and the later cohort (2009 to 2016). The DNBC included a total of 8830 pregnancies, and 14,483 pregnancies were included in the NDRPC (Fig. 1 and Table 1).
Maternal Characteristics in the Different Cohorts
| NRBC (Extended) | NRBC (Previous) | NRBC (Later) | DNBC | NDRPC | ||||||
|---|---|---|---|---|---|---|---|---|---|---|
| Pregnancies, n | 1,243,353 | 771,103 | 472,250 | 8830 | 14,483 | |||||
| Birth year of the child | 1997–2016 | 1997–2008 | 2009–2016 | 1997–2003 | 2011–2015 | |||||
| Maternal characteristics, n, % | ||||||||||
| Maternal age | ||||||||||
| <30 y | 574,425 | 46.2 | 368,977 | 47.8 | 205,448 | 43.5 | 4326 | 49.0 | 7520 | 51.9 |
| ≥30 y | 668,928 | 53.8 | 402,126 | 52.2 | 266,802 | 56.5 | 4504 | 51.0 | 6963 | 48.1 |
| Maternal paritya | ||||||||||
| Nulliparous | 550,134 | 44.8 | 331,264 | 43.6 | 218,870 | 46.7 | 4415 | 50.0 | 6719 | 46.4 |
| Multiparous | 678,810 | 55.2 | 428,654 | 56.4 | 250,156 | 53.3 | 4415 | 50.0 | 7761 | 53.6 |
| Maternal smoking in pregnancyb | ||||||||||
| No smoking | 959,795 | 84.1 | 549,024 | 81.3 | 410,771 | 88.3 | 6436 | 72.9 | 12,789 | 88.4 |
| Smoking | 180,816 | 15.9 | 126,578 | 18.7 | 54,238 | 11.7 | 2392 | 27.1 | 1678 | 11.6 |
| Maternal prepregnancy BMIc | ||||||||||
| <30 kg/m2 | 668,213 | 87.7 | 265,623 | 88.4 | 402,590 | 87.2 | 7963 | 91.7 | 12,156 | 84.0 |
| ≥30 kg/m2 | 93,563 | 12.3 | 34,698 | 11.6 | 58,865 | 12.8 | 724 | 8.3 | 2312 | 16.0 |
| Maternal comorbidity | ||||||||||
| No diabetes | 1,156,212 | 93.0 | 723,104 | 93.8 | 433,108 | 91.7 | 8550 | 96.8 | 13,183 | 91.0 |
| Diabetes | 87,141 | 7.0 | 47,999 | 6.2 | 39,142 | 8.3 | 280 | 3.2 | 1300 | 9.0 |
| Maternal origind | ||||||||||
| Born in Denmark | 1,054,494 | 84.8 | 669,121 | 86.8 | 385,373 | 81.7 | 8644 | 97.9 | 12,838 | 88.6 |
| Not born in Denmark | 188,508 | 15.2 | 101,936 | 13.2 | 86,572 | 18.3 | 183 | 2.1 | 1645 | 11.4 |
Missing information on parity (n = 14,409) not included.
Missing information on maternal smoking in pregnancy available only from 1998 onward, missing information (n = 102,742) not included.
Information on maternal prepregnancy BMI available only from 2004 and onward, missing information (n = 481,577) not included.
Missing information on maternal origin (n = 351) not included.
The cohorts were established during a 20-year period, which introduced some differences in maternal characteristics (Table 1). Notably, maternal age increased over time, but it was lower in the NDRPC than in the national cohort around the same time, which is compatible with known regional differences in Denmark. The frequency of maternal smoking in pregnancy decreased over time, whereas the frequency of maternal diabetes and non-Danish origin increased. As expected, the frequency of non-Danish origin was lower in the DNBC (Table 1) because one of the selection criteria in this cohort was the ability to speak Danish well enough to participate in a sequence of telephone interviews.
ATD and birth defects
Altogether 2718 children (0.2%) had been exposed to maternal use of ATD in early pregnancy in the extended NRBC cohort. MMI was the most frequently used ATD both in the extended and in the previous cohort, and the ratio of MMI to PTU exposure was 2.0 in the previous and 1.8 in the extended cohort (Table 2).
Frequency of Birth Defects Diagnosed Before 2 Years of Age and Corresponding Crude Hazard Ratio (cHR) and Adjusted Hazard Ratio (aHR) With 95% CIs According to Maternal Use of ATDs in Early Pregnancy
| Children | All Birth Defectsa | Subtypes of Birth Defectsb | |||||||||||
|---|---|---|---|---|---|---|---|---|---|---|---|---|---|
| n | n | % | Pc | cHR | aHRd | 95% CI | n | % | Pc | cHR | aHRd | 95% CI | |
| Cohort 1997–2016 | |||||||||||||
| Nonexposede | 1,159,181 | 77,791 | 6.7 | Reference | Reference | Reference | Reference | 35,953 | 3.1 | Reference | Reference | Reference | Reference |
| MMI | 1574 | 151 | 9.6 | <0.001 | 1.46 | 1.41 | 1.19–1.67 | 100 | 6.4 | <0.001 | 2.08 | 2.04 | 1.66–2.51 |
| PTU | 889 | 74 | 8.3 | 0.060 | 1.25 | 1.17 | 0.91–1.49 | 39 | 4.4 | 0.031 | 1.42 | 1.36 | 0.98–1.92 |
| Cohort 1997–2008 | |||||||||||||
| Nonexposede | 713,683 | 41,717 | 5.9 | Reference | Reference | Reference | Reference | 19,067 | 2.7 | Reference | Reference | Reference | Reference |
| MMI | 1050 | 94 | 9.0 | <0.001 | 1.56 | 1.46 | 1.17–1.81 | 64 | 6.1 | <0.001 | 2.33 | 2.25 | 1.73–2.93 |
| PTU | 528 | 47 | 8.9 | 0.003 | 1.55 | 1.48 | 1.08–2.02 | 27 | 5.1 | 0.001 | 1.94 | 1.89 | 1.26–2.85 |
ICD-10 diagnoses: Q00–99.
ICD-10 diagnoses: Q10–15, Q18, Q20–28, Q30–38, Q39–45, Q60–64, Q79, and Q80–84.
P value is the result of comparison with the nonexposed group via χ2 test.
Adjusted for maternal age, parity, multiple birth, origin, diabetes, and smoking.
No diagnosis of hyperthyroidism, no redeemed prescription of ATDs or levothyroxine, and no thyroid surgery from 1995 to 2017.
A total of 83,875 children (6.8%) had a diagnosed birth defect before 2 years of age in the extended NDRPC cohort. An increasing trend in the frequency of birth defects according to birth year of the child was observed throughout the study period (Fig. 2), which was less pronounced for the specific subtypes of birth defects previously associated with the use of ATD.
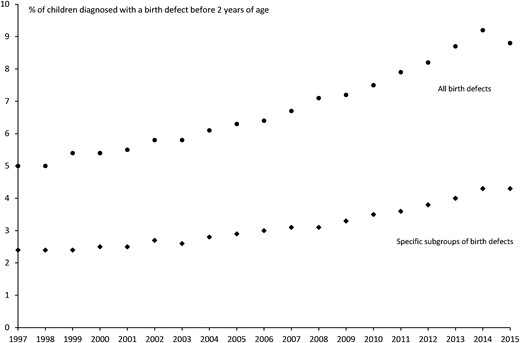
Prevalence of birth defects (all types combined and the subtypes previously associated with the use of ATD in early pregnancy) diagnosed before 2 y of age in children live-born in Denmark from 1997 to 2015.
Exposure to MMI was associated with a significantly higher prevalence of birth defects, when evaluating all birth defects and the defects previously associated with the use of ATD (Table 2). For exposure to PTU, a higher frequency of birth defects was observed in the extended and in the previous cohort compared with nonexposed, but the association was weakened in the extended cohort. Looking at subgroups of birth defects in the extended cohort (Table 3), MMI exposure was associated with birth defects in seven organ systems, whereas PTU revealed an association with face and neck defects and urinary system malformations only.
Frequency of Subgroups of Birth Defects Diagnosed Before 2 Years of Age in the Extended NRBC Cohort of Children Born in 1997–2016 According to Maternal Use of ATDs in Early Pregnancy
| Nonexposeda | MMI | PTU | ||||||
|---|---|---|---|---|---|---|---|---|
| n = 1,159,181 | n = 1574 | n = 889 | ||||||
| n | % | nb | % | Pc | nb | % | Pc | |
| Subgroups of birth defects (Q00–99) | ||||||||
| Nervous system (Q00–07) | 1180 | 0.10 | <3 | <0.3 | 0.6 | <3 | <0.3 | 0.9 |
| Eye (Q10–15) | 2480 | 0.21 | 7 | 0.44 | 0.05 | 0 | 0.00 | 0.2 |
| Ear (Q16–17) | 773 | 0.07 | <3 | <0.3 | 0.4 | <3 | <0.3 | 0.07 |
| Face and neck, others (Q18) | 907 | 0.08 | 0 | 0.00 | 0.3 | 3 | 0.34 | 0.006 |
| Circulatory system (Q20–28) | 15,195 | 1.31 | 39 | 2.48 | <0.001 | 16 | 1.80 | 0.2 |
| Respiratory system (Q30–38) | 9636 | 0.83 | 23 | 1.46 | 0.006 | 12 | 1.35 | 0.09 |
| Digestive system (Q39–45) | 3251 | 0.28 | 16 | 1.02 | <0.001 | <3 | <0.3 | 0.8 |
| Genital organs (Q50–56) | 12,182 | 1.05 | 15 | 0.95 | 0.7 | 9 | 1.01 | 0.9 |
| Urinary system (Q60–64) | 4125 | 0.36 | 12 | 0.76 | 0.007 | 7 | 0.79 | 0.03 |
| Musculoskeletal system (Q65–78) | 29,260 | 2.52 | 34 | 2.16 | 0.4 | 26 | 2.92 | 0.4 |
| Musculoskeletal system, others (Q79) | 925 | 0.08 | 7 | 0.44 | <0.001 | 0 | 0.00 | 0.4 |
| Integumentary system (Q80–84) | 2002 | 0.17 | 11 | 0.70 | <0.001 | <3 | <0.3 | 0.7 |
| Others (Q85–99) | 5532 | 0.48 | 9 | 0.57 | 0.6 | 4 | 0.45 | 0.9 |
No diagnosis of hyperthyroidism, no redeemed prescription of ATDs or levothyroxine, no thyroid surgery 1995–2017.
Subgroups with less than three cases were reported as <3 according to the regulations for the use of register-based data.
P value is the result of comparison with the nonexposed group via χ2 test.
Exposure to MMI was associated with a high risk (adjusted hazard ratio 20; 95% CI, 12 to 34) of the group of specific malformations considered part of an MMI embryopathy (aplasia cutis, esophageal atresia, choanal atresia, and omphalocele). A small group of children (n = 255) were exposed to both MMI and PTU in early pregnancy, because the mother shifted from MMI to PTU after pregnancy start (n = 240) or from PTU to MMI (n = 15). The frequency of the subgroups of birth defects previously associated with the use of ATD was 5.0% when the mother shifted to PTU after pregnancy start vs 3.1% in nonexposed (P = 0.09).
The associations between the use of ATD and birth defects were similar when the period for evaluation of exposure was narrowed to 3 months before pregnancy start or to the early pregnancy weeks. Furthermore, results did not change when the follow-up period for assessment of birth defects in the child was reduced to 1 month or 1 year or extended to 5-year or complete follow-up (median to age 11 years, range 1 to 21 years).
Maternal thyroid function and birth defects
The association between maternal thyroid function in pregnancy and birth defects was evaluated in the DNBC and the NDRPC (Table 4). The overall frequency of abnormal thyroid function was 12.5% in the DNBC and 15.1% in the NDRPC. In both cohorts, the overall frequency of abnormal thyroid function did not differ between the randomly sampled cohort and cases of birth defects (Table 4). For subtypes of maternal thyroid dysfunction, no associations with birth defects were observed, except for an association with overt hypothyroidism in the DNBC.
Frequency of Subtypes of Birth Defects Diagnosed Before 2 Years of Age and the Associated Crude Hazard Ratio (cHR) and Adjusted Hazard Ratio (aHR) With 95% CI According to Maternal Thyroid Function in Early Pregnancy
| Subcohort | Birth Defectsa | ||||||
|---|---|---|---|---|---|---|---|
| n | % | n | % | cHR | aHRb | 95% CI | |
| DNBC | |||||||
| No thyroid dysfunction | 6673 | 87.5 | 1209 | 87.4 | Reference | Reference | Reference |
| Thyroid dysfunction | 951 | 12.5 | 174 | 12.6 | 1.02 | 1.02 | 0.86–1.22 |
| Hyperthyroidism | |||||||
| Overt hyperthyroidism | 118 | 1.55 | 16 | 1.16 | 0.75 | 0.77 | 0.46–1.30 |
| Subclinical hyperthyroidism | 153 | 2.01 | 26 | 1.88 | 0.94 | 0.91 | 0.60–1.39 |
| Isolated high fT4 | 149 | 1.95 | 25 | 1.81 | 0.95 | 1.01 | 0.66–1.55 |
| Hypothyroidism | |||||||
| Overt hypothyroidism | 55 | 0.72 | 19 | 1.37 | 1.98 | 1.91 | 1.12–3.25 |
| Subclinical hypothyroidism | 302 | 3.96 | 53 | 3.83 | 0.95 | 0.95 | 0.70–1.29 |
| Isolated low fT4 | 174 | 2.28 | 35 | 2.53 | 1.11 | 1.15 | 0.79–1.65 |
| NDRPC | |||||||
| No thyroid dysfunction | 12,300 | 84.9 | 490 | 84.6 | Reference | Reference | Reference |
| Thyroid dysfunction | 2183 | 15.1 | 89 | 15.4 | 1.03 | 1.03 | 0.82–1.30 |
| Hyperthyroidism | |||||||
| Overt hyperthyroidism | 218 | 1.51 | 12 | 2.07 | 1.39 | 1.49 | 0.84–2.64 |
| Subclinical hyperthyroidism | 330 | 2.28 | 10 | 1.73 | 0.75 | 0.79 | 0.42–1.48 |
| Isolated high fT4 | 249 | 1.72 | 6 | 1.04 | 0.59 | 0.60 | 0.27–1.34 |
| Hypothyroidism | |||||||
| Overt hypothyroidism | 145 | 1.00 | 5 | 0.86 | 0.86 | 0.86 | 0.36–2.09 |
| Subclinical hypothyroidism | 752 | 5.19 | 33 | 5.70 | 1.11 | 1.08 | 0.76–1.53 |
| Isolated low fT4 | 489 | 3.89 | 23 | 3.97 | 1.19 | 1.19 | 0.79–1.82 |
ICD-10 diagnoses: Q10–15, Q18, Q20–28, Q30–38, Q39–45, Q60–64, Q79, and Q80–84.
Adjusted model included maternal age, parity, origin, smoking, BMI, and diabetes.
When considering subtypes of birth defects in children exposed to overt hypothyroidism in the DNBC, it appeared that this association was dominated by malformations of the eye and the circulatory system, but numbers were too sparse to perform stratified adjusted analyses. Results were similar when analyses were restricted to pregnancies in which the blood sample was drawn before pregnancy week 11 (n = 6715 in the DNBC; n = 10,343 in the NDRPC) or to pregnancies in which the mother received no current treatment with ATD or levothyroxine at the time of blood sampling (n = 8791 in DNBC; n = 14,290 in NDRPC).
Discussion
In a large extended nationwide cohort of more than 1 million children live-born in Denmark during a 20-year period, an increased risk of birth defects associated with the use of ATD in early pregnancy was corroborated. The subtypes of birth defects associated with the use of MMI and PTU differed, and MMI exposure revealed the highest risk and associations with severe birth defects in several organ systems. On the other hand, birth defects observed after early pregnancy exposure to PTU were located mostly in the urinary system and in the face and neck. The role of maternal thyroid function was addressed in independent birth cohorts, and results did not indicate that abnormalities in maternal thyroid function in early pregnancy per se are a major risk factor for birth defects.
The use of ATD for the treatment of hyperthyroidism was discovered in the 1940s and still play a dominant role (18). A main concern about the use of ATD in nonpregnant and pregnant patients is the risk of severe side effects, and treatment of pregnant women is specific for the risk of birth defects (4). Severe birth defects after the use of MMI in early pregnancy were described in the 1970s (19), but it was not until 2011 that the first observational case-control study was published (20). Since then, a series of observational studies have been conducted (6–8, 21–24), and evidence suggests a risk of birth defects associated with the use of MMI and, more recently, with PTU. Nevertheless, the findings differ between studies, and many methodological considerations are important for studying rare outcomes that need to survive until birth. A notable disparity between the studies that reported an association and those that found no association is the number of exposed children. Thus, the studies that found an association with the use of MMI in early pregnancy included >1000 MMI-exposed children (5). Another disparity is the type and timing of outcome assessment in the child. Birth defects are by definition present at birth, but the defects may not be detected clinically at birth, and less severe malformations may be diagnosed at a later age (4).
The current study is an extension of our previous report published in 2013, in which we reported that both MMI and PTU were associated with birth defects diagnosed before the child was 2 years old in a nationwide cohort of children born in Denmark from 1996 to 2008 (7). The finding of an MMI embryopathy was consistent with case reports (25, 26) and a large observational study from Japan published in 2012 (6), but the finding of a risk of birth defects associated with PTU was new and merited further investigation (27). We now had data to extend the cohort to include children born in Denmark during a 20-year period from 1997 to 2016. We strictly applied the same method regarding the definition of exposure and outcome and evaluated the overall prevalence of birth defects as well as subgroups of birth defects. Overall, results corroborated an association with MMI, but the association between maternal use of PTU in early pregnancy and birth defects was attenuated and at the border of statistical significance in the extended cohort. This disparity in the association observed in the previous and the extended cohort calls into question the accuracy of the previous finding and supports a focus on this association to determine whether it was coincidental. Thus, it was an important finding that MMI and PTU revealed associations with the same specific subtypes of birth defects in the extended cohort as in the previous cohort, and the disparity between MMI and PTU for subgroups of birth defects prevailed. This consistency in the associations observed supports an association. For PTU, an association with malformations in the face and neck region and in the urinary system was observed both in the previous and in the extended cohort, although no new cases of PTU-associated malformations of the face and neck region were identified in the extended cohort, whereas two new cases of malformation of the urinary system were seen. It is important to notice that subtypes of malformations are rare, and face and neck malformations occurred in 0.08% of nonexposed children. Thus, even though we extended the cohort with 8 more years, the lack of new cases may reflect the low prevalence of these malformations. This finding emphasizes the importance of future extended follow-up. Another consideration is the registrations of birth defects. If any, we would expect an increased diagnostic activity, which was apparent from the increase in the overall prevalence of birth defects in the extended cohort. However, for the subtypes of birth defects previously associated with the use of ATD, the prevalence did not show a similar change. In addition, the clinical focus on side effects from the use of ATD brought forward by publications in 2012 to 2013 (6, 7) may have influenced awareness and registration, although international clinical guidance was revised in 2016 to 2017 (1, 2), which overlaps the end of the study period in the extended cohort. Furthermore, only a slight change in the ratio of MMI to PTU exposure was observed between the previous and the extended cohort, indicating no major change in clinical practice.
A strength of the current study was the large extended study population, which enabled us to study a rare exposures and outcomes. Another register-based study using Korean National Health Insurance databases was published in 2018 and included >2 million live-born children (8). Similar to our findings, both MMI and PTU exposures were associated with birth defects in this study, and the authors also showed a dose-dependent association with MMI. We did not have information on the dosage of ATD in the Danish nationwide registers, and we do not know whether the women actually took the prescribed drug, but a strength of our study was the detailed assessment of ATD exposure. We considered all prescriptions of ATD in the period before and in early pregnancy, and the last redeemed prescription before pregnancy start defined the type of ATD exposure in the first pregnancy weeks. This methodological aspect is important when indirect measures of exposure from redeemed prescriptions of drugs are used (28). A clinical focus is on the timing of a shift in therapy from MMI to PTU around pregnancy start and the possibility of ATD withdrawal (1, 2). In our previous and extended cohort and in the study from Korea (8), a higher risk of birth defects was observed in women who shifted from MMI to PTU treatment after pregnancy start. We previously evaluated these cases in detail, and although the number of exposed cases was limited, this evaluation showed that the timing of a shift in therapy may be important to reduce MMI exposure (29). Additional studies are needed to evaluate the outcomes of birth defects in women who shifted from MMI to PTU before or during the early pregnancy period as well as the outcomes of ATD withdrawal in early pregnancy, and large study populations are needed to obtain a sufficient number of exposed cases.
The role of maternal thyroid function per se in early pregnancy for the risk of birth defects remains unclarified. A study by Momotani et al. (30) published in 1984 concluded that uncontrolled maternal hyperthyroidism may cause congenital malformations and that the beneficial role of MMI treatment outweighs its teratogenic risks. Only a few studies have addressed this role of maternal hyperthyroidism since then (6, 31). We had the opportunity to investigate the role of maternal thyroid function in two independent birth cohorts. The assessment was based on a single measurement of TSH and fT4 in a blood sample from early pregnancy, and we acknowledge that repeated testing would have been preferable. The overall findings did not indicate that abnormal maternal thyroid function was a risk factor for birth defects. This observation is in line with the study from Japan (6) in which the authors had access to the review of medical records and thereby results of thyroid function testing from women with Graves disease, who became pregnant. We observed that maternal overt hypothyroidism was a risk factor for birth defects in one cohort, and the exposed cases had malformations primarily of the circulatory system. This finding extends a previous case-control study in which maternal hypothyroidism was associated with congenital heart disease in the offspring (32). These observations prompt additional investigations, and it may be speculated that hypothyroidism secondary to overtreatment of maternal hyperthyroidism with ATD could be a risk factor for birth defects. However, we observed similar findings when women who received current treatment of thyroid disease at the time of blood sampling were excluded from the analyses. The mechanisms by which ATD exposure increases the risk of birth defects is not known, and the role of thyroid autoimmunity per se is intriguing and unclarified. However, in the Danish (7) and Swedish (24) nationwide studies we did not see a higher risk of birth defects in women who has a diagnosis of hyperthyroidism and received no ATD treatment in the pregnancy.
From a clinical perspective, results of the current study corroborate a risk of severe birth defects associated with the use of MMI in early pregnancy and support the use of PTU in early pregnancy, as put forward in clinical guidance (1, 2). Additional large studies are needed to investigate the risk associated with PTU and to evaluate outcomes of a shift in therapy. Detailed assessment of the timing of exposure up to and after the start of a pregnancy is crucial to inform this debate.
Acknowledgments
Financial Support: The Obel Family Foundation and the Novo Nordisk Foundation supported this work. The research has been conducted with the Danish National Biobank resource. The Danish National Biobank is supported by the Novo Nordisk Foundation. The Danish National Research Foundation has established the Danish Epidemiology Science Centre, which initiated and created the Danish National Birth Cohort. The cohort is furthermore a result of a major grant from this foundation. Additional support for the Danish National Birth Cohort is obtained from the Pharmacy Foundation, the Egmont Foundation, the March of Dimes Birth Defects Foundation, the Augustinus Foundation, and the Health Foundation.
Additional Information
Disclosure Summary: The authors have nothing to disclose.
Data Availability: Restrictions apply to the availability of data generated or analyzed during this study to preserve patient confidentiality or because they were used under license. The corresponding author will on request detail the restrictions and any conditions under which access to some data may be provided.
Abbreviations:
- ATD
antithyroid drug
- BMI
body mass index
- CMZ
carbimazole
- DNBC
Danish National Birth Cohort
- fT4
free T4
- ICD-10
International Classification of Diseases, 10th Edition
- MBR
Medical Birth Register
- MMI
methimazole
- NDRPC
North Denmark Region Pregnancy Cohort
- NRBC
Nationwide Register-Based Cohort
- PTU
propylthiouracil
