


Abstract
The LH/chorionic gonadotropin receptor (LHCGR) is mainly expressed in gonads and plays important roles in estradiol production, ovulation, and luteal formation. Women with pathogenic LHCGR variants suffer from infertility, and successful fertility treatments for such women have never been reported.
The purpose of this study was to determine whether women with pathogenic LHCGR variants can achieve successful pregnancies through in vitro fertilization.
Three women with LH resistance and infertility and their parents underwent exome sequencing. The biochemical characteristics and functional effects of LHCGR mutation were assessed in transfected human embryonic kidney -293T cells and primary granulosa cells.
All affected women harbored pathogenic LHCGR variants. The LHCGR variants lacked cell surface localization and signal transduction abilities in vitro and in vivo. After dual triggering and prolonging the interval between triggering and oocyte pick-up, all three patients achieved oocytes and high-quality embryos. After frozen embryo transfer, one woman successfully birthed twins, and one woman successfully birthed a live boy. Apart from difficulties in oocyte retrieval, no obvious abnormalities in fertilization or during embryo development and pregnancy were identified in these patients.
This study is, to our knowledge, the first to report successful assisted reproductive treatment of women with pathogenic LHCGR variants using their own oocytes. Our results supported that defects in LHCGR disrupted ovulation but had no effect on fertilization and embryo development.
The LH/chorionic gonadotropin receptor (LHCGR) is a member of the G protein–coupled receptor (GPCR) family and consists of an N-terminal extracellular domain, seven transmembrane domains, and an intracellular C-terminal domain (1, 2).
The LHCGR predominantly activates adenylyl cyclase via G proteins and increases cAMP levels, leading to activation of protein kinase A. Sustained activation of ERK1/2 via a protein kinase A–dependent pathway leads to oocyte maturation, ovulation, and luteinization (3, 4). In addition to its action in gonads, the expression of the LHCGR had been found to be ubiquitous in reproductive organs, including the uterus, oviduct, and so on (5, 6). The action of the LHCGR has been proposed to be involved in the survival of early pregnancy, regulation of endometrial receptivity, and implantation (7, 8).
Pathogenic LHCGR variants have been shown to cause LH resistance in women and in genetically modified mouse models (9–11). Female mice lacking LHCGR were infertile and had decreased estradiol (E2) and progesterone (P) levels, but these levels were not completely suppressed (12). However, female LHCGR−/− mice were fertilized after wild-type ovary transplantation, indicating redundancy of extragonadal LH action (13). Currently, 10 inactivating pathogenic LHCGR variants have been reported in females (9, 14–22). Women carrying a homozygous pathogenic LHCGR variant usually exhibit normal secondary sex characteristics but may have delayed or absent menarche. These women are infertile due to LH resistance. Serum LH levels are usually high in females with pathogenic LHCGR variants, whereas FSH levels are normal or only slightly increased. The serum E2 and P levels in these females are normal during the early to mid-follicular phases but do not reach levels normally observed during the ovulatory or luteal phases. Transvaginal ultrasound (TVUS) has indicated that women with pathogenic LHCGR variants tend to develop ovarian cysts.
To date, only three reports of infertility treatments for women with inactivating LHCGR variants have been published (14, 19, 22). Two of three women with pathogenic LHCGR variants were diagnosed with empty follicle syndrome, and oocyte retrieval failed (14, 19). A compound heterozygous pathogenic LHCGR variant was identified in the third woman who presented with secondary infertility and had previously carried a donor oocyte pregnancy to term. Mature oocytes were obtained from this woman, but no useful embryos were obtained (22). Currently, no live births by women harboring pathogenic LHCGR variants using their own oocytes have been reported (14).
In this study, we identified three novel LHCGR variants in three infertile women. The variants in LHCGR were shown to lack cell surface localization and signal transduction abilities. Using in vitro fertilization (IVF) treatment, high-quality embryos were developed from the women’s own oocytes. After frozen embryo transfer, one woman successfully gave birth to twins, and one woman successfully birthed a live boy. Our data develop a strategy to help women with pathogenic LHCGR variants to conceive. Moreover, the results support that defects in the LHCGR disrupt ovulation but have no physiological significance in extragonadal LHCGR action.
Materials and Methods
Study approval
All work was approved by the Ethics Committee (Institutional Review Board) of the Ninth People’s Hospital of Shanghai and was conducted according to the Declaration of Helsinki for medical research. Patients provided written informed consent.
DNA sequencing
All genomic DNA samples from the patients, their family members, and controls were extracted from peripheral blood using standard methods. We sequenced the exomes of all members of families 1, 2, and 3 using Agilent SureSelect whole-exome capture and Illumina sequencing technology (23). A variant was considered a candidate variant when it was present in an affected woman but absent in her parents and older sister according to the National Heart, Lung, and Blood Institute Exome Sequencing Project database (http://evs.gs.washington.edu/EVS/) and the Exome Aggregation Consortium. Variants in LHCGR were validated by Sanger sequencing with a 3730XL sequencer (Applied Biosystems, Foster City, CA) according to the manufacturer’s instructions.
Amplified targeted genomes for deep sequencing
All genomic DNA was extracted from the granulosa cells of the probands in family 2 (IVF cycle 3) and family 3 (IVF cycle 4). A fragment flanking the p.Arg283* variant site and the p.Asn377Asp variant site was targeted for capture and deep sequencing. Targeted sequence enrichment was performed using the KAPA HiFi HotStart PCR kit (Kapa Biosystems, Boston, MA). The primers p.Arg283* forward (5′-CTGAATTTCTGCCACAGCTTGGGT-3′) and p.Arg283* reverse (5′-CAGAGGCTAATTGCCACGTCATCC-3′) were used for amplification of the p.Arg283* variant product. The primers p.Asn377Asp forward (5′-TGCACATGAGAAAACGAGGCACTG-3′) and p.Asn377Asp reverse (5′-TGGGCTATGACTTCCTTAGGGTCC-3′) were used for amplification of the p.Asn377Asp variant product. Amplified samples were sequenced on the Illumina HiSeq X Ten platform. The variants were visually examined using Integrative Genomics Viewer software (http//www.broadinstitute.org/igv). The experiment was repeated twice. The read depths achieved for the p.Arg283*-targeted regions were 17,481 and 23,317. The read depths achieved for the p.Asn377Asp-targeted regions were 25,961 and 26,975.
Stimulation protocol and oocyte retrieval
For human menopausal gonadotropin (hMG)–stimulated cycles, hMG (Fengyuan Pharmaceutical Company, Anhui, China) was used to stimulate the growth of follicles/cysts when they stopped growing. For natural IVF cycles, no stimulation was administered, and TVUS was used to monitor the growth of follicles/cysts beginning at menstrual cycle (MC) 3. For the fourth IVF cycle in the proband of family 1, 225 IU of hMG combined with a 150-μg desogestrel/20-μg ethinylestradiol tablet (Marvelon, NV Organon, Oss, Netherlands) was administered daily for ovarian stimulation from MC3. The final stage of oocyte maturation was triggered with triptorelin (0.1-0.2 mg; Decapeptyl, Ferring Pharmaceuticals, Malmo, Sweden) and/or human chorionic gonadotropin (hCG; 5000 to 20,000 IU; Lizhu Pharmaceutical Trading Company, Zhuhai, China) when the follicles/cysts had grown to a diameter of 18 mm. TVUS-guided oocyte pick-up (OPU) was conducted 33 to 50 hours after triggering. All follicles/cysts with diameters >10 mm were aspirated. The retrieved oocytes were fertilized in vitro or with intracytoplasmic sperm injection.
Endometrial preparation and freeze-all embryo transfer
Endometrial preparation was initiated with oral ethinylestradiol (Xinyi Pharmaceutical Company, Shanghai, China) on MC4 after TVUS and hormone detection. When the endometrial thickness was >8 mm, embryo transfer was scheduled. The patient began oral administration of 8 mg of E2/40 mg of dydrogesterone (Abbott Healthcare Products, Weesp, Netherlands) and vaginal administration of 400 mg of micronized P (Utrogestan, Laboratoires Besins-Iscovesco, Paris, France) daily. Embryo transfer was performed 3 days later under abdominal ultrasound guidance. P supplementation continued until 12 weeks of pregnancy.
The embryos were examined on the third day to determine the number and regularity of the blastomeres and the degree of embryonic fragmentation using the criteria reported by Cummins et al. (24). All good-quality embryos (including grades 1 and 2 eight-cell embryos) were frozen by vitrification on the third day after oocyte retrieval. Only lower-quality embryos were placed in extended culture until they reached the blastocyst stage. At this stage, only blastocysts with good morphology were frozen on days 5 to 7. The vitrification procedure for freezing cleavage-stage embryos and blastocysts was described previously (25). For thawing, 1.0, 0.5, and 0.0 M sucrose solutions were used sequentially to dilute the cryoprotectant. All verification and warming steps were performed at room temperature with the exception of the first warming step, which was conducted at 37°C.
Hormone analysis
Serum FSH, LH, E2, P, and testosterone (T) levels were measured on MC1 to MC20, the trigger day, and the day after triggering (∼10 hours after injection of GnRH agonist and/or hCG). The hormone levels were measured by chemiluminescence (Abbott Biologicals, Weesp, Netherlands). The lower limits of sensitivity were as follows: FSH, 0.06 mIU/mL; LH, 0.09 mIU/mL; E2, 10.0 pg/mL; and P, 0.1 ng/mL.
Cell culture
Human embryonic kidney (HEK) cells (HEK-293T) were cultured in complete DMEM (Gibco, Grand Island, NY) supplemented with 10% fetal bovine serum (HyClone Laboratories, Logan, UT) at 37°C and 5% CO2 in a humidified incubator.
Preovulatory granulosa cells were separated from red blood cells by centrifugation at 2000 rpm in human lymphocyte separation medium (DingGuo ChangSheng Biotech Company, Beijing, China) for 20 minutes. The cells were then washed three times with 1× PBS and cultured in DMEM/F-12 medium (Gibco) supplemented with 10% fetal bovine serum (HyClone Laboratories) at 37°C and 5% CO2 in a humidified incubator.
Molecular cloning and expression of LHCGR and LHCGR variants
Wild-type human LHCGR cDNA (NM_000233) was synthesized (General Biotech, Shanghai, China) and cloned into the GV141 vector (Genechem, Shanghai, China) to create the fusion protein expression vector pLHCGR-3Flag. The sequences encoding p.Ile585Leufs*16, p.Arg283*, and p.Asn377Asp were amplified from the pLHCGR-3Flag vector using a high-fidelity DNA polymerase (New England Biolabs, Ipswich, MA). The oligonucleotides used for mutagenesis were as follows: p.Ile585Leufs*16 P1, 5′-ACGGGCCCTCTAGACTCGAGCGCCACCATGAAGCAGCGGTTCTCGGCGCTGCAG-3′ and p.Ile585Leufs*16 P2, 5′-AGTCACTTAAGCTTGGTACCGACTGTGATAAGAGGTACTTTGAAGGCAGCTGAGATGGCAAAAAAAGAGGTGCCATGCAG-3′; p.Arg283* P1, 5′- ACGGGCCCTCTAGACTCGAGCGCCACCATGAAGCAGCGGTTCTCGG-3′ and p.Arg283* P2, 5′-AGTCACTTAAGCTTGGTACCGAAAAAGCACAGCAGTGGCTGGG-3′; p.Asn377Asp P1, 5′-ATATTCTAGCCATCATGGGAGACATGACTGTTCTTTTTGTTC-3′ and p.Asn377Asp P2, 5′-ACAAAAAGAACAGTCATGTCTCCCATGATGGCTAGAATATTAATC-3′. These constructs were transiently transfected into HEK-293T cells using Lipofectamine® 2000 (Invitrogen, Carlsbad, CA). LHCGR-3Flag, p.Ile585Leufs*16-3Flag, p.Arg283*-3Flag, and p.Asn377Asp-3Flag expression was verified by Western blotting.
Western blotting
Transfected HEK-293T cells and granulosa cells were lysed in radioimmunoprecipitation assay buffer (50 mmol/L Tris-HCl, 150 mmol/L NaCl, 1% Triton X-100, 0.1% SDS, and 1% deoxycholic acid sodium) and sonicated. The transfected HEK-293T cells and granulosa cell lysates were fractionated using SDS-PAGE gels and subjected to Western blot analysis with a monoclonal anti-Flag antibody (1:3000, Sigma-Aldrich, St. Louis, MO), monoclonal anti-LHCGR antibody (1:500, Novus Biologicals, Centennial, CO), and anti-GAPDH antibody (1:2000, Santa Cruz Biotechnology, Santa Cruz, CA). The membranes were subsequently probed with horseradish peroxidase–conjugated goat anti-mouse IgG (1:2000, Santa Cruz Biotechnology). Phosphorylated ERK1/2 and total ERK1/2 were detected with a rabbit monoclonal anti–phosphorylated p44/42 MAPK (ERK1/2) antibody (1:1000, Cell Signaling Technology, Beverly, MA) and rabbit monoclonal anti-ERK antibody (1:1000, Cell Signaling Technology).
Deglycosylation
The cDNA for the peptide N-glycosidase F (PNGaseF, UniProt ID Q9XBM8) from Elizabethkingia meningoseptica was synthesized and subcloned into a modified pGEX-5X-1 vector as a fusion protein with glutathione S-transferase (GST) at its N terminus; a tobacco etch virus protease recognition sequence was placed between GST and PNGaseF for tag removal. The expression construct was expressed in the BL21 (DE3) rosette Escherichia coli strain and purified with glutathione Sepharose resin. The GST purification tag was removed by digestion with TEV protease, and the purity and yield of the PNGaseF protein were determined by SDS-PAGE. The transfected HEK-293T cells were resuspended in lysis buffer [20 mM HEPES, 150 mM NaCl (pH 7.5)] and sonicated. The lysates were then untreated (control) or treated with PNGaseF at room temperature for 30 minutes.
Immunofluorescence assay
HEK-293T cells were transiently transfected with the LHCGR-3Flag, p.Ile585Leufs*16-3Flag, p.Arg283*-3Flag, and p.Asn377Asp-3Flag vectors using Lipofectamine® 2000 (Invitrogen). The transfected cells were cultured for 48 hours and stimulated with 1 × 10⁵ ng/mL hCG (Sigma-Aldrich) for 2 hours. The unstimulated and stimulated cells were then fixed with 4% paraformaldehyde for 20 minutes and stained with a monoclonal anti-Flag antibody (1:200, Sigma-Aldrich), Alexa Fluor 488–labeled donkey anti-mouse IgG H&L (1:1000, Abcam, Cambridge, MA), and nuclear marker 4′,6-diamidino-2-phenylindole (Sigma-Aldrich). The granulosa cells were fixed as described previously and stained with an anti-LHCGR antibody (1:200, Boster Biological Technology, Wuhan, China), Alexa Fluor 488–labeled goat anti-rabbit IgG H&L (1:1000, Abcam), and nuclear marker 4′,6-diamidino-2-phenylindole (Sigma-Aldrich). Images were acquired using a confocal microscope (Zeiss LSM 710, Carl Zeiss, Oberkochen, Germany).
Functional analysis of the LHCGR variants
HEK-293T cells were transiently transfected with the LHCGR-3Flag, p.Ile585Leufs*16-3Flag, p.Arg283*-3Flag, and p.Asn377Asp-3Flag vectors using Lipofectamine® 2000 (Invitrogen). Forty-eight hours after transfection, the transfected cells were plated in a 24-well plate (2 × 10⁵ cells per well). Twenty-four hours later, the cells were washed twice with serum-free DMEM (Gibco) and then incubated with increasing concentrations of hCG (0 to 1 × 10⁵ ng/mL). The isolated granulosa cells were plated in a 24-well plate. Twenty-four hours later, the cells were washed twice with serum-free DMEM and then incubated with hCG (0 to 1 × 10⁵ ng/mL) and FSH (1000 ng/mL, Sigma-Aldrich). The total cAMP concentration in each well was measured with a specific ELISA kit (R&D Systems, Minneapolis, MN). The experiments were repeated three times, and the results are presented as the mean ± SEM.
Results
All affected females had oligomenorrhea and had been diagnosed with primary infertility of an unknown cause for several years (Table 1). Physical examination revealed that all three patients had normal external female genitalia, pubic hair, and female breast development. An initial hormone profile (MC3) without compound addition revealed high serum FSH and LH levels and a low E2 level (Table 1). The T level was low but within the normal range in all three patients (0.13 to 0.37 ng/mL; normal range, 0.11 to 0.57 ng/mL). Pelvic ultrasound showed a small-sized uterus and enlarged ovaries with multiple large cysts in all three patients (Table 1). The probands in families 2 and 3 had normal anti-Müllerian hormone (AMH) levels for their ages. The proband in family 1, who was young at 28 years of age, showed a low AMH level, possibly because she underwent ovarian surgery twice at the age of 21 years as ovarian tumors were presumed, disrupting her ovarian reserve. Before admission to our center, the probands in families 1 and 2 underwent one IVF cycle at another assisted reproductive technology center, but no oocytes were obtained (Table 2 and 3). The proband in family 3 had no IVF therapy history. The clinical profiles of all affected patients in families 1, 2, and 3 were consistent with those of reported patients with LHCGR mutations.
Clinical Characteristics of Affected Individuals
| Age, y | External Genitalia | Pubic Hair and Breast Development | MCs | Infertility Duration, y | Basal FSH, IU/L | Basal LH, IU/L | Basal E2, pg/mL | Basal Androgen Level | AMH, ng/mL | Pelvic Ultrasound | |
|---|---|---|---|---|---|---|---|---|---|---|---|
| Family 1 | 28 | Normal | Normal | Oligomenorrhea | 3 | 23.97 | 15.23 | 69 | 0.22 | 0.51; 0.14; 0.11 | Small-sized uterus, ovaries with a total of nine follicular cysts (two were 8 mm and 7 were within the 19–22 mm range) |
| Family 2 | 38 | Normal | Normal | Oligomenorrhea | 7 | 11.32 | 22.21 | 17 | 0.13 | 1.12; 1.58 | Small-sized uterus and enlarged ovaries with a total of nine follicular cysts (one was 7 mm and eight were within the 13–28 mm range) |
| Family 3 | 32 | Normal | Normal | Oligomenorrhea | 2 | 10.54 | 30.05 | 18 | 0.22 | 2.21 | Small-sized uterus and ovaries with a total of 11 follicular cysts (3 were 16 mm and 8 were within the 4–9 mm range) |
Description of the Assisted Reproductive Technology Cycles in the Proband of Family 1
| Cycle 0 | Cycle 1 | Cycle 2 | Cycle 3 | Cycle 4 | Cycle 5 | Cycle 6 | Cycle 7 | Cycle 8 | Cycle 9 | Cycle 10 | Cycle 11 | Cycle 12 | Cycle 13 | |
|---|---|---|---|---|---|---|---|---|---|---|---|---|---|---|
| Protocol | Mild stim. | NC | NC | NC | OC + hMG | NC | NC | NC | NC | NC | NC | NC | NC | hMG |
| Daily dose of hMG, IU | 150 | 0 | 0 | 0 | 225 | 0 | 0 | 0 | 0 | 0 | 0 | 0 | 0 | 150 |
| Duration of simulation, d | 6 | 20 | 6 | 11 | 13 | 15 | 0 | 22 | 10 | 14 | 10 | 18 | 6 | 10 |
| Total dose of hMG, IU | 900 | 0 | 0 | 0 | 2925 | 0 | 0 | 0 | 0 | 0 | 0 | 0 | 0 | 1500 |
| Hormones on day of trigger | ||||||||||||||
| Serum LH level, IU/L | 21.89 | 18.52 | 18.04 | 11.87 | 1.62 | 33.71 | 17.91 | 24.18 | 23.72 | 10.71 | 19.58 | 16.94 | 27.41 | 11.4 |
| Serum E2 level, pg/mL | 33 | 102 | 60 | 82 | 82 | 61 | 130 | 101 | 90 | 91 | 110 | 84 | 78 | 86 |
| Serum P level, ng/mL | 3.19 | 1.4 | 0.1 | 1.2 | 0.7 | 1.0 | 1.1 | 2.0 | 0.7 | 0.9 | 1.9 | 0.6 | 0.7 | 0.9 |
| Serum T level, ng/mL | — | — | 0.2 | 0.17 | 0.28 | 0.15 | 0.14 | 0.17 | 0.18 | 0.19 | 0.18 | 0.2 | 0.2 | 0.8 |
| No. of total follicles | 4 | 3 | 5 | 6 | 3 | 2 | 6 | 4 | 4 | 3 | 5 | 4 | 6 | 4 |
| No. of leading follicles (≥18 mm) right + left | 1 | 1 | 4 | 5 | 2 | 1 | 6 | 3 | 4 | 3 | 5 | 4 | 4 | 4 |
| Ovulation trigger (dose) | 1000IU hCG | 0.1 mg of T | 0.1 mg of T | 0.1 mg of T | 5000 IU of hCG | 0.2 mg of T | 0.2 mg of T | 0.2 mg of T | 5000 IU of hCG | 0.1 mg of T + 5000 IU of hCG | 0.1 mg of T + 5000 IU of hCG | 0.1 mg of T + 5000 IU of hCG | 0.1 mg of T + 5000 IU of hCG | 0.1 mg of T + 5000 IU of hCG |
| Time interval between hCG administration and oocyte retrieval, h | 24 | 33 | 35 | 37 | 35 | 37 | 39 | 39 | 39 | 39 | 40 | 40 | 40.5 | 40.2 |
| No. of oocytes retrieved | 0 | 1 | 0 | 3 | 0 | 0 | 1 | 0 | 0 | 0 | 1 | 2 | 1 | 2 |
| No. of embryos developed | 0 | 0 | 0 | 0 | 0 | 0 | 1 | 0 | 0 | 0 | 1 | 1 | 1 | 2 |
| Hormones on day after trigger | ||||||||||||||
| Serum hCG level, IU/L | — | — | — | — | 97.00 | — | — | — | 198.33 | 113.11 | 168.94 | 291.91 | 140.20 | 194 |
| Serum LH level, IU/L | — | 157.85 | 62.33 | 104.44 | 2.49 | 122.87 | 194.24 | 186.62 | 18.39 | 83.54 | 116.14 | 150.89 | 120.24 | 140.0 |
| Serum E2 level, IU/L | — | 86 | 66 | 99 | 75 | 77 | 199 | 123 | 79 | 102 | 115 | 86 | 93 | 94.0 |
| Serum P level, ng/mL | — | 4.8 | 0.16 | 1.2 | 0.5 | 1.8 | 9.9 | 6.2 | 0.7 | 5.5 | 6.4 | 4.0 | 4.2 | 3.8 |
| Serum T level, ng/mL | — | — | 0.3 | 0.28 | 0.29 | 0.18 | 0.2 | 0.22 | 0.18 | 0.21 | 0.13 | 0.15 | 0.21 | 0.21 |
Cycle 0 represents the previous IVF cycles in other IVF center.
Abbreviations: OC, oral contraception; NC, natural cycle; stim., stimulation; T, triptorelin.
Description of the Assisted Reproductive Technology Cycles of the Proband of Families 2 and 3
| Family 2 | Family 3 | |||||||||||
|---|---|---|---|---|---|---|---|---|---|---|---|---|
| Cycle 0 | Cycle1 | Cycle 2 | Cycle 3 | Cycle 4 | Cycle 1 | Cycle 2 | Cycle 3 | Cycle 4 | Cycle 5 | Cycle 6 | ||
| Protocol | Ultra-long protocol | NC | NC | NC | HMG | HMG | HMG | NC | HMG | HMG | HMG | |
| FSH, daily dose IU | 300/225 | 0 | 0 | 0 | 0 | 0 | 0 | 0 | 0 | 0 | 0 | |
| LH, daily dose IU | 75 | 0 | 0 | 0 | 0 | 0 | 0 | 0 | 0 | 0 | 0 | |
| hMG, daily dose IU | 0 | 0 | 0 | 0 | 150 | 150 | 75 | 0 | 150 | 225 | 225 | |
| Duration of simulation, d | 20 | 14 | 10 | 15 | 4 | 8 | 5 | 0 | 13 | 12 | 13 | |
| Total dose of FSH, IU | 4950 | 0 | 0 | 0 | 0 | 0 | 0 | 0 | 0 | 0 | 0 | |
| Total dose of LH, IU | 1050 | 0 | 0 | 0 | 0 | 0 | 0 | 0 | 0 | 0 | 0 | |
| Total dose of hMG, IU | 0 | 0 | 0 | 0 | 600 | 1200 | 375 | 0 | 1950 | 2700 | 2925 | |
| Hormones on the day of trigger | ||||||||||||
| Serum LH level, IU/L | 1.06 | 24.98 | 20.51 | 25.99 | 23.62 | 16.71 | 29.63 | 26.72 | 22.21 | 16.34 | 18.30 | |
| Serum E2 level, pg/mL | 106 | 53 | 36.00 | 42.00 | 39.00 | 51.00 | 27.00 | 32.00 | 55.00 | 68.0 | 58 | |
| Serum P level, ng/mL | 1.88 | 1.3 | 1.3 | 0.9 | 0.5 | 0.4 | 0.2 | 0.3 | 0.4 | 0.4 | 0.3 | |
| Serum T level, ng/mL | — | 0.37 | 0.2 | — | — | — | 0.20 | — | — | 0.22 | — | |
| No. of total follicles | 8 | 6 | 8 | 5 | 4 | 7 | 5 | 1 | 12 | 8 | 9 | |
| No. of the leading follicles (≥18 mm) right + left | 3 | 1 | 3 | 2 | 1 | 3 | 1 | 1 | 3 | 4 | 5 | |
| Ovulation triggering (dose) | 10,000 IU of hCG | 0.1 mg T + 5000 IU of hCG | 0.1 mg of T + 10,000 IU of hCG | 0.1 mg of T + 10,000 IU of hCG | 0.1 mg of T + 10,000 IU of hCG | 0.1 mg of T + 5000 IU of hCG | 0.1 mg of T + 5000 IU of hCG | 0.1 mg of T + 10,000 IU of hCG | 0.1 mg of T + 20,000 IU of hCG | 0.1 mg of T + 20,000 IU of hCG | 0.1 mg of T + 20,000 IU of hCG | |
| Time interval between hCG administration and oocyte retrieval, h | 37 | 41 | 41 | 41 | 42 | 40 | 41 | 43 | 48 | 49 | 50 | |
| No. of oocytes retrieved | 0 | 0 | 1 | 2 | 1 | 0 | 0 | 0 | 1 (GV) | 1 (GV) | 1 (GV) | |
| No. of embryos developed | 0 | 0 | 1 | 0 | 1 | 0 | 0 | 0 | 0 | 1 | 1 | |
| Hormones on day after trigger | ||||||||||||
| Serum hCG level, IU/L | — | 130.6 | 197.89 | 285.88 | 216.48 | 132.6 | 179.86 | 427.21 | 759.7 | 1189.4 | 746.2 | |
| Serum LH level, IU/L | — | 108.14 | 136.14 | 117.84 | 112.11 | 62.87 | 82.59 | 92.6 | 83.02 | 60.61 | 60.06 | |
| Serum mE2 level, IU/L | — | 59 | 52.00 | 47.00 | 44.00 | 65.00 | 30.00 | 31.00 | 84.00 | 97.00 | 71.00 | |
| Serum P level, ng/mL | — | 2.8 | 4.6 | 3.5 | 1.6 | 0.6 | 0.3 | 0.8 | 0.6 | 0.4 | 0.3 | |
| Serum T level, ng/mL | — | 0.18 | 0.18 | — | 0.19 | — | 0.19 | — | — | — | — | |
Cycle 0 represents the previous IVF cycles in other IVF center.
Abbreviations: NC, natural cycle; T, triptorelin.
After exome sequencing, bioinformatics filtering analysis, and homozygosity mapping, LHCGR was the only gene that segregated with the phenotype in each of the families. Sanger sequencing confirmed variants in LHCGR in these families (Fig. 1A). The proband in family 1 had a c.1753_1756delATCT variant (p.Ile585Leufs*16), resulting in a frameshift mutation and a premature stop codon (Fig. 1). Her aunt and both parents were heterozygous for this mutation. No mutations in the LHCGR gene were detected in her older sister or younger brother. The proband in family 2 had a novel homozygous single-nucleotide insertion variant (c.846_847insT; p.Arg283*), which produced a frameshift mutation and premature termination at codon 283 (Fig. 1). Her normal parents were heterozygous for this mutation, and her normal sister did not have this variant. Analysis of the proband in family 3 revealed a homozygous substitution of guanine for adenine at nucleotide 1129 of the LHCGR cDNA (c.1129A>G; p.Asn377Asp) (Fig. 1). Her parents were heterozygous for this mutation, and her normal brother did not have the mutation.
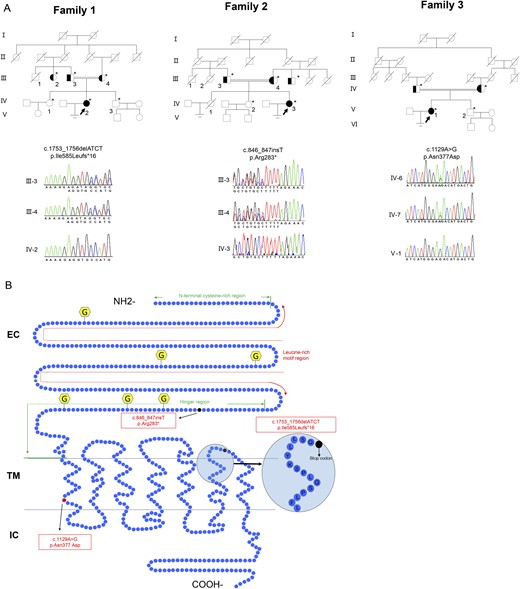
Family pedigrees of patients with infertility and LHCGR variants. (A) The pedigrees of families 1, 2, and 3. The arrows indicate the probands in families 1, 2, and 3. Sanger sequencing chromatograms are shown near the pedigrees. Solid symbols denote the affected subjects, open symbols denote unaffected subjects, half-solid symbols denote heterozygote subjects, and symbols with a slash denote persons who have died. Squares denote male family members, and circles denote female family members. The double line indicates consanguinity. Asterisks indicate the family members who underwent genetic testing. (B) Schematic representation of the LHCGR structure and location of the variants. LHCGR had a ligand-binding extracellular domain (EC) at the amino terminus and a transmembrane (TM) domain and an intracellular (IC) domain at the carboxyl tail. The EC domain contains the N-terminal cysteine-rich region, leucine-rich motif region, and hinge region. Three novel identified variants are demonstrated. The dark solid circle indicates the stop codon. The red solid circle indicates the replaced amino acid. The yellow hexagonal forms indicate the N-linked glycosylation sites.
Because the LHCGR signaling pathway is essential for ovulation, women with LHCGR mutations are thought to have no chance of pregnancy using their own oocytes, even via IVF treatment (14). However, through TVUS monitoring, we identified some follicle-like cysts that grew at the same speed as the follicles in the proband of family 1. First, six IVF cycles were performed in the proband of family 1; the choice of protocol and/or trigger was random (Table 2). During the sixth IVF cycle, we retrieved one oocyte using a natural cycle and produced a high-quality embryo. We noticed that the LH level was high (194.24 IU/L) after triptorelin triggering, and the retrieval time was 39 hours after triggering in the sixth IVF cycle of the proband of family 1. Therefore, no downregulation of the pituitary, high LH after triptorelin triggering, and delaying the retrieval time were helpful for oocyte retrieval. We preferred to use the natural cycle in further cycles, but added hMG to stimulate the follicle when TVUS indicated that the follicle had stopped growing. Because the LH level after triptorelin triggering was not stable, we used a dual trigger with hCG in the further cycles. However, we were unable to retrieve another oocyte at 39 hours after a dual trigger with 5000 IU of hCG in patient 1. We analyzed all nine IVF cycles of the proband of family 1 and considered prolonging the interval between triggering and OPU to determine the optimal point in the IVF cycle for obtaining oocytes and good-quality embryos in patients with pathogenic LHCGR variants. We then performed IVF cycles using an adjusted strategy for ovarian stimulation and triggering as follows: a dual trigger with 5000 IU of hCG and prolongation of the interval between triggering and OPU to >40 hours (Fig. 2). Using this strategy, four more IVF cycles were performed, and six mature oocytes were retrieved. Four good-quality embryos developed, and one lower-quality embryo was successfully cultured up to day 7 and reached the blastocyst stage. Two frozen embryos from the 13th IVF cycle were thawed and transferred to the uterus with the endometrium prepared using a hormone replacement therapy protocol. The patient tested positive for β-hCG 14 days later, and a twin pregnancy was confirmed in the sixth week of gestation on a pelvic ultrasound scan. At 37 weeks of gestation, the patient delivered a live female newborn and a live male newborn by planned cesarean section (for twin pregnancy). Both children are currently 2 years old and healthy. The proband of family 2 was first treated using dual triggers, including 5000 IU of hCG, but no oocytes were retrieved 40 hours after triggering. Then, three IVF cycles were performed with dual triggers, including 10,000 IU of hCG (Table 3), and two mature oocytes were retrieved. Two good-quality embryos developed and were frozen by vitrification. After transferring two embryos, she failed to conceive. The proband of the third family was first treated with 5000 IU of hCG for triggering and then underwent oocyte aspiration 40 hours later, but no oocyte was retrieved. Then, we tried to retrieve an oocyte using a higher dose of hCG and delayed the retrieval time. Through four cycles, only one germinal vesicle (GV) oocyte was retrieved 48 hours after a dual trigger with 20,000 IU of hCG. Then, we performed two more IVF cycles using a dual trigger with 20,000 IU of hCG and prolonging the interval between triggering and OPU to >48 hours. In total, three GV oocytes were retrieved from the proband of family 3 (Table 3). These oocytes were matured in vitro and developed into two top-quality embryos after intracytoplasmic sperm injection. After transferring one embryo according to the previously described protocol, the patient tested positive for β-hCG 14 days later, and a singleton pregnancy was confirmed in the sixth week of gestation on a pelvic ultrasound scan. At 39 weeks of gestation, the patient delivered a live male newborn by planned cesarean section (for macrosomia). The newborn was normal (weight, 4480 g; length, 53 cm; Apgar score, 10/10/10).
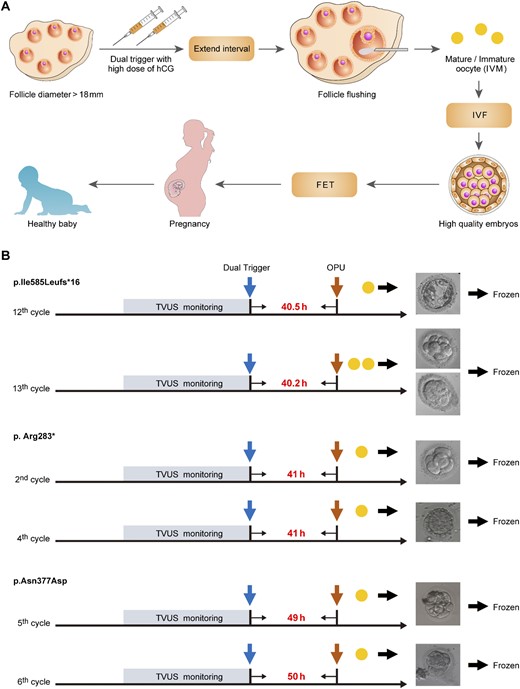
IVF treatment strategy for patients with pathogenic LHCGR variants. (A) The IVF treatment strategy for the patients with pathogenic LHCGR variants. IVM, in vitro maturation. (B) Typical IVF cycles of the patients with homozygous LHCGR variants performed using this strategy. The blue arrow indicates dual triggering, and the brown arrows indicate the times at which OPU occurred. The yellow solid circles indicate the retrieved oocytes. The time intervals between triggering and oocyte retrieval are shown between the blue and brown arrows.
To demonstrate functional changes in the p.Ile585Leufs*16, p.Arg283*, and p.Asn377Asp variants, all of the variants and wild-type LHCGR were expressed in HEK-293T cells. Western blotting showed several bands of different intensities and molecular masses (MSs) in the HEK-293T cells expressing wild-type LHCGR (predicted MS of ∼75 kDa), which may represent glycosylated and multimerized forms (26–28). However, only one band at an MS of ∼72 kDa was present in the HEK-293T cells expressing p.Ile585Leufs*16; this size is notably larger than the predicted MS (∼66 kDa) (Fig. 3A). The p.Arg283* mutant exhibited two bands at ∼35 kDa and 30 kDa. To verify that the shifted bands for p.Ile585Leufs*16 and p.Arg283* were due to partial N-linked glycosylation, we performed N-glycosidase F treatment. Treatment of p.Ile585Leufs*16 with N-glycosidase F for 30 minutes resulted in the appearance of a 66-kDa protein. Moreover, p.Arg283* exhibited only one band at ∼30 kDa (Fig. 3B). These results indicated that N-linked glycosylation of p.Ile585Leufs*16 and p.Arg283* variants existed. Moreover, we observed decreased p.Ile585Leufs*16 and p.Asn377Asp protein expression compared with that of the wild-type LHCGR protein in the cell lysates in three independent experiments even when equal amounts of the expressing vector were transfected, revealing that these mutations can result in decreased stability of the mutant protein or affect the stability or translational efficiency of its corresponding mRNA. Confocal microscopy analyses demonstrated that the wild-type LHCGR and the LHCGR variants had different expression patterns; the wild-type LHCGR was mainly located at the cell membrane, whereas the p.Ile585Leufs*16, p.Arg283*, and p.Asn377Asp variants were mainly retained intracellularly (Fig. 3C). The functional significance of these LHCGR variants was first evaluated using in vitro mutagenesis transfection analysis in HEK-293T cells. As shown in Fig. 3D, cAMP was robustly increased in cells expressing wild-type LHCGR after stimulation with different hCG concentrations; however, cAMP accumulation was not observed in the cells expressing the p.Ile585Leufs*16, p.Arg283*, and p.Asn377Asp variants. Moreover, phosphorylation of ERK was disrupted in cells expressing the p.Ile585Leufs*16, p.Arg283*, and p.Asn377Asp mutants after high-dose hCG stimulation (Fig. 3E). Because a high dose of hCG allowed mature oocytes to be obtained from these women and the development of high-quality embryos, we tested whether cAMP accumulated after long-term stimulation with a high hCG concentration in vitro. No cAMP accumulation or phosphorylation of ERK was observed in cells expressing the LHCGR mutants during 18 hours of stimulation with 1 × 10⁵ ng/L hCG compared with that in cells transfected with the empty vector (Fig. 4). These results indicated that the function of the p.Ile585Leufs*16, p.Arg283*, and p.Asn377Asp variants was disrupted.
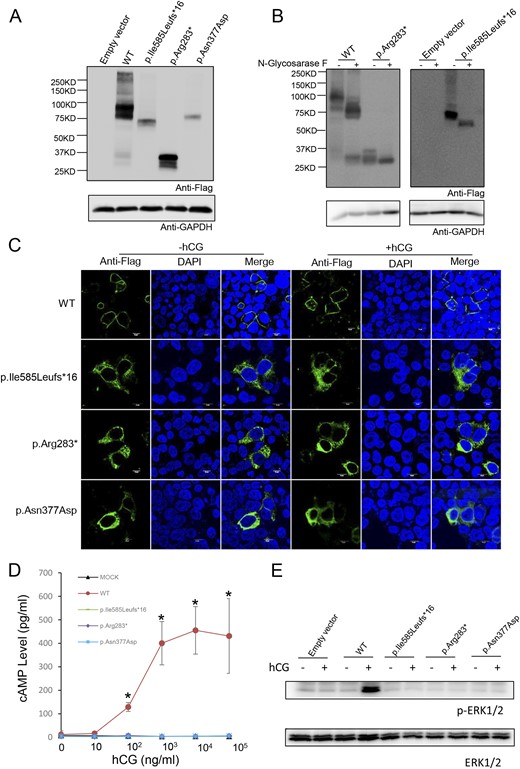
Expression and bioactivity of wild-type LHCGR and LHCGR variants in vitro. (A) Western blot analysis of the protein expression of wild-type LHCGR and LHCGR variants in HEK-293T cells transfected with wild-type LHCGR (WT) and p.Ile585Leufs*16-, p.Arg283*-, and p.Asn377Asp-expressing vectors. (B) N-glycosidase F treatment of LHCGR and LHCGR variants. The indicated samples were treated with N-glycosidase F and detected by Western blotting. (C) The subcellular location of the wild-type LHCGR and LHCGR variants with and without hCG (1 × 10⁵ ng/mL) stimulation. Magnification ×1200. White scale bar 10µm. (D) Response of cAMP to stimulation with increasing hCG concentrations in HEK-293T cells transfected with WT, p.Ile585Leufs*16, p.Arg283*, p.Asn377Asp, or empty vector. ★P < 0.05. (E) The ERK phosphorylation state after hCG stimulation (1 × 10⁵ ng/mL) in HEK-293T cells transfected with WT, p.Ile585Leufs*16, p.Arg283*, p.Asn377Asp, or empty vector.
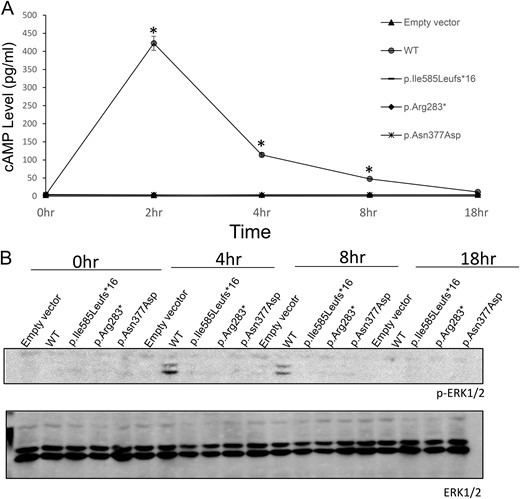
Expression and bioactivity of the wild-type (WT) LHCGR and LHCGR variants. (A) Time course of cAMP accumulation in HEK-293T cells transfected with WT LHCGR, p.Ile585Leufs*16, p.Arg283*, p.Asn377Asp, and empty vector. The cAMP accumulation in response to hCG stimulation (1 × 10⁵ ng/mL) was measured over various intervals up to 18 hours. *P < 0.05. (B) Time course of ERK phosphorylation in HEK-293T cells transfected with WT LHCGR, p.Ile585Leufs*16, p.Arg283*, p.Asn377Asp, and empty vector.
To assess whether mosaicisms existed in the presence of a low proportion of nonmutated follicles in the ovaries, we performed PCR amplification of the fragment flanking the LHCGR variant sites using the granulosa cells from the probands in families 2 and 3 from whom more than one oocyte was retrieved. The amplified targeted sequences were deep sequenced (>1000×). The p.Arg283* and p.Asn377Asp mutations were found by deep sequencing in 100% of the sequence reads (Fig. 5). These results indicated that no mosaicisms existed in the presence of a low proportion of nonmutated follicles in the ovaries. Furthermore, we collected and cultured preovulatory granulosa cells from follicular fluid obtained during OPU. Western blotting analysis showed that p.Arg283* and p.Asn377Asp were expressed in the preovulatory granulosa cells from the probands of families 2 and 3, respectively (Fig. 6A). Moreover, LHCGR did not localize to the membrane in the preovulatory granulosa cells from the probands of families 2 and 3 (Fig. 6B), and no cAMP accumulation was observed after stimulation with hCG (Fig. 6C). However, cAMP accumulation was observed after FSH stimulation, indicating that the FSH signaling pathway was intact (Fig. 6D). Even phosphorylation of ERK in the preovulatory granulosa cells did not increase after hCG stimulation. However, the basal level of ERK phosphorylation was high in the luteinized granulosa cells from the probands of families 2 and 3 compared with that in preovulatory granulosa cells from normal women (Fig. 6E).
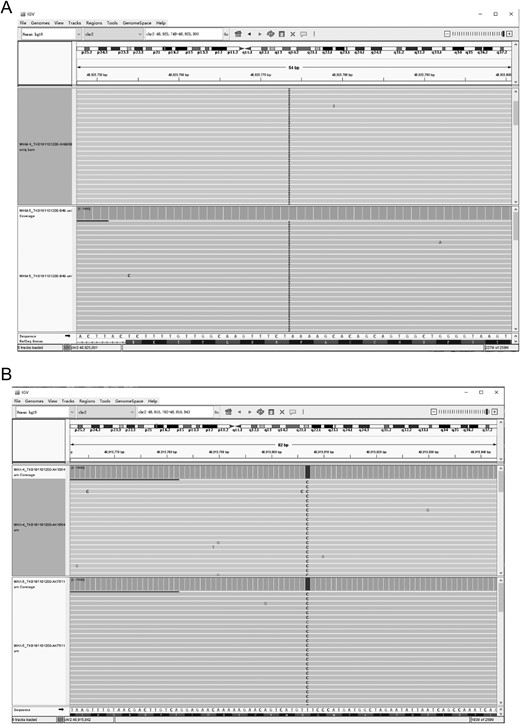
Integrative Genomics Viewer (IGV) snapshots of LHCGR variants in granular cells. (A) IGV snapshot of the p.Arg283* variant in granular cells from the proband in family 2 at two time points (Chr 2:489255703-4892884, LHCGR). I, insertion. (B) IGV snapshot of the p.Asn377Asp variant in granular cells from the proband in family 3 at two time points (Chr 2:48915738-48915866, LHCGR).
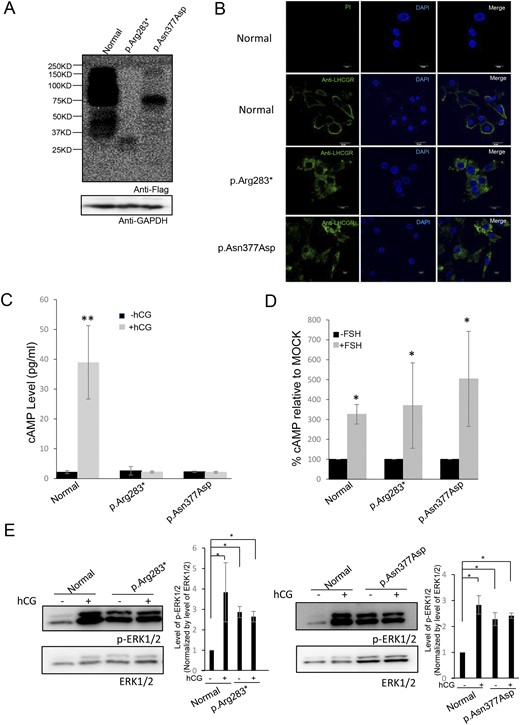
Expression and bioactivity of wild-type LHCGR and LHCGR variants in preovulatory granulosa cells. (A) Western blot detection of the expression of LHCGR and variants in granulosa cells from normal females and the probands in families 2 and 3. (B) immunofluorescence staining of LHCGR and variants in granulosa cells from normal females and the probands in families 2 and 3. Magnification ×600. White scale bar 20µm. (C) cAMP accumulation in response to hCG stimulation in granulosa cells from normal females and the probands in families 2 and 3. (D) cAMP accumulation in response to FSH stimulation in granulosa cells from normal females and the probands in families 2 and 3. (E) ERK phosphorylation in response to hCG stimulation in granulosa cells from normal females and the probands in families 2 and 3. *P < 0.05, **P < 0.01.
Discussion
Women with pathogenic LHCGR variants are resistant to LH and present low E2 levels and enlarged ovaries with cysts. Because the LHCGR signaling pathway is essential for ovulation, women with LHCGR mutations are thought to have no chance of pregnancy using their own oocytes, even via IVF treatment (14).
In this study, we identified three novel pathogenic LHCGR variants (p.Ile585Leufs*16, p.Arg283*, and p.Asn377Asp). All patients with these variants exhibited low E2 and P levels, enlarged ovaries with cysts, oligomenorrhea, and infertility, which is consistent with a previous report. All women reported to have inactivating LHCGR variants show E2 and P production, but most do not exhibit the levels observed during the ovulatory or luteal cycle phases in normal women (14). Consistent with this phenotype, E2 and P levels are decreased but not completely suppressed in female mice lacking LHCGR. The residual E2 in plasma was presumably due to the unpaired FSH signal-induced conversion of androgens in the growing follicles (11, 12). Patients with LHCGR mutations exhibit amenorrhea or oligomenorrhea, unlike patients with FSHR variants, who show only amenorrhea, and the residual E2 may explain the oligomenorrhea (29). The normal but low T levels in all three patients may be due to LH-independent synthesis of T in the adrenal gland and theca cells (30, 31). Notably, all three patients with LHCGR mutations showed preovulatory-sized polycysts (≥16 mm), differing from polycystic ovarian syndrome patients, who have small follicles (5 to 7 mm).
The p.Ile585Leufs*16, p.Arg283*, and p.Asn377Asp variants lost their membrane localization ability and failed to increase cAMP and phosphorylated ERK levels in transfected HEK-293T cells and granulosa cells. These results indicated that LHCGR function was disrupted in these probands of families 1, 2, and 3. The p.Asn377Asp variant had a missense mutation within the first transmembrane region of the LHCGR. Even without truncation, missense variants of the GPCR are becoming increasing recognized to frequently result in protein misfolding and are retained in the endoplasmic reticulum (ER) for destruction (32). The retrieval of only GV oocytes from patient 3, the very low oocyte retrieval rate, and the absence of premature ovulation after dual triggering with a high dose of hCG and delaying the retrieval time were consistent with previous results showing that proper LHCGR function is necessary for preovulatory maturation and ovulation. Notably, however, P levels were slightly increased in the probands of families 1 and 2 after dual triggering with a high dose of hCG. Furthermore, during the fourth IVF cycle of the proband of family 1, we attempted to decrease LH and maintain a low LH level in this patient using oral contraceptives and hMG to stimulate follicle growth; nonetheless, no oocytes were obtained. However, during the cycles with high LH levels, after dual triggering with high doses of hCG and delaying the retrieval time, a small proportion of oocytes were retrievable via follicle flushing. These results supported that these patients maintained a small response to a high dose of hCG, indicating that the LHCGR variants were active to some degree.
A high dose of agonist was previously shown to induce a small response from mutant LHCGR and other GPCRs, such as the GnRH receptor (21, 33), but the detailed mechanism underlying this effect remains unclear. Interestingly, all mutant LHCGR variants found in this study contained leucine-rich repeats in the extracellular domain, which had high-affinity hormone binding activity. Intracellularly trapped mutants retain a high affinity for binding hCG unless the hormone binding site is disturbed (13). Moreover, changing conditions, such as temperature, can allow partially misfolded LHCGR to fold properly and be expressed in a functional form on the cell surface (34). In addition to possible expression on the cell membrane, GPCRs retained in the ER can still be functionally active, and highly truncated GPCRs may also be functionally active (35). Constitutive activation of ERK1/2 can be detected in the ER of HEK-293T cells expressing ghrelin receptors (36). Although the precise localization and physiological relevance remain uncertain, ERK1/2 phosphorylation was increased in preovulatory granulosa cells from the probands of families 2 and 3 before hCG stimulation. These observations support that the LHCGR variants found in this study may respond slightly to high hCG stimulation in vivo, leading to slow and weak cumulus expansion stimulation. The primary granulosa cells from the patients with pathogenic LHCGR variants were luteinized, and the number was limited, which complicated analysis of the detailed mechanism. To better understand the mechanism in detail, newly developed knock-in mice expressing these mutants should be established.
In conclusion, to our knowledge, this is the first report of successful oocyte retrieval followed by the development of top-quality embryos from women with LHCGR mutations, two of whom conceived and had successful live births. The IVF/frozen embryo transfer strategy will be a useful treatment of infertility patients with LHCGR mutations. The embryos that developed from oocytes harvested from the patients with pathogenic LHCGR variants were not obviously different from those developing from oocytes harvested from normal women, and the babies were healthy. These observations indicated that LHCGR defects disrupt ovulation but have no effect on further fertilization or embryo development. The function of the LHCGR still requires further study as mutant LHCGR, which presumably loses its membrane localization capacity, retains partial activity in vivo. A better understanding of the oocyte maturation hormonal microenvironment may lead to better strategies for treating certain patients with infertility.
Acknowledgments
Financial Support: This work was supported by National Key R&D Program of China (Grant 2018YFC1003000), the National Natural Science Foundation of China (Grants 81873856, 81771533, and 81771649), the Clinical Research Program of the Ninth People’s Hospital, Shanghai Jiao Tong University School of Medicine (Grant JYLJ035), and the innovative research team of high-level local universities in Shanghai.
Author Contributions: Y.K. conceived and designed the study. X.L., Z.Y., R.C., S.K., L.W., and L.S. contributed to the patients’ therapies and the experimental analysis. Y.W., Y.X., H.T., Q.C., J.Q., B.L., B.C., Y.C., and Q.L. were responsible for collection of the data. L.W. performed the sequence analysis of family 1. All authors interpreted the findings and critically revised the manuscript for important intellectual content.
Additional Information
Disclosure Summary: The authors have nothing to disclose.
Data Availability: All data generated or analyzed during this study are included in this published article or in the data repositories listed in References.
Abbreviations:
- AMH
anti-Müllerian hormone
- E2
estradiol
- ER
endoplasmic reticulum
- GPCR
G protein–coupled receptor
- GST
glutathione S-transferase
- GV
germinal vesicle
- hCG
human chorionic gonadotropin
- HEK
human embryonic kidney
- hMG
human menopausal gonadotropin
- IVF
in vitro fertilization
- LHCGR
LH/chorionic gonadotropin receptor
- MC
menstrual cycle
- MM
molecular mass
- OPU
oocyte pick-up
- P
progesterone
- T
testosterone
- TVUS
transvaginal ultrasound
References and Notes
Author notes
X.L., Z.Y., R.C., S.K., L.W., and L.S. contributed equally to this study.
