


Abstract
Cosyntropin [ACTH (1–24)] stimulation during adrenal vein (AV) sampling (AVS) enhances the confidence in the success of AV cannulation and circumvents intraprocedure hormonal fluctuations. Cosyntropin’s effect on primary aldosteronism (PA) lateralization, however, is controversial.
To define the major patterns of time-dependent lateralization, and their determinants, after cosyntropin stimulation during AVS.
We retrospectively studied patients with PA who underwent AVS before, 10, and 20 minutes after cosyntropin stimulation between 2009 and 2018. Unilateral (U) or bilateral (B) PA was determined on the basis of a lateralization index (LI) value ≥4 or <4, respectively. Available adrenal tissue underwent aldosterone synthase–guided next-generation sequencing.
PA lateralization was concordant between basal and cosyntropin-stimulated AVS in 169 of 222 patients (76%; U/U, n = 110; B/B, n = 59) and discordant in 53 patients (24%; U/B, n = 32; B/U, n = 21). Peripheral and dominant AV aldosterone concentrations and LI were highest in U/U patients and progressively lower across intermediate and B/B groups. LI response to cosyntropin increased in 27% of patients, decreased in 33%, and remained stable in 40%. Baseline aldosterone concentrations predicted the LI pattern across time (P < 0.001). Mutation status was defined in 61 patients. Most patients with KCNJ5 mutations had descending LI, whereas those with ATP1A1 and ATP2B3 mutations had ascending LI after cosyntropin stimulation.
Patients with severe PA lateralized robustly regardless of cosyntropin use. Cosyntropin stimulation reveals intermediate PA subtypes; its impact on LI varies with baseline aldosterone concentrations and aldosterone-driver mutations.
Primary aldosteronism (PA) is the most common cause of secondary hypertension (1, 2). PA amplifies the risks for cardiovascular and renal complications, beyond those mediated through hypertension alone (3–5). Broadly, PA has been subtyped into bilateral (B) hyperaldosteronism and unilateral (U) PA, the latter typically being the result of an aldosterone-producing adenoma (APA) (6, 7). Unilateral adrenalectomy is the only potentially curative treatment of APA, and it confers substantial long-term benefits to patients with APA (8–11). Adrenal vein sampling (AVS) is the standard of care for determining the relative contribution of the two adrenal glands to aldosterone excess in patients with PA (7, 12, 13). The optimal AVS protocol and data interpretation of AVS, however, remain controversial.
Cosyntropin, a synthetic adrenocorticotropic hormone peptide, stimulates cortisol synthesis, and it has been used during AVS, in a bolus and/or continuous IV infusion, to enhance confidence in the success of adrenal vein (AV) catheterization and to circumvent potential intraprocedural hormonal fluctuations (13–18). Data from reports describing the relative effects of cosyntropin on the autonomous vs normal zona glomerulosa cells, however, are not consistent. Some studies have suggested that cosyntropin might stimulate aldosterone secretion from nonautonomous cortical areas, potentially obscuring an APA (16, 19–22). APAs, however, might also respond to cosyntropin (17, 23, 24). We are experienced in AVS, performed with and without cosyntropin, and we sought to characterize the impact of cosyntropin on PA lateralization and to identify the factors that influence the patterns of time-dependent aldosterone lateralization in response to cosyntropin stimulation.
Materials and Methods
Study participants
We retrospectively studied all patients with confirmed PA who underwent AVS at the University of Michigan between January 2009 and August 2018. We reviewed the demographic, laboratory, imaging, and pathological data for all patients. Aldosterone synthase (CYP11B2) immunohistochemistry (IHC)-guided next-generation sequencing was performed on available paraffin-embedded adrenal tissue, as previously described (25, 26). This study was conducted with University of Michigan Institutional Review Board approval. A waiver of informed consent was granted for the retrospective study; histopathological studies, including IHC and genetic studies, were performed after written informed consent was obtained from all participants.
Clinical assessment
The diagnosis of PA was made on the basis of Endocrine Society guidelines diagnostic criteria (7). Plasma aldosterone concentration, plasma renin activity, and serum cortisol concentration were measured by immunoassays, as previously described (13). Primary Aldosteronism Surgery Outcome criteria (11) were used to evaluate clinical and biochemical benefits after unilateral adrenalectomy.
Simultaneous AVS was performed by experienced interventional radiologists at the University of Michigan, as previously reported (13). AV and inferior vena cava (IVC) samples were obtained before and 10 and 20 minutes after cosyntropin injection. Successful catheterization was defined by a selectivity index value (derived from AV/IVC cortisol concentrations) ≥2 before and ≥5 after cosyntropin administration. To study the temporal effect of cosyntropin on PA lateralization, only patients with successful catheterization at all three time points were included in this study. The source(s) of aldosterone excess was assessed by the lateralization index (LI), defined as the ratio of aldosterone to cortisol in the dominant AV divided by the aldosterone-to-cortisol ratio in the nondominant AV. U or B PA was determined on the basis of an LI value of ≥4 or <4, respectively. A contralateral index (aldosterone-to-cortisol ratio between the nondominant AV and IVC) value <1 indicated contralateral suppression. Where lateralization data are reported in this article, they are identified as U or B.
Statistical analysis
Categorical parameters were compared between groups using the χ2 or Fisher exact test, as appropriate. Continuous parameters were compared across multiple groups using the Kruskal-Wallis test, and the Steel-Dwass method was used for multiple comparisons. Linear mixed-effects models were used to identify factors influencing LI patterns across the three time points, and an unstructured covariance was assumed to model the within-subject correlation. Predictors with no significance in univariate analysis and the full model were then eliminated to generate a simplified model. The final model includes time, contralateral index, IVC, and dominant AV aldosterone concentrations and interactions, with time for the latter two variables. Data with right-skewed distribution (e.g., LI, contralateral index, and steroid concentrations) were log-transformed in the linear mixed-model analyses. Model assumptions were assessed by examining the studentized marginal residuals. Analyses were evaluated using SAS, version 9.4 (SAS Institute, Cary, NC). Statistical significance was accepted at an α level of 0.05.
Results
Between January 2009 and August 2018, 312 patients with confirmed PA underwent AVS in our institution. A total of 90 patients with incomplete data sets for all three time points were excluded (Fig. 1). Of these, catheterization was unsuccessful before cosyntropin stimulation in 68 patients, after cosyntropin stimulation in four patients, at both before and after cosyntropin stimulation in 18 patients. Of the remaining 222 patients, 130 (59%) were men, 158 (73%) were white, 53 (25%) were black, and four (2%) were Asian (Table 1). The median age of study participants was 52 (range, 20 to 79) years, and women were younger than men (median age, 48 vs 55 years in men; P = 0.0003) (27). Using CYP11B2 IHC-guided next-generation sequencing, the mutation status of 71 patients who underwent adrenalectomy was analyzed and revealed 24 KCNJ5, 22 CACNA1D, 10 ATP1A1, four ATP2B3, and one CTNNB1 somatic mutations. In the remaining 10 patients, either no APA was identified in the available samples when using CYP11B2 IHC or sequencing did not reveal known aldosterone-driver mutations. Comparison of demographic and hormonal variables across mutations is shown in Table 2. As previously reported (26, 28), KCNJ5 mutations were more common in women, whereas all other mutations were more common in men [Table 2; (27)]. Notably, baseline LI was highest in patients with KCNJ5 mutations (P = 0.006); baseline aldosterone concentrations in the dominant AV and IVC were highest in patients with KCNJ5 and ATP2B3 mutations (P = 0.02 and 0.04, respectively).
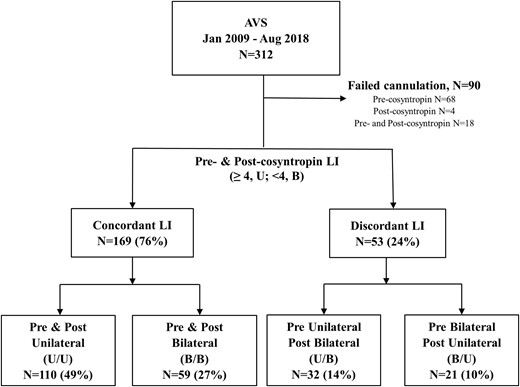
Study flow.
Characteristics of Study Participants Across Groups of Lateralization Based on Results Before and After Cosyntropin Stimulation
| U/U | U/B | B/U | B/B | Pa | |
|---|---|---|---|---|---|
| No. of participants (%) | 110 (49) | 32 (14) | 21 (10) | 59 (27) | |
| Age, median (range), y | 52 (45–59) | 49 (45–58) | 53 (43–61) | 53 (47–63) | 0.65 |
| Male sex, no. (%) | 64 (58) | 17 (53) | 15 (71) | 34 (58) | 0.62 |
| Race, no. (%) | 0.0003 | ||||
| White | 87 (55) | 14 (9) | 13 (8) | 44 (28) | |
| Black | 16 (30) | 17 (32) | 7 (13) | 13 (25) | |
| Asian | 3 (75) | 0 | 1 (25) | 0 | |
| LI, median, (IQR) | |||||
| Baseline | 16.5 (7.6–35.8) | 7.3b,c (5.3–12.4) | 2.2b,d (1.7–2.6) | 1.8b (1.2–2.4) | <0.0001 |
| 10 Min | 17.5 (8.5–39.3) | 2.5b (1.4–3.9) | 7.4b,c,d (4.4–13.2) | 1.6b,d (1.2–2.0) | <0.0001 |
| 20 Min | 18.1 (8.0–48.0) | 2.1b (1.6–2.8) | 8.2b,c,d (5.8–9.6) | 1.6b,d (1.2–2) | <0.0001 |
| Contralateral index, median, (IQR) | |||||
| Baseline | 0.4 (0.2–0.8) | 0.8b (0.4–1.7) | 0.9b (0.5–3.1) | 1.9b,d (0.8–4.2) | <0.0001 |
| 10 Min | 0.2 (0.1–0.4) | 1.1b (0.5–1.6) | 0.4c,d (0.1–0.5) | 1.1b (0.6–2) | <0.0001 |
| 20 Min | 0.2(0.1–0.4) | 1.0b (0.4–1.4) | 0.4c,d (0.2–0.7) | 1.1b (0.7–1.8) | <0.0001 |
| Baseline hormonal concentration, median, (IQR)e | |||||
| Aldo IVC | 26 (14–42) | 14b (10–22) | 19 (12–30) | 16b (11–27) | 0.0003 |
| Aldo AVD | 1145 (469–3049) | 774c (379–1560) | 151b,d (101–662) | 290b (98–796) | <0.0001 |
| Aldo AVN | 48 (25–109) | 73c (36–112) | 91b (58–356) | 172b (72–511) | <0.0001 |
| Cortisol IVC | 7 (5–10) | 5 (5–8) | 7 (4–9) | 7 (5–11) | 0.18 |
| Cortisol AVD | 27 (19–66) | 27 (20–57) | 24 (16–34) | 30 (19–55) | 0.53 |
| Cortisol AVN | 27 (19–66) | 26 (17–45) | 23 (17–47) | 31 (19–53) | 0.41 |
| 20-Min hormonal concentration after cosyntropin stimulation, median, (IQR) | |||||
| Aldo IVC | 46 (34–70) | 31b (24–48) | 40 (27–69) | 36b (24–52) | 0.0005 |
| Aldo AVD | 9362 (4673–18400) | 4732b (2210–7240) | 7260c (5500–11000) | 3730b (2200–5930) | <0.0001 |
| Aldo AVN | 462 (222–881) | 2060b (978–3100) | 1270b,c (332–2269) | 2595b (1350–3990) | <0.0001 |
| Cortisol IVC | 17 (15–20) | 18 (16–22) | 18 (13–21) | 18 (16–21) | 0.45 |
| Cortisol AVD | 1001 (684–1442) | 1462b (1011–1990) | 981c,d (641–1196) | 1369b (931–1670) | 0.0002 |
| Cortisol AVN | 1222 (809–1520) | 1350 (897–1739) | 1254 (1056–1494) | 1164 (940–1657) | 0.62 |
| Mutation (n = 61), no. | |||||
| KCNJ5 | 23 | — | 1 | — | |
| CACNA1D | 17 | 2 | 3 | — | |
| ATP1A1 | 7 | 1 | 2 | — | |
| ATP2B3 | 4 | — | — | — | |
| CTNNB1 | — | — | 1 | — | |
Abbreviations: aldo, aldosterone; AVD, dominant adrenal vein; AVN, nondominant adrenal vein; IQR, interquartile range.
Comparison across groups was performed by Kruskal-Wallis (P represents across group test) and Steel-Dwass all-pairs comparisons.
P < 0.05, compared with U/U.
P < 0.05, compared with B/B.
P < 0.05, compared with U/B.
Aldosterone concentrations are shown in ng/dL and cortisol concentrations in µg/dL.
Comparison of Demographic and Clinical Variables Among Study Participants With Different Aldosterone-Driver Mutation Status
| KCNJ5 (n = 24) | CACNA1D (n = 22) | ATP1A1 (n = 10) | ATP2B3 (n = 4) | Pa | |
|---|---|---|---|---|---|
| Age, median (range), y | 49 (40–56) | 50 (44–58) | 53 (48–56) | 60 (55–69) | 0.13 |
| Male sex, no. (%) | 5 (21) | 19 (86) | 8 (80) | 4 (100) | <0.0001 |
| Race, no. (%) | 0.21 | ||||
| White | 19 (37) | 19 (37) | 10 (20) | 3 (6) | |
| Black | — | 2 (67) | — | 1 (33) | |
| Asian | 2 (100) | — | — | — | |
| LI | |||||
| Baseline | 32.6 (15.6–58.1) | 12.7 (5.2–21.7) | 5.5b (4.4–12.8) | 17.7 (11.0–58.1) | 0.006 |
| 20 Min | 14.7 (5.8–59.5) | 12.9 (8.4–24.8) | 12.7 (9.0–20.4) | 58.4 (21.3–182.2) | 0.51 |
| Contralateral index | |||||
| Baseline | 0.4 (0.3–0.6) | 0.4 (0.2–0.6) | 0.6 (0.3–2.6) | 0.4 (0.4–0.5) | 0.42 |
| 20 Min | 0.2 (0.1–0.5) | 0.2 (0.1–0.4) | 0.2 (0.2–0.3) | 0.2 (0.1–0.3) | 0.81 |
| Baseline hormonal concentrationc | |||||
| Aldo IVC | 37 (23–52) | 20 (13–38) | 27 (9–39) | 80 (37–201) | 0.04 |
| Aldo AVD | 2710 (881–4882) | 874 (223–2004) | 541b (242–1583) | 3267 (762–1234) | 0.01 |
| Aldo AVN | 59 (39–130) | 43 (21–74) | 91 (24–195) | 171 (65–271) | 0.36 |
| Cortisol IVC | 8 (6–10) | 7 (6–12) | 8 (5–10) | 11 (9–14) | 0.54 |
| Cortisol AVD | 42 (23–130) | 40 (22–78) | 27 (20–28) | 77 (26–137) | 0.47 |
| Cortisol AVN | 29 (21–90) | 46 (23–87) | 28 (19–57) | 51 (24–98) | 0.64 |
| 20-Min hormonal concentration after cosyntropin stimulation | |||||
| Aldo IVC | 51 (38–64) | 45 (31–62) | 59 (28–81) | 137 (39–267) | 0.63 |
| Aldo AVD | 8882 (3834–18561) | 9115 (4430–12900) | 9054 (5817–39800) | 20471 (11859–50854) | 0.27 |
| Aldo AVN | 481 (294–725) | 448 (271–1270) | 528 (299–881) | 533 (458–980) | 0.87 |
| Cortisol IVC | 18 (16–20) | 18 (16–21) | 18 (14–23) | 21 (18–24) | 0.60 |
| Cortisol AVD | 778 (638–1088) | 1356b (973–1481) | 1461b (868–1955) | 1111 (571–1781) | 0.02 |
| Cortisol AVN | 1043 (577–1360) | 1382 (757–1566) | 1391 (1350–1525) | 1397 (975–1768) | 0.13 |
Data are reported as median (interquartile range) unless otherwise indicated.
Abbreviations: aldo, aldosterone; AVD, dominant adrenal vein; AVN, nondominant adrenal vein.
Comparison across groups was performed by Kruskal–Wallis (P represents across group test) and Steel-Dwass all-pairs comparisons.
P < 0.05, compared with KCNJ5.
Aldosterone concentrations are shown in ng/dL and cortisol concentrations in µg/dL.
Based on data from before and after cosyntropin stimulation, AVS lateralization was concordant in 169 patients (76%; U/U, n = 110; B/B, n = 59) and discordant in 53 patients (24%; U/B, n = 32; B/U, n = 21). Patients’ age and sex were similar between groups [Table 1; (27)]. Black patients had the highest proportion of discordant AVS lateralization (45%), whereas in white and Asian patients, AVS lateralization was concordant before and after cosyntropin stimulation in 83% and 75%, respectively (P = 0.0003). Demographics, LI and contralateral index values, and aldosterone and cortisol concentrations were similar across races (data not shown).
On average, baseline LI was highest in the U/U group and progressively lower across other groups (U/U > U/B > B/U = B/B; P < 0.0001; Table 1; Fig. 2). After cosyntropin stimulation, LI values at 10 and 20 minutes remained significantly higher in the U/U group as compared with all other groups, but the ranking order switched across the discordant groups (U/U > B/U > U/B > B/B; P < 0.0001; Table 1; Fig. 2). In addition, contralateral suppression was most marked (i.e., contralateral index value was lowest) in the U/U group at baseline and after cosyntropin stimulation (P < 0.0001 at all three time points). Moreover, baseline contralateral aldosterone suppression was present in 80% of U/U patients, vs 53% of U/B patients. Taken together, these results suggest that in patients with robust baseline aldosterone dominance along with contralateral suppression, AVS results are least affected by cosyntropin use.
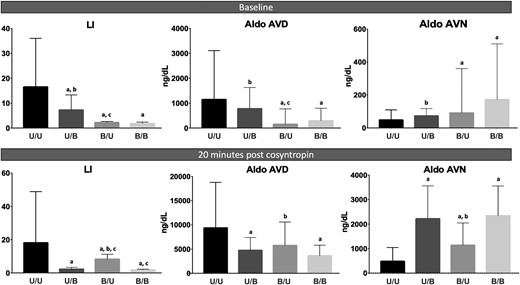
Comparison of LI and AV aldosterone (aldo) concentrations across lateralization groups. The bars represent medians and the lines mark the third quartiles. AVD, dominant adrenal vein; AVN, nondominant adrenal vein. a, P < 0.05, compared with U/U; b, P < 0.05, compared with B/B; c, P < 0.05, compared with U/B.
Baseline and cosyntropin-stimulated dominant AV and peripheral aldosterone concentrations were highest in the U/U group, whereas the contralateral AV aldosterone concentrations were highest in the B/B group (Table 1; Fig. 2). In contrast, baseline cortisol concentrations were similar across all groups, in periphery and in the two AVs (Table 1). These data demonstrate that patients with consistent unilateral AVS (i.e., the U/U group) are at the highest end of the PA severity spectrum, whereas patients with discordant lateralization (i.e., the U/B and B/U groups) have relatively milder disease.
Time-dependent LI response to cosyntropin
The three major patterns of time-dependent LI response to cosyntropin were as follows: increasing (27% of patients), decreasing (33%), and stable (40%; Fig. 3). Race, sex, and age were similar among groups (Table 3). The LI response to cosyntropin was almost evenly distributed among the three patterns in the U/U patients (Table 3), revealing that cosyntropin stimulation has variable effects even within patients with consistent PA lateralization. Patients with increasing LI in response to cosyntropin stimulation had the most pronounced contralateral suppression, both at baseline and after stimulation (Table 3). Patients with a descending LI pattern, however, had relatively more pronounced contralateral suppression compared with the stable LI group only at baseline (Table 3), suggesting that in these patients, cosyntropin stimulates the contralateral aldosterone production. The majority of patients with underlying KCNJ5 mutations had a descending LI response to cosyntropin (58% vs 26% for all other mutations combined; P = 0.04). Conversely, in 75% of patients with ATP2B3 mutation and 50% of those with ATP1A1 mutation, the LI value increased after cosyntropin administration (Table 3).
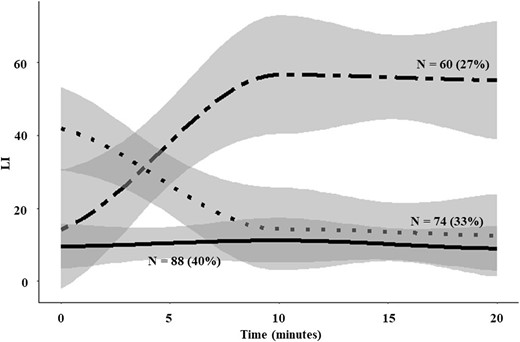
Temporal patterns of LI in relation to cosyntropin administration. The lines represent means, and the gray area represents the 95% CIs.
Comparison of Demographic and Clinical Characteristics of Patients With PA Across the Three Major Patterns of LI Response to Cosyntropin
| LI Response | Pa | |||
|---|---|---|---|---|
| Ascending | Descending | Stable | ||
| No. of participants (%) | 60 (27) | 74 (33) | 88 (40) | |
| Age, median (range), y | 53 (44–62) | 51 (45–58) | 52 (47–61) | 0.48 |
| Male sex, % | 40 (67) | 37 (50) | 53 (60) | 0.14 |
| Race, no. (%) | 0.15 | |||
| White | 46 (29) | 46 (29) | 66 (42) | |
| Black | 12 (22) | 22 (42) | 19 (36) | |
| Asian | 1 (25) | 3 (75) | 0 | |
| Group, no. (%) | <0.0001 | |||
| U/U (n = 110) | 38 (34) | 37 (34) | 35 (32) | |
| U/B (n = 32) | 0 | 32 (100) | 0 | |
| B/U (n = 21) | 21 (100) | 0 | 0 | |
| B/B (n = 59) | 1 (2) | 5 (8) | 53 (90) | |
| LI, median (IQR) | ||||
| Baseline | 5.5b,c (2.5–15.3) | 16.2b (6.4–36.7) | 2.5 (1.4–9.2) | <0.0001 |
| 10 Min | 26.0b,c (8.6–77.9) | 4.8 (2.2–13.5) | 2.3 (1.6–10.8) | <0.0001 |
| 20 Min | 23.3b,c (8.8–72.6) | 4.0 (1.9–9.0) | 2.3 (1.6–8.6) | <0.0001 |
| Contralateral suppression index, median (IQR) | ||||
| Baseline | 0.5b (0.3–0.9) | 0.5b (0.3–1.5) | 1.6 (0.5–3) | 0.0002 |
| 10 Min | 0.2b,c (0.1–0.4) | 0.4 (0.2–1.1) | 0.6 (0.2–1.5) | <0.0001 |
| 20 Min | 0.2b,c (0.1–0.5) | 0.5 (0.2–1.2) | 0.7 (0.2–1.4) | <0.0001 |
| Baseline aldo IVC | 21 (13–38) | 21 (12–37) | 19 (12–36) | 0.70 |
| Baseline aldo AVD | 433c (131–1100) | 1235b (526–2930) | 522 (182–1405) | 0.0003 |
| Mutation (n = 61), no. | ||||
| KCNJ5 | 7 | 14 | 3 | |
| CACNA1D | 9 | 7 | 6 | |
| ATP1A1 | 5 | 2 | 3 | |
| ATP2B3 | 3 | 1 | — | |
| CTNNB1 | 1 | — | — | |
Abbreviations: aldo, aldosterone; AVD, dominant adrenal vein; IVC, inferior vena cava.
Comparison across groups was performed by Kruskal–Wallis (P represents across group test) and Steel-Dwass all-pairs comparisons.
P < 0.05, compared with stable LI.
P < 0.05, compared with descending LI.
To assess the impact of cosyntropin on LI response, we conducted mixed linear-model analyses across time. Baseline LI value was higher when the aldosterone concentration in the dominant AV was higher (P < 0.001; Table 4). Conversely, baseline LI value was lower when the contralateral index value was higher (indicating lack of aldosterone suppression in the contralateral AV; P < 0.001). The LI increase over time was higher when baseline IVC aldosterone concentration was higher (P < 0.001). These results support that a higher peripheral aldosterone concentration is associated with higher odds of unilateral PA. A higher baseline dominant AV aldosterone concentration, however, led to a decline in LI over time after adjusting for all other covariates (P < 0.001; Table 4), suggesting that the aldosterone production in such cases was nearly maximized. Similar results were obtained when adjusting for sex, age, and race (27). In univariate and multivariate analyses, age, sex, and race were not associated with either baseline LI or LI change over time.
Impact of Variables on LI (Log Scale)
| Effecta | Regression Coefficient | SE | 95% CI | P |
|---|---|---|---|---|
| Intercept | −0.92 | 0.23 | −1.38 to −0.47 | <0.0001 |
| Time (10 min) | 1.08 | 0.33 | 0.43 to 1.72 | 0.001 |
| Time (20 min) | 1.07 | 0.33 | 0.41 to 1.72 | 0.002 |
| log(contralateral index) | −0.66 | 0.03 | −0.72 to −0.59 | <0.0001 |
| log(AVD baseline aldo) | 0.69 | 0.04 | 0.61 to 0.76 | <0.0001 |
| log(IVC baseline aldo) | −0.55 | 0.07 | −0.69 to −0.40 | <0.0001 |
| log(AVD baseline aldo) × time (10 min) | −0.45 | 0.05 | −0.55 to −0.35 | <0.0001 |
| log(AVD baseline aldo) × time (20 min) | −0.53 | 0.05 | −0.63 to −0.42 | <0.0001 |
| log(IVC baseline aldo) × time (10 min) | 0.41 | 0.10 | 0.22 to 0.61 | <0.0001 |
| log(IVC baseline aldo) × time (20 min) | 0.59 | 0.10 | 0.40 to 0.78 | <0.0001 |
Abbreviations: aldo, aldosterone; AVD, dominant adrenal vein.
For time effects, all comparisons are with baseline as the reference.
In total, 93 patients underwent unilateral adrenalectomy (n = 75 U/U, n = 8 U/B, and n = 10 B/U patients). Postoperative clinical and biochemical follow-up data were available for 86 (92%) and 63 (68%) patients, respectively. Biochemical benefit was absent in five patients (n = 2 U/U, n = 2 U/B, and n = 1 B/U) (27). Of the four patients with tissue that was analyzed for mutation status, all three cases with discordant lateralization had no known aldosterone-driver mutation identified, and one U/U patient harbored a CACNA1D mutation (27).
Discussion
In this study, we characterize the spectrum of aldosterone response to cosyntropin stimulation during AVS in patients with PA. Our findings suggest that PA subtypes span a continuum analogous to the spectrum of PA severity. Second, we found that LI can be both enhanced or reduced by cosyntropin stimulation and that this response is influenced by the baseline peripheral and dominant AV aldosterone concentrations, and by the underlying molecular mechanisms.
Although, in most patients, AVS results were concordant with and without cosyntropin stimulation, 24% of our patients had discordant lateralization. Of these, 60% had unilateral results only before cosyntropin administration and 40% only after cosyntropin administration; these findings are similar to those in a previous report (16). The relative effects of cosyntropin on physiologic vs pathologic aldosterone synthesis in patients with PA have been debated. A major concern has been that cosyntropin might boost aldosterone production from normal zona-glomerulosa cells, concealing an APA (19, 20), but such findings have not been consistent. A recent meta-analysis of 14 studies comparing AVS results with and without cosyntropin stimulation suggested that cosyntropin does not alter the accuracy of PA lateralization (29). An important caveat of existing literature is that criteria for AVS hormonal analysis, including selectivity index and LI, as well as postoperative assessment, have been heterogeneous among studies (18, 29–32). Population differences might also explain some of the variability in results. Notably, the rate of discordant PA lateralization was highest in black patients in our cohort. Existing data support genetic differences in APAs across races (25, 26, 33). In contrast, age and sex distributions were similar across our subgroups, and to those reported in previous studies (16, 29).
As an important addition to published data, our results reveal a gradient of PA severity across lateralization groups. As such, patients with the most severe PA forms, as reflected by higher peripheral and dominant AV aldosterone concentrations, along with contralateral suppression, more often have unilateral PA, regardless of cosyntropin use. Conversely, patients with discordant AVS results have milder PA, with modest lateralization, leading less frequently to contralateral suppression and greater LI volatility after cosyntropin administration. Conceivably, such discrepant cases might evolve toward frank unilateral dominance over time. The higher rates of lateralization in patients with more severe PA have been consistent across previous studies, irrespective of AVS protocols used (13, 34, 35), further supporting our findings.
To evaluate the impact of cosyntropin on pathologic vs physiologic aldosterone-producing cells across this fluid PA spectrum, regardless of rigid LI boundaries, we assessed the temporal trajectories of LI after cosyntropin administration. Importantly, we found cosyntropin stimulation can have increased, decreased, or negligible impact on LI, in comparable proportions. Higher peripheral aldosterone concentration was associated with greater LI value after cosyntropin stimulation, supporting the correlation between PA severity and LI robustness. In contrast, a higher baseline aldosterone concentration in the dominant AV led to a decline in LI after cosyntropin stimulation, suggesting the autonomous aldosterone synthesis was already maximized in such cases. Alternatively, the decline in LI value subsequent to cosyntropin administration might indicate the contralateral site was not fully suppressed. Indeed, the contralateral index was lowest in patients with an ascending LI pattern, suggesting chronic contralateral aldosterone suppression with minimal normal aldosterone-producing cell reserves.
Another notable finding of our study is that even in patients with robust unilateral PA, the LI response to cosyntropin varied, clustering almost evenly across the three observed patterns. In addition to the factors we have discussed, such variability in response among unilateral PA cases might reside in their underlying molecular pathogenesis. One previously proposed hypothesis was that MC2R expression in APAs is variable (36). The limited available data, however, derive from genetic analysis of adrenal adenomas in which the aldosterone synthetic capacity was not confirmed by CYP11B2 expression (37), and, as now recognized, dominant macroscopic nodules are not always APAs (38, 39). Although the number of patients with known aldosterone-driver mutations in our study was relatively small, these preliminary results suggest that most cases with KCNJ5 mutations tend to have higher baseline LI, which then declines after cosyntropin stimulation. A Japanese study showed a marked suppression of aldosterone in response to dexamethasone in patients with KCNJ5-mutated APAs as compared with other patients (40). Such APAs are characterized by large, lipid-rich cells, similar to those seen in zona fasciculata (41, 42), with abundant CYP11B1 and CYP17A1 expression, and the capacity to produce cortisol (40). Interestingly, although patients with ATP1A1 mutations have lower baseline aldosterone concentrations than those with ATP2B3 mutations, LI tends to increase after cosyntropin stimulation in both groups, suggesting some common pathogenic features. In contrast, the impact of cosyntropin stimulation appears less predictable in patients with CACNA1D mutations. Considering that black men have APAs that most frequently harbor CACNA1D mutations (25), this finding might explain why the proportion of discrepant LI before vs after cosyntropin stimulation was highest in black patients with PA.
In summary, our data demonstrate that the impact of cosyntropin on aldosterone synthesis in patients with PA is not uniform; rather, there are three response patterns. PA severity as well as underlying molecular characteristics of APAs appear to influence the effect of cosyntropin on LI in patients with PA. The retrospective study design and small number of patients with known aldosterone-driver mutations are the main limitations of these findings. Nonetheless, our center is one of very few that consistently collects AV and peripheral samples during at least three time points, before and after cosyntropin administration. Larger, multicenter prospective studies with standardized procedure protocols and rigorous longitudinal follow-up are needed to further elucidate the clinical impact of cosyntropin on PA lateralization.
Acknowledgments
We thank the University of Michigan adrenal team members who participated in the care of patients with PA or assisted with tissue procurement; Thomas J. Giordano and Michelle Vinco for assistance in tissue slides preparation; Scott A. Tomlins for mutation analysis; and all study participants.
Financial Support: This work was supported by the National Institute of Diabetes and Digestive and Kidney Diseases [Grant R01DK106618 (to W.E.R.) and Grant 1K08DK109116 (to A.F.T.)]; and the American Heart Association [Grant 17SDG33660447 (to K.N.) and Grant 18POST33990227 (to A.T.N.)].
Additional Information:
Disclosure Summary: The authors have nothing to disclose.
Data Availability: The datasets generated during and/or analyzed during the current study are not publicly available but are available from the corresponding author on reasonable request.
Abbreviations:
- APA
aldosterone-producing adenoma
- AV
adrenal vein
- AVS
adrenal vein sampling
- B
bilateral
- IHC
immunohistochemistry
- IVC
inferior vena cava
- LI
lateralization index
- PA
primary aldosteronism
- U
unilateral
