


Abstract
We previously developed and validated an inexpensive and parsimonious prediction model of 2-year all-cause mortality in real-life patients with type 2 diabetes.
This model, now named ENFORCE (EstimatioN oF mORtality risk in type 2 diabetiC patiEnts), was investigated in terms of (i) prediction performance at 6 years, a more clinically useful time-horizon; (ii) further validation in an independent sample; and (iii) performance comparison in a real-life vs a clinical trial setting.
Observational prospective randomized clinical trial.
White patients with type 2 diabetes.
Gargano Mortality Study (GMS; n = 1019), Foggia Mortality Study (FMS; n = 1045), and Pisa Mortality Study (PMS; n = 972) as real-life samples and the standard glycemic arm of the ACCORD (Action to Control Cardiovascular Risk in Diabetes) clinical trial (n = 3150).
The endpoint was all-cause mortality. Prediction accuracy and calibration were estimated to assess the model's performances.
ENFORCE yielded 6-year mortality C-statistics of 0.79, 0.78, and 0.75 in GMS, FMS, and PMS, respectively (P heterogeneity = 0.71). Pooling the three cohorts showed a 6-year mortality C-statistic of 0.80. In the ACCORD trial, ENFORCE achieved a C-statistic of 0.68, a value significantly lower than that obtained in the pooled real-life samples (P < 0.0001). This difference resembles that observed with other models comparing real-life vs clinical trial settings, thus suggesting it is a true, replicable phenomenon.
The time horizon of ENFORCE has been extended to 6 years and validated in three independent samples. ENFORCE is a free and user-friendly risk calculator of all-cause mortality in white patients with type 2 diabetes from a real-life setting.
Diabetes mellitus is one of the most challenging global health problems, affecting approximately 400 million people (1) and representing a leading cause of death worldwide (2). The negative impact of diabetes on global health is projected to become even greater over the next decades given the epidemic proportions that this disease is assuming (3); identifying the best strategies to tackle it is mandatory.
For the concept of precision medicine to become a reality, the follow-up and treatment of each individual patient should be tailored to his or her individual risk profile, thereby maximizing effectiveness and minimizing costs. To pursue such ambitious goal, the availability of well-performing risk prediction models is pivotal. In the specific context of mortality, the ability to predict a high risk would allow health care providers to apply the most aggressive, most expensive, and most burdensome prevention strategies only to the most high-risk patients. It would also be important for these tools to be inexpensive, parsimonious, and simple, especially when they are to be used in health care systems with limited resources.
We have recently developed and validated a prediction model of all-cause mortality in white patients with type 2 diabetes from central southern Italy enrolled in two longitudinal cohort studies (4). Our model was built based on a 2-year horizon (4). The aim of the current study was to investigate, in the same cohorts, how this risk model performs at 6 years, a time horizon that is more useful for clinical purposes, and to validate the risk model in an additional external sample of white patients with type 2 diabetes from Italy. While we were conducting this study, a novel risk model for all-cause mortality in patients with type 2 diabetes [RECODe (Risk Equations for Complications of Type 2 Diabetes)] was developed based on data from randomized clinical trials (5) and validated in observational longitudinal studies (5, 6). Interestingly, RECODe performed better in observational longitudinal studies (6) that in randomized clinical trials (5), thus suggesting that mortality prediction accuracy may differ between these two sets. Such a phenomenon, if confirmed, would be important for comparing and interpreting epidemiological evidence derived from different datasets as well as for designing new studies. In light of this, although being well aware that beside the intrinsic study design several additional differences in genetic, environmental, and clinical features characterized the two different settings, we also investigated whether the all-cause mortality prediction model we set up performed differently in our observational cohort studies than in the ACCORD (Action to Control Cardiovascular Risk in Diabetes) clinical trial.
Materials and Methods
Study design
The accuracy of the proposed model, called ENFORCE (EstimatioN oF mORtality risk in type 2 diabetiC patiEnts), in predicting all-cause mortality within a 6-year horizon in patients with type 2 diabetes was investigated in the updated Gargano Mortality Study (GMS) and validated in the Foggia Mortality Study (FMS), in which the model was initially built and validated (4) for 2-year mortality. As a further validation step, ENFORCE’s performance at 6 years was also evaluated in a new Italian sample, the Pisa Mortality Study (PMS) (7, 8). Finally, to investigate how this model performs in a clinical trial setting, we evaluated its prediction accuracy in self-reported white individuals from the standard glycemic arm of the ACCORD clinical trial, which was carried out in patients with type 2 diabetes from the United States and Canada (9).
Samples
GMS
The GMS served as training sample; it includes 1028 self-reported white individuals with type 2 diabetes [diagnosed according to American Diabetes Association (ADA) 2003 criteria]. These patients were consecutively recruited at the Scientific Institute “Casa Sollievo della Sofferenza” in San Giovanni Rotondo (Apulia, central southern Italy) from 1 November 2000 to 30 September 2005, for a study aimed at identifying predictors of incident all-cause mortality. The only exclusion criterion was poor life expectancy due to malignancies. To date, this cohort has been followed up for a median of 11.8 years (range, 0.1 to 14.0 years), with the last information on vital status obtained on 30 November 2014. After exclusion of patients whose information on vital status at follow-up was not available (n = 9), 1019 patients (99.1% of the initial cohort) were eligible for the present analysis. Missing data rates for the nine baseline covariates included in the prognostic model varied from 0.0% to 8.2%.
FMS
The FMS served as the first external and independent validation sample and consists of 1153 self-reported white individuals with type 2 diabetes (diagnosed according to ADA 2003 criteria). These patients were consecutively recruited at the Endocrine Unit of the University of Foggia (Apulia, central southern Italy) from 7 January 2002 to 30 September 2008 for a study aimed at identifying predictors of incident all-cause mortality. As in the GMS, the only exclusion criterion was poor life expectancy due to malignancies. To date, this cohort has been followed up for a median of 7.4 years (range, 0.1 to 11.9 years), with the last information on vital status obtained on 31 March 2015. After exclusion of patients whose information on vital status at follow-up was not available (n = 108), 1045 patients (90.1% of the initial cohort) were eligible for the present analysis. Missing data rates for the nine baseline covariates included in the prognostic model varied from 5.3% to 7.3%.
PMS
PMS served as the second external and independent validation sample. White individual (n = 972) with type 2 diabetes (diagnosed according to ADA 2003 criteria). These patients were consecutively recruited at the Endocrine Unit of the University of Pisa from 1 January 2002 to 14 February 2008 for a study aimed at identifying predictors of incident all-cause mortality. As in the GMS and the FMS, the only exclusion criterion was poor life expectancy due to malignancies. To date, this cohort has been followed up for a median of 11.2 years (range, 0.3 to 11.7 years), with the last information on vital status obtained on 28 February 2015. Information on vital status at follow-up was available for all patients. Missing data rates for the nine baseline covariates included in the prognostic model varied from 0.0% to 0.5%.
ACCORD
The ACCORD clinical trial recruited 10251 patients with type 2 diabetes and high cardiovascular risk from 77 clinical centers across the United States and Canada (9). ACCORD served as another external and independent validation sample with the additional scope to test the transportability of our model in a clinical trial setting. Patients were randomly assigned in a 1:1 ratio to intensive [targeting lowering of glycated hemoglobin (HbA1c) to <6.0%] and standard (HbA1c 7% to 7.9%) glycemic treatment arms and to blood pressure and lipid subtrials (9). For the current validation study, only self-reported white participants from the standard glycemic arm (n = 3199) were investigated. After exclusion of those with missing values for the nine baseline predictors at issue, 3150 participants, followed up for a median of 5 years (range, 1 to 7 years), were eligible for the present analysis.
Risk model to predict all-cause mortality
ENFORCE is based on the following nine predictors measured at baseline: age, antihypertensive and insulin therapy, body mass index (BMI), diastolic blood pressure, low-density lipoprotein cholesterol, triglycerides, high-density lipoprotein cholesterol, and albumin-to-creatinine ratio (4). Details for selecting these predictors have been described elsewhere (4). Briefly, predictors were selected by using a variable selection procedure based on the continuous net reclassification improvement (10–12) within a proportional hazards Cox model (4). Continuous variables, including BMI, systolic blood pressure, diastolic blood pressure, low-density lipoprotein cholesterol, triglycerides, high-density lipoprotein cholesterol, and albumin-to-creatinine ratio, that were suspected to violate the multiplicative model linearity assumption were log transformed. Important aspects including the variable selection procedure, modeling continuous prognostic factors, checking the model assumptions, and complexity have been previously discussed (4).
As sensitivity analyses, in a subgroup of 1082 individuals from Italian samples for which additional clinical information was available and in self-reported white participants from the standard glycemic arm of the ACCORD study, ENFORCE prediction performances were assessed after the following were added to the model one by one: history of documented nonfatal myocardial infarction, stroke, retinopathy, anticoagulant therapy, and estimated glomerular filtration rate.
Data analysis
Patient baseline characteristics were reported as frequency (percentage) and mean (SD) or median along with lower and upper quartiles for categorical and continuous variables, respectively. Overall and age-adjusted death incidence rates for 100 person-years were also reported and compared by using a Poisson model.
Time-to-death analyses were conducted by using multivariate Cox proportional hazards regression models, and risks were reported as hazard ratios along with their 95% CIs. The assumption of proportionality of the hazards was tested by using scaled Schoenfeld residuals and held for all analyses. Overall survival was defined as the time between enrollment and death. For patients who did not experience the endpoint, survival time was censored at the time of the last available follow-up visit.
The discriminatory ability of the model was assessed by estimating survival C-statistic, along with 95% CIs derived following the perturbation-resampling method (13); C-statistics were compared according to Pencina and D’Agostino's approach (14). The Greenwood-Nam-D’Agostino (GND) test (15), which measures the distance between predicted and observed Kaplan-Meier event rates over 6 years, was performed. Calibration was also reported as the slope and as the intercept of the regression line between predicted and observed Kaplan-Meier event rates over 6 years by deciles of risk. In an ideal condition, the calibration slope should be 1 and the intercept should be 0, reflecting a perfect agreement between predicted and observed event rates. Furthermore, survival conditional tree analysis (16) was performed to identify subgroups of patients with different mortality risks according to the 6-year mortality predicted probability using a conservative Bonferroni adjustment approach for the spitting rule. The free web-based calculator is available at http://www.operapadrepio.it/rcalc/rcalc.php.
Because missing data rates in each of the three Italian samples were low, we performed imputations using the random forest framework, building 100,000 trees for each sample, which has been demonstrated to be more efficient than other traditional methods (17, 18).
A two-sided P value < 0.05 was considered to indicate statistical significance. All statistical analyses were performed by using SAS software, release 9.4 (SAS Institute, Cary, NC) and the computing environment R (R Development Core Team, version 3.3.2).
Results
All-cause mortality prediction in GMS and FMS
Baseline clinical features of patients from the GMS (n = 1 019) and FMS (n = 1 045) are reported in Table 1. Mean age was 61.1 (9.7) and 63.6 (11.8) years; 41.8% and 44.9% of patients were age ≥ 65 years in GMS and FMS, respectively. Mean BMI was 31.5 (5.8) and 30.3 (6.6) kg/m2; 11.4% and 18.8% of individuals were normal weight, 34.3% and 31.1% were overweight, and 53.3% and 49.2% were obese in the GMS and FMS, respectively. During follow-up, 333 (31.7%) and 309 (29.6%) patients died in the GMS and FMS, respectively. Age- and sex-adjusted mortality incidence rates were 1.5 and 3.1 events per 100 person-years in the GMS and in FMS, respectively. After updating of follow-up data (as well as retrieving some previously missing data or imputing them by using the random forest method), ENFORCE yielded 6-year mortality C-statistics of 0.79 (95% CI, 0.75 to 0.82) and 0.78 (95% CI, 0.75 to 0.80) in the GMS and FMS, respectively. The previously reported prediction accuracy at 2 years (4) was confirmed in both the GMS and FMS, with C-statistics equal to 0.88 (95% CI, 0.83 to 0.92) and 0.81 (95% CI, 0.75 to 0.85), respectively.
Baseline Clinical, Demographic, and Laboratory Characteristics of Diabetic Patients Enrolled in the Four Samples
| Characteristic | GMS (n = 1 019) | FMS (n = 1045) | PMS (n = 972) | ACCORD (n = 3150) |
|---|---|---|---|---|
| Age, y | 61.1 (9.7) | 63.6 (11.8) | 59.6 (7.1) | 63.3 (6.6) |
| Men, n (%) | 512 (50.2) | 510 (48.8) | 580 (59.7) | 1079 (34.3) |
| Smoking habits, n (%) | ||||
| Never-smokers | 789 (77.6) | 531 (55.2) | 768 (79.1) | 2815 (89.4) |
| Ex-smokers | 86 (8.5) | 264 (27.4) | 0 (0.0) | 0 (0.0) |
| Smokers | 142 (14.0) | 167 (17.4) | 203 (20.9) | 335 (10.6) |
| BMI, kg/m2 | 31.0 (5.8) | 30.3 (6.6) | 29.7 (5.3) | 31.9 (5.2) |
| Duration of diabetes, y | 10.9 (9.0) | 13.1 (10.0) | 10.1 (8.5) | 10.6 (7.5) |
| Dyslipidemia, n (%)a | 875 (86.8) | 848 (86.1) | 815 (83.8) | 2,730 (86.7) |
| Glycated hemoglobin, % | 8.7 (1.0) | 9.0 (1.1) | 7.6 (1.2) | 8.2 (0.9) |
| SBP, mm Hg | 134.5 (16.6) | 130.4 (15.5) | 142.8 (19.2) | 135.1 (16.3) |
| DBP, mm Hg | 78.3 (8.9) | 76.6 (9.0) | 82.4 (10.1) | 74.0 (10.2) |
| HDL cholesterol, mg/dL | 42 (35, 52) | 45 (37, 54) | 48 (41, 57) | 39 (33, 46) |
| LDL cholesterol, mg/dL | 119 (93, 143) | 101 (77, 127) | 130 (109, 149) | 98 (79, 123) |
| Total cholesterol, mg/dL | 192 (166, 223) | 182 (151, 211) | 201 (178, 224) | 177 (154, 207) |
| Triglycerides, mg/dL | 131 (94, 187) | 141 (99, 202) | 133 (98, 199) | 170 (120, 248) |
| Uric acid, mg/dL | 5.1 (4.2, 6.2) | 5.4 (4.5, 7.1) | 5.2 (4.3, 6.2) | NA |
| Creatinine, mg/dL | 0.9 (0.8,1.1) | 0.8 (0.7,1.0) | 0.8 (0.7,1.0) | 0.9 (0.8,1.0) |
| ACR, mg/mmol | 1.3 (0.6, 4.1) | 1.8 (0.7, 8.2) | 0.7 (0.4, 1.8) | 1.3 (0.7, 3.9) |
| Albuminuria, mg/g | 10.7 (4.3, 29.4) | 16.3 (6.1, 64.2) | 4.1 (3.0, 15.4) | 1.50 (0.7, 4.2) |
| e-GFR CKD-EPI, mL/min per 1.73 m2 | 76.2 (63.2, 88.5) | 85.7 (63.2, 98.9) | 89.9 (76.6, 97.6) | 85.8 (71.3, 95.5) |
| Antihypertensive treatment, n (%) | 540 (57.8) | 679 (68.6) | 516 (53.1) | 2713 (86.1) |
| Insulin treatment, n (%) | 424 (41.8) | 363 (36.7) | 249 (25.6) | 1098 (34.9) |
| Antidyslipidemic treatment, n (%) | ||||
| No | 695 (68.4) | 652 (66.0) | 653 (67.2) | 987 (31.5) |
| Statins | 295 (29.0) | 302 (30.6) | 269 (27.7) | 1933 (61.6) |
| Fibrates | 26 (1.6) | 34 (3.4) | 50 (5.1) | 216 (6.9)b |
| Follow-up, y | 11.8 (9.4, 13.0) | 7.4 (6.5, 8.3) | 11.2 (10.9, 11.7) | 5.0 (4.1, 5.7) |
| Vital status, n (%) | 333 (31.7) | 309 (29.6) | 154 (15.8) | 221 (7.0) |
Values are expressed as n (%), mean (SD), or median (interquartile range). ACR, urinary albumin-to-creatinine ratio; DBP, diastolic blood pressure; eGFR CKD-EPI, estimated glomerular filtration rate calculated by Chronic Kidney Disease-Epidemiology Collaboration equation; HDL, high-density lipoprotein; LDL, low-density lipoprotein; SBP, systolic blood pressure.
Dyslipidemia: in GMS, FMS, and PMS defined as LDL cholesterol > 100 mg/dL or HDL cholesterol < 4.0 mg/dL or triglycerides ≥ 150 mg/dL; in ACCORD defined as LDL cholesterol > 100 mg/dL or HDL cholesterol < 4.0 mg/dL or triglycerides ≥ 150 mg/dL.
Patient treated with fibrates only or with both fibrates and statins.
Validation in PMS
Baseline clinical features of patients from the PMS (n = 972) are reported in Table 1. Mean age was 59.6 (7.1) years; 27.1% of patients were age ≥ 65 years. Mean BMI was 29.7 (5.3) kg/m2; 16.5% of individuals were normal weight, 43.1% were overweight, and 40.4% were obese. During follow-up, 154 (15.8%) patients died. The age- and sex-adjusted mortality incidence rate was 1.3 events per 100 person-years. Prediction accuracy of ENFORCE corresponded to a 6-year time horizon C-statistics equal to 0.75 (95% CI, 0.68 to 0.83).
Pooled Italian samples
The prediction performance of ENFORCE was similar across the three Italian cohorts, with overlapping 95% CIs for the C-statistics (P for heterogeneity = 0.71). When the three studies were pooled to increase statistical power and to obtain more robust risk estimates and prediction accuracy measures, the C-statistic for 6-year all-cause mortality was 0.80 (95% CI, 0.78 to 0.82); the calibration slope was 1.020, and the calibration intercept was −0.003 (Fig. 1), and the calibration GND test P value was 0.11. For the sake of future implementation and replication in other external samples, Cox regression coefficients for each predictor included in ENFORCE are reported in an online repository (19).
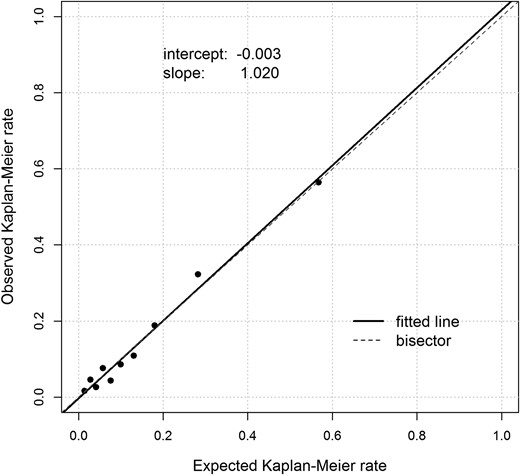
Calibration plot. Expected Kaplan-Meier mortality rate, based on the proposed 6-year all-cause mortality prediction model in the Italian pooled sample, vs observed Kaplan-Meier mortality rate.
As shown in Table 2, ENFORCE had a better prediction accuracy in the HbA1c stratum < 8% as compared with the HbA1c stratum ≥ 8%.
ENFORCE 6-Year Prediction Accuracies According to HbA1c Stratum in the Italian Pooled Sample and in ACCORD
| Study and Subsample | Participants, n | Events, n | C-Statistic (95% CI) | P Value |
|---|---|---|---|---|
| Italian samplesa | 0.003 | |||
| HbA1c ≥ 8% | 1539 | 267 | 0.78 (0.75–0.80) | |
| HbA1c < 8% | 1414 | 167 | 0.84 (0.81–0.87) | |
| ACCORDb | 0.179 | |||
| HbA1c ≥ 8% | 1693 | 119 | 0.72 (0.67–0.77) | |
| HbA1c < 8% | 1439 | 81 | 0.67 (0.61–0.72) |
Eighty-three patients were excluded because of missing HbA1c information.
Eighteen patients were excluded because of missing HbA1c information.
A survival conditional tree analysis of 6-year mortality partitioned the pooled sample into four risk categories according to different levels of all-cause mortality predicted risk probabilities: low (predicted probability < 10% and observed 6-year mortality incidence rate of 0.7 per 100 person-years), intermediate-low (predicted probability ranging from 10% to 20% and observed 6-year mortality incidence rate of 1.2 per 100 person-years), intermediate-high (predicted probability ranging from 20% to 33% and observed 6-year mortality incidence rate of 6.1 per 100 person-years), and high (predicted probability > 33% and observed 6-year mortality incidence rate of 13.4 per 100 person-years) risk. Kaplan-Meier survival curves of the four categories are shown in Fig. 2. Compared with individuals at lower risk, the hazard ratios of those at intermediate-low, intermediate-high, and high risk were 3.0 (95% CI, 1.2 to 4.1), 8.6 (95% CI, 6.3 to 11.6,) and 19.1 (95% CI, 14.6 to 25.1), respectively.
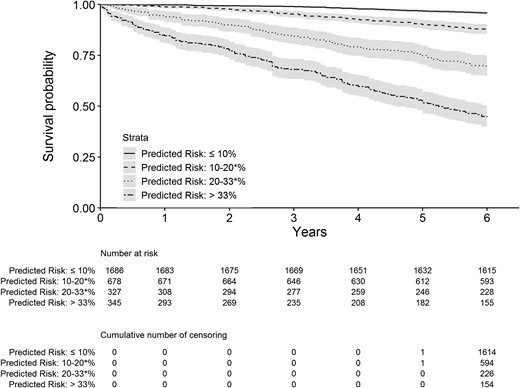
Kaplan-Meier survival curves for the four risk categories as determined by the survival conditional tree analysis. Asterisk indicates upper bound included.
In a subgroup of the pooled sample comprising 1082 individuals for whom other additional clinical information was available, ENFORCE and ENFORCE plus history of documented nonfatal myocardial infarction or stroke gave overlapping results in terms of C-statistics for 6-year all-cause mortality: 0.76 (95% CI, 0.69 to 0.82) and 0.76 (95% CI, 0.70 to 0.82), respectively. Results did not change when information on retinopathy or anticoagulant therapy or estimated glomerular filtration rate (calculated with the Chronic Kidney Disease-Epidemiology Collaboration equation) were added to ENFORCE (data not shown).
Validation in clinical trial setting
The present analysis was restricted to self-reported white patients of the standard glycemic arm of the ACCORD trial, whose baseline clinical features are reported in Table 1. Mean age was 63.3 (6.6) years; 36.7% of patients were age ≥ 65 years. Compared with Italian samples, ACCORD showed a lower proportion of women and higher BMI values; 5.4% of patients were normal weight, 26.3% were overweight, and 68.3% were obese. During follow-up, 221 (7.0%) patients died. The age- and sex-adjusted mortality incidence rate was 1.2 events per 100 person-years. For 6-year all-cause mortality, ENFORCE achieved a C-statistic of 0.68 (95% CI, 0.65 to 0.72), which was significantly lower than that obtained in the pooled Italian samples (P for heterogeneity < 0.0001). A similar finding was observed after addition of history of documented nonfatal myocardial infarction or stroke; C-statistic was 0.69 (95% CI, 0.65 to 0.73). In addition, at variance with what was observed in the Italian samples, C-statistics in ACCORD were not significantly different when we compared different HbA1c strata (Table 2).
To address whether the difference in ENFORCE performance between Italian samples and ACCORD was partly due to difference in treatment intensity, C-statistics were assessed after stratification of ACCORD participants in primary as compared with secondary prevention [0.69 (95% CI, 0.64 to 0.74) vs 0.69 (95% CI, 0.64 to 0.74)] and in those included in the blood pressure compared with the lipid subtrial [0.69 (95% CI, 0.63 to 0.75) vs 0.69 (95% CI, 0.63 to 0.74)].
Comparison between ENFORCE and RECODe
The RECODe has recently been proposed as a well-performing, validated prediction model for several diabetic complications, as well as for all-cause mortality (5, 6), using predictors as reported in an online repository (19).
In the subgroup of 1082 individuals from the pooled sample in which RECODe’s variables were available, a Cox model achieved a C-statistic for 6-year all-cause mortality of 0.74 (95% CI, 0.39 to 0.82). This value is similar to that achieved by ENFORCE (0.76; 95% CI, 0.69 to 0.82).
In the same ACCORD subsample used for our analysis, RECODe showed a predicted 6-year all-cause mortality C-statistic of 0.69 (95% CI, 0.65 to 0.73), again a value that is similar to that obtained by ENFORCE (0.68, 95% CI, 0.65 to 0.72), as well as to that obtained by RECODe itself in the whole ACCORD sample (5).
Discussion
By using information commonly collected in everyday clinical practice, ENFORCE extends to a 6-year time horizon a previously reported inexpensive, parsimonious, and easy-to-use prediction model of all-cause mortality in white patients with type 2 diabetes (4). ENFORCE is highly accurate and well calibrated. In addition, ENFORCE performed similarly well, and therefore was validated, in two additional independent and diverse Italian cohorts, the FMS and PMS.
On the one hand, we emphasize that our model performed similarly well across three cohorts that had somewhat different baseline clinical features and, most important, very different mortality rates. It is therefore conceivable that ENFORCE is generalizable to broader contexts. On the other hand, we acknowledge that our data were limited to Italian samples, which leaves the issue of transportability of our model to other populations still to be addressed.
Of note, the performance of ENFORCE was not as good in the ACCORD clinical trial as in the observational studies in which it was developed and validated. This finding closely resembles the difference in performances observed between observational and interventional studies for the RECODe model (5, 6), and possibly points to a general phenomenon suggesting that predicting mortality risk in diabetic patients is more difficult in a clinical trial setting than in real-life situations. This might be the consequence of differences in intrinsic patients’ motivation and cultural background, which are presumably higher in volunteers participating in a clinical trial as compared with those investigated in a real-life setting. Such features characterizing volunteers can somehow flatten individual risk profiles and therefore reduce the performance of prediction models.
In addition, the different accuracy that we observed between Italian cohorts and ACCORD could at least in part be due to differences in environmental and/or genetic backgrounds. Differences in several clinical features observed between Italian and ACCORD participants (19) may have played a role in modifying ENFORCE performance. Among these, the higher proportion of patients who were never-smokers and who were receiving antihypertensive and/or antidyslipidemic treatments might be of particular relevance. On the contrary, as mentioned above, the relatively low mortality rate observed in the ACCORD cohort is unlikely to be responsible, given the similar, if not lower, rate in the PMS, in which ENFORCE performed as well as in the other two Italian samples (GMS and FMS). In all, given the above-mentioned differences in the cohorts examined, we acknowledge that caution must be used regarding the reason for differences in ENFORCE performance between the Italian vs the ACCORD participants.
Finally, in the pooled Italian sample ENFORCE performed significantly better in individuals with relatively low HbA1c levels than in their counterparts with HbA1c ≥ 8%, thus suggesting that glycemic control may play a role in shaping the clinical relevance of our model. However, this difference was not observed in the ACCORD study, thus again casting doubt on the possibility of transferring well-performing models into a real-life setting in the context of a clinical trials setting.
Several other models have been described to predict all-cause mortality in patients with type 2 diabetes (5, 6, 20–30). Some of them lack formal independent and external validation (20–24). Some other models were based on simulation studies that did not report the model’s prognostic accuracy (25–28). In addition, many models have been built based on clinical trial data (25, 28, 30), which leaves the question open as to their transportability to real-life settings. Finally, several studies (5, 6, 21–23, 25, 28–30) included patients of different ethnicities, which makes it impossible to obtain population-specific models. Notably, in both Italian and ACCORD samples, ENFORCE performs as well as the recently proposed RECODe (5, 6). Although this latter model has been investigated among individuals from different countries and settings, and used different predictors, than ENFORCE [sharing only four of them (19)]), it has been set up and validated by using large and well-established samples (5, 6). Therefore, it is a useful tool for benchmarking our ENFORCE.
Limitations of our study include the lack of information on previous cardiovascular events, which are major risk factors for all-cause mortality (4). However, in a subsample representing more than one third of the whole Italian sample, no difference in the predicting ability of ENFORCE was observed when information on previous cardiovascular events was added. Thus, it is likely that lack of such information does not detract much from ENFORCE performance. Nonetheless, despite this limitation, ENFORCE is highly accurate and well calibrated. In addition, in a real-life clinical setting, information on previous cardiovascular events is obtained primarily by self-reporting, which is likely to provide unreliable data that may affect the performance of prediction models (31–33). Thus, the fact that ENFORCE is not based on previous cardiovascular history may actually be an advantage, especially in underprivileged socioeconomic strata, in which the likelihood of inaccurate information on previous cardiovascular events is likely to be higher. Another limitation is that additional studies, better if in “real-life” samples, are needed to address the transportability of ENFORCE to different genetic, environmental, and cultural backgrounds.
In summary, we have further validated and extended the time horizon of ENFORCE, our previously described parsimonious and simple-to-use all-cause mortality prediction model for patients with type 2 diabetes. Notably, this model is inexpensive and therefore also applicable in environments with limited resources. With the goal of helping clinicians identify individuals with type 2 diabetes at high risk of premature death, we are providing free public access to ENFORCE as a user-friendly web-based risk engine (http://www.operapadrepio.it/enforce/enforce.php). Currently, our effort is focused on further validating ENFORCE in additional samples from Italy (34) and possibly other European countries so as to investigate its transportability in larger samples, as well as in a wider geographic context.
We expect that implementation of ENFORCE and other predictive models (5, 6, 25, 28), according to their performance and applicability in specific real-life settings, will allow the targeting of more aggressive, expensive, and burdensome preventive strategies only to patients who are predicted to be at very high risk, thereby improving the cost-effectiveness of available and often limited resources.
Acknowledgments
Financial Support: This work was supported by the Italian Ministry of Health grants, RC2016, RC2017, and RF-2013-02356459 (to C.M.) and by Italian Ministry of University and Scientific Research “Progetti di Ricerca di Interesse Nazionale” (PRIN) 2012 grant 31 (to V.T.). M.G.S is supported by the Italian Ministry of Health grant RF-2013-02356459.
The ACCORD study (clinicaltrials.gov identifier NCT00000620) was supported by National Heart, Lung, and Blood Institute contracts N01-HC-95178, N01-HC-95179, N01-HC-95180, N01-HC-95181, N01-HC-95182, N01-HC-95183, N01-HC-95184, IAA-Y1-HC-9035, and IAA-Y1-HC-1010 (A.D.). Other components of the National Institutes of Health, including the National Institute of Diabetes and Digestive and Kidney Diseases, the National Institute on Aging, and the National Eye Institute, contributed funding.
No sponsor had any role in the study design; collection, analysis, or interpretation of the data; or writing of the report. M.C., A.F., A.D., and V.T. had access to the raw data. M.C. and V.T. had full access to all of the data and the final responsibility to submit for publication.
Author Contributions: M.C. and V.T. participated in the study conception and design. H.S., C.M., S.D.C., M.G., and M.R.S. contributed to data acquisition. M.C., H.S., A.F., and M.G.S. performed statistical analyses. M.C., H.S., A.F., C.M.. A.D., and V.T. participated in data analysis and interpretation. M.C., A.D., and V.T. drafted the manuscript. M.C., C.M., S.D.C., O.L., G.P., A.D., and V.T. critically reviewed the manuscript. M.C. and V.T. are the guarantors of this work and, as such, had full access to all the data in the study and take responsibility for the integrity of the data and the accuracy of the data analysis.
Disclosure Summary: The authors have nothing to disclose.
Abbreviations:
- ACCORD
Action to Control Cardiovascular Risk in Diabetes
- ADA
American Diabetes Association
- BMI
body mass index
- ENFORCE
EstimatioN oF mORtality risk in type 2 diabetiC patiEnts
- FMS
Foggia Mortality Study
- GMS
Gargano Mortality Study
- HbA1c
glycated hemoglobin
- PMS
Pisa Mortality Study
- RECODe
Risk Equations for Complications of Type 2 Diabetes
