


Abstract
Most papillary microcarcinomas (PMCs) are indolent and subclinical. However, as many as 10% can present with clinically significant nodal metastases.
Characterization of the genomic and transcriptomic landscape of PMCs presenting with or without clinically important lymph node metastases.
Formalin-fixed paraffin-embedded PMC samples from 40 patients with lateral neck nodal metastases (pN1b) and 71 patients with PMC with documented absence of nodal disease (pN0).
To interrogate DNA alterations in 410 genes commonly mutated in cancer and test for differential gene expression using a custom NanoString panel of 248 genes selected primarily based on their association with tumor size and nodal disease in the papillary thyroid cancer TCGA project.
The genomic landscapes of PMC with or without pN1b were similar. Mutations in TERT promoter (3%) and TP53 (1%) were exclusive to N1b cases. Transcriptomic analysis revealed differential expression of 43 genes in PMCs with pN1b compared with pN0. A random forest machine learning–based molecular classifier developed to predict regional lymph node metastasis demonstrated a negative predictive value of 0.98 and a positive predictive value of 0.72 at a prevalence of 10% pN1b disease.
The genomic landscape of tumors with pN1b and pN0 disease was similar, whereas 43 genes selected primarily by mining the TCGA RNAseq data were differentially expressed. This bioinformatics-driven approach to the development of a custom transcriptomic assay provides a basis for a molecular classifier for pN1b risk stratification in PMC.
Although papillary thyroid cancer is usually an indolent disease, surgical series demonstrate clinically important cervical lymph node metastases in approximately 10% of patients undergoing thyroidectomy for papillary thyroid cancers ≤1 cm in maximal diameter [papillary microcarcinoma (PMC)] (1–7). As active surveillance becomes an accepted alternative to immediate thyroidectomy in low-risk thyroid cancers, there is a need for identification of preoperative risk factors that predict for likelihood of development of clinically important lymph node metastases (8, 9). Histological predictors of loco-regional metastases (tumor multifocality, extrathyroidal extension, desmoplastic stromal reaction, peritumoral infiltration, vascular invasion, an infiltrative growth pattern of the primary tumor, tumor-associated fibrosis, and peri-tumoral lymphatic vessel density) can only be determined postoperatively (4, 10–22). Even when combined, the specificity and positive predictive value (PPV) of these histological features are insufficient to provide useful risk stratification (23).
Mutations in BRAF (24–29) and changes in expression of selected genes [i.e., upregulation of CCND1, RB1, EPCAM, S100A4, ERAP2, HGF, COX2, SIRT6, and MKI67 (30–38) and decreased expression of BCL2, CDKN1B, and KAI1 (30–32, 35, 39)] are associated with a statistically significant increased risk of loco-regional metastases. However, none of these individual markers provides adequate predictive power to be clinically relevant. Two studies integrated molecular findings with histologic characteristics to develop scoring systems predictive of loco-regional spread or disease recurrence (15, 40). However, these integrative model systems cannot provide preoperative risk stratification because they require knowledge of histopathological variables that can only be assessed postoperatively.
Recent studies leveraged the power of next-generation sequencing to interrogate the cancer genomes and transcriptomes of all stages and types of follicular cell–derived thyroid cancer (41–51). Consistent with the indolent clinical course of papillary thyroid cancers, The Cancer Genome Atlas (TCGA) found that they are genetically simple tumors with a low mutational burden (0.41 nonsilent mutations per Mb), characterized by mutations of a small number of mutually exclusive genes that signal through the mitogen-activated kinase pathway (41, 52, 53). This study dramatically improved our understanding of genotype–phenotype relationships in thyroid cancer, identified uncommon mutations that are amenable to targeting with systemic therapies and led to the development of integrated scoring systems that can be used to characterize the differentiation state of individual tumors (41, 52).
The primary goal of our study was to use next-generation sequencing and novel quantitative mRNA profiling assays to interrogate the cancer genomes and a large panel of transcripts in archival specimens of PMC presenting with or without clinically significant lateral neck lymph node metastases. We reasoned that a targeted comprehensive 410 cancer gene exome panel that included virtually all genes identified in the papillary thyroid carcinoma (PTC) TCGA study would be appropriate to screen for genomic differences. For the mRNA expression analysis, informative genes were selected using primarily a bioinformatics-driven approach examining differential mRNA and miRNA expression that correlated with tumor size and with the presence of nodal disease in the TCGA data set. Other mRNA subsets were selected based on functional groups potentially associated with metastatic propensity. These were incorporated into a custom-designed NanoString panel of 248 genes. If informative, these targeted DNA and RNA profiling panels could enable translation to clinical use because they are compatible with small-volume formalin-fixed paraffin-embedded (FFPE) tissue. For this study, we analyzed FFPE papillary microcarcinoma surgical samples from 40 patients with clinically significant lateral neck lymph node metastases (pN1b) and 71 patients with PMC documented to have at least five histologically confirmed normal lymph nodes sampled from either the central or lateral neck (pN0). The data were used to create a molecular classifier predictive of clinically significant cervical lymph node metastases in papillary microcarcinoma.
Subjects and Methods
Patient cohort
MSKCC institutional review board approval was obtained for retrospective data collection and for research use of archival tissue samples (WA0252-12 and WA0253-12). Matched tumor and normal thyroid tissues were obtained for a highly curated cohort of 40 patients with thyroid PMC with clinically significant lateral neck lymph node metastases (pN1b) and 71 patients with PMC documented to have at least five pathologically normal lymph nodes sampled from either the central or lateral neck (pN0). Histologic confirmation was performed by an expert thyroid cancer pathologist (R. Ghossein), followed by microdissection involving one hematoxylin and eosin slide and 20 unstained slides (10-μm) from each FFPE primary tumor specimen (and associated lymph node metastasis when available). Ten FFPE curls of 10-μm thickness were cut from each block and consisted of corresponding histologically normal tissue from each subject.
Nucleic acid extraction
Because our goals required the isolation of nucleic acid from very small quantities of FFPE tissue, we performed simultaneous extraction of DNA and RNA to improve yields and suitability for downstream genomic analysis. Nucleic acids from tumor and normal samples were extracted from FFPE tissue using the FFPE RNA/DNA Purification Plus Kit (Norgen Biotek Corporation, Ontario Canada) according to the manufacturer’s instructions. All tumor specimens were subjected to dual DNA and RNA extraction; normal control samples were subjected to DNA extraction alone.
Nanostring panel design
We developed a custom targeted panel for NanoString-based expression analysis of FFPE-derived RNA by selecting genes likely to be associated with tumor stage and disease progression based on differential expression of mRNA and miRNA transcripts among specified cohorts in the papillary thyroid cancer TCGA project. To identify molecular signatures of nodal proliferation, we identified 64 pN0 and 12 N1b samples from the TCGA patients with papillary thyroid cancer primary tumors <1.5 cm in size (patients with PMC were excluded from TCGA sample collections). We initially considered the global mRNA expression levels for these tumors. First, we removed all genes with SD <60 to filter out genes that have low power to differentiate between the two classes and/or have expression values near noise levels. Next, we used the R package SAMseq to identify differentially expressed genes between the two groups at a false discovery rate cutoff of 0.2. Using only the differentially expressed genes that pass this false discovery rate cutoff, we log-transformed and standardized expression values for each gene. Next, we implemented a fourfold cross-validation to choose the parameters for training a classifier, with an estimated accuracy of 90%. Our choice of classifier was an elastic net because it achieved superior classification accuracy compared with regularization methods, such as LASSO and ridge regression. Our elastic net model stopped at the iteration with optimal cross-validation performance, yielding a set of 86 genes differentiating between pN0 and N1b samples in patients with primary tumors <1.5 cm. We repeated this analysis three more times, leveraging larger numbers of samples: (i) all N0/NX vs all N1a/N1b disease in patients with primary tumors <1.5 cm, (ii) N0 vs N1b disease in all patients, and (iii) all N0/NX vs all N1a/N1b disease in all patients. Twenty-eight genes were found to be significant in at least three of the four comparisons. Gene sets were enriched for members of the TGF-β signaling pathway. Genes significant in this analysis were incorporated into our custom Nanostring assay to discriminate between N0 and N1b PMCs. In addition to the analysis designed to identify molecular signatures of nodal proliferation, we separately compared small tumors (<1.5 cm) with larger tumors to discover predictors of tumor growth. Analyses were performed as described above. A total of 76 N0/NX samples <1.5 cm were compared with 47 N0/NX samples between 1.5 and 3 cm and 37 N1 samples <1.5 cm were compared with 45 N1 samples between 1.5 and 3 cm, resulting in 146 and 153 significant genes, respectively.
The identified genes were then prioritized according to transcript abundance to select 66 discriminatory genes that can be reliably quantified using Nanostring (class = “Classifier mRNA”). Genes whose expression was highly correlated with the 17 most predictive classifier mRNAs were added to provide robustness to the expression profile (class = “Correlation”). Additionally, we included nine mRNAs that correlated with the three most predictive classifier miRNAs (class = “miR correlated”). Other genes were selected according to the following criteria: 24 genes composing a BRAF/RAS activation signature identified from the TCGA PTC data set (class = “BRAF/RAS”) and 12 genes indicative of ERK output in the TCGA PTC data set (class = “ERK-TX”). The rationale for selecting genes in these two categories is based on the known association of the BRAFV600E mutation and the consequent high ERK transcriptional output with nodal disease in PTC (54). To these we added 25 genes used to calculate a thyroid differentiation signature in the TCGA PTC data set (class = “Thyroid diff sig”), 36 genes found to best predict tumor purity in the TCGA PTC data set (class = “Tumor Purity”), 51 genes identified through literature searches to play a role in thyroid tumor progression or metastasis (class = “Literature”), and 10 housekeeping genes (class = “Housekeeping”). Altogether, 251 probes were designed to tag 248 mRNAs (full gene list provided in Ref. 55).
Genomic profiling and analysis
All tumor and normal FFPE-derived DNA samples were sequenced using a custom deep-coverage targeted sequencing assay (MSK-IMPACT) as previously described (56). Briefly, sequencing libraries were constructed using 19 to 200 ng genomic DNA as input (mean, 166 ng) and captured by hybridization to probes targeting all coding exons and selected introns and promoters of 410 key cancer-associated genes. Multiplexed, pooled libraries were sequenced to 382.3x mean tumor coverage (median, 393.7; range, 93 to 694.8) on an Illumina HiSeq. The resulting data were analyzed to identify somatic base substitutions, small insertions and deletions, copy number alterations, and structural rearrangements.
Gene expression profiling and analysis
NanoString nCounter (NanoString Technologies) digital mRNA detection was used to characterize FFPE RNA expression using the panel described above. After spectrophotometric quantification, 100 ng of total RNA was hybridized to capture-reporter probe sets and immobilized on NanoString cartridges according to manufacturer specifications. After excess RNA and probe removal, digital barcodes were counted and processed with NanoString nCounter analysis software for quality control and normalization. Counts were normalized to positive controls and the housekeeping genes as recommended by NanoString. Primary tumors were separated into two classes (N0 and N1b stage disease). Raw count data were normalized and differential expression between classes was calculated for each gene according to the method described in Nixon et al. (57).
Ten RNA samples (five pN0 and five pN1 disease) were selected for whole transcriptome RNA-Seq to compare with NanoString-based expression estimates. After RiboGreen quantification and quality control by Agilent BioAnalyzer, 1 µg of total RNA with an RNA quality number varying from 1.6 to 3.3 underwent ribosomal depletion and library preparation using the TruSeq Stranded Total RNA LT Kit (catalog # RS-122-1202, Illumina) according to instructions provided by the manufacturer with six cycles of PCR. Samples were barcoded and run on a HiSeq 2500 in a 50 bp/50 bp paired end run using the TruSeq SBS Kit v4 (Illumina). On average, 115 million paired reads were generated per sample, and 20% of the data were mapped to the transcriptome. Paired reads were mapped to the human genome using the rnaStar aligner (58) with a multipass method previously described (59). Gene level expression was then computed using HTSeq (www.huber.embl.de/users/anders/HTSeq) for all gene models in Gencode. Normalized counts from NanoString and RNA-seq data were used to compare the expression levels of the genes in the 10 samples, and concordance between the expression estimates was assessed by the Spearman correlation test.
Based on the lymph node involvement class distinctions (pN1b vs pN0), we developed a gene expression–based classifier using NanoString results. After excluding quality control failures, normalized gene expression data from 101 primary tumor samples were selected; 60 samples were used for training (development of the classifier), and 41 samples were held out as an independent testing set to be analyzed once the classifier was developed. A random forest classifier was trained using fivefold cross-validation, and the optimum hyper parameters were selected based on the F1 score (weighted average of the precision and recall). Performance of the model was evaluated using the held-out testing set of 41 samples.
Results
Patient and sample characteristics
Forty patients with thyroid PMC and significant lateral neck lymph node metastases (pN1b) and 71 patients with PMC with no evidence of metastasis and at least five pathologically normal lymph nodes sampled (pN0) were included in this study. The median primary tumor size was 0.6 cm (range, 0.1 to 0.95 cm), with 48% demonstrating multifocal disease within the thyroid gland. The pN0 group had a median of six lymph nodes sampled (range, 5 to 44 lymph nodes), whereas the pN1 group demonstrated a median of three metastatic lymph nodes (1 to 19 lymph nodes involved) that ranged in size from 1 to 4 cm.
Because multiple normal and tumor samples were available for most patients, DNA was extracted from 248 tissue specimens (142 tumors and 106 normal controls), with an average yield of 610 ng (range, 27 to 5811 ng). RNA was extracted from 170 tissues (160 tumors and 10 normal controls), with an average yield of 3583 ng (range, 126 to 17,688 ng). For each of the subjects included in the study, nucleic acid quality was sufficient for successful performance of both DNA and RNA analysis.
Genomic alterations from DNA profiling
To identify genomic alterations that are potentially enriched in pN0 or pN1b stage disease, we sequenced DNA samples from primary and metastatic tumors and matched normal thyroid tissue using a custom targeted panel (MSK-IMPACT) encompassing 410 cancer-associated genes. We achieved deep sequence coverage for high-sensitivity detection of mutations and copy number alterations (mean coverage, 412x; range, 93 to 788x). One or more tumor samples were sequenced from 71 patients with pN0 disease and from 40 patients with pN1 disease. The frequency of mutations across cases is shown in Fig. 1. BRAF alterations were detected in 61% of tumors sequenced. Most BRAF alterations were canonical V600E substitutions, although BRAF kinase fusions were detected in two cases. BRAF alterations were detected at approximately equal frequencies in both pN0 and pN1b tumors. As expected from prior genomic studies in PTC, the overall mutational burden of this cohort was extremely low, ranging from 0 to 32 mutations per megabase. No gene besides BRAF was recurrently altered in more than a few cases. Mutations in the promoter of TERT, known to upregulate telomerase and promote tumor progression, were detected in 3% of tumors and were exclusive to pN1b cases. Interestingly, all samples that demonstrated TERT promoter mutations also had a coexistent BRAFV600E mutation, a combination known to be associated with more aggressive PTCs (60, 61). Similarly, TP53 mutations were seen in 1%, again restricted to the pN1b samples. The genomic profile of pN0 samples did not significantly differ from the genomic profile of pN1b samples.
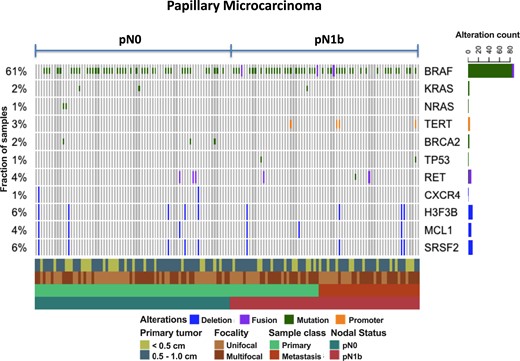
Oncoprint demonstrating the most common genomic alterations using a custom targeted panel (MSK-IMPACT) encompassing 410 cancer-associated genes in papillary microcarcinomas presenting with pN0 vs pN1b disease.
The presence of mutational combinations of BRAFV600E, TERT promoter, and TP53 mutations identified a subset of pN1b papillary microcarcinomas that presented with palpable lateral neck lymph node metastases (2 to 5 cm) and often demonstrated aggressive histological subtypes in the lymph node metastases (Table 1). Furthermore, the clinical outcomes in several of these patients were poor, as demonstrated by one patient requiring chemoradiation for regionally recurrent disease (BRAFV600 + TERT), one patient with progressive radioactive iodine refractory pulmonary metastases (BRAFV600 + TERT), and one patient who died of anaplastic thyroid cancer 6 months after diagnosis (BRAFV600 + TERT + TP53).
Clinical and Histological Characteristics of Patients With Tumors Harboring Mutational Combinations
| Mutations | Age, y | Sex | Size of Primary Tumor, cm | Focality | Clinical Presentation | Primary Tumor Histology | Lymph Node Metastasis Histology | Clinical Outcome |
|---|---|---|---|---|---|---|---|---|
| BRAFV600E + TERT | 76 | Female | 0.15 | Unifocal | 5-cm cystic lateral neck lymph node metastasis | Well-differentiated PTC | PDTC, columnar cell phenotype | Metastatic lymph nodes identified in neck and axilla 2 y after initial therapy, treated with chemoradiation, alive 6 y after diagnosis |
| BRAFV600E + TERT | 66 | Female | 0.7 | Multifocal | 4-cm cystic lateral neck lymph node metastasis | Well-differentiated PTC | Tall cell variant, PTC | Slowly progressive non–radioiodine avid pulmonary metastases 4 y after diagnosis under observation |
| BRAFV600E + TERT | 36 | Female | 0.6 | Multifocal | 2-cm lateral neck lymph node metastasis | Well-differentiated PTC | Well-differentiated PTC | No follow-up available |
| BRAFV600E + TP53 | 49 | Female | 0.25 | Multifocal | 2-cm lateral neck lymph node metastasis | Well-differentiated PTC | Well-differentiated PTC | No evidence of disease 6 y after diagnosis |
| BRAFV600E + TERT + TP53 | 70 | Female | 0.95 | Multifocal | Rapidly growing 3-cm lateral neck lymph node metastasis | Well-differentiated PTC | Anaplastic thyroid cancer arising from differentiated PTC | Died of progressive anaplastic thyroid cancer (local and distant disease) 6 mo after diagnosis |
Abbreviation: PDTC, poorly differentiated thyroid cancer.
Gene expression differences from RNA profiling
Given the low mutational burden of thyroid PMCs and the absence of genes significantly associated with advanced disease, we reasoned that a classifier based on gene expression might serve as a better predictor of tumor stage. Using a custom Nanostring panel of 248 RNAs selected for their potential association with tumor stage and progression (see Materials and Methods), we compared targeted gene expression profiles between the primary tumors from patients with pN0 and pN1b disease. The genes in the NanoString panel were selected according to their association with tumor stage and size in the papillary thyroid cancer TCGA study, membership in previously described pathway activation signatures, and evidence from the literature of a role in thyroid tumor progression or metastasis. Absolute gene expression levels were calculated for each target gene after sample normalization.
As an independent measure of gene expression, we also subjected 10 RNA samples (five pN0 and five pN1b) to whole transcriptome RNA-Seq. Inferred expression levels were highly correlated between NanoString and RNA-Seq for the matched samples (Fig. 2), indicating that NanoString-derived transcript counts provide an accurate measure of gene expression for FFPE tissue.
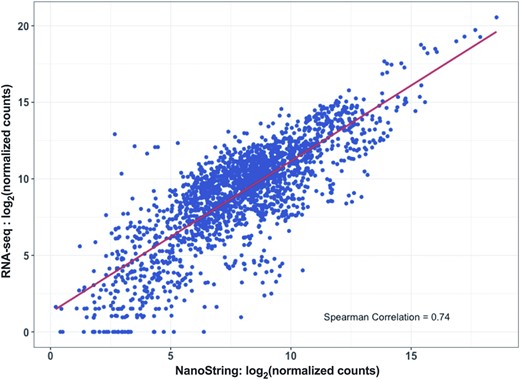
Inferred expression levels were highly correlated between the custom NanoString assay and whole transcriptome RNA-Seq in 10 RNA samples (five pN0 and five pN1b) from FFPE tissue samples.
For each gene in the NanoString panel, we calculated its differential expression level in pN0 tumors vs pN1b tumors (Fig. 3A). Altogether, 37 genes were significantly upregulated, and six genes were significantly downregulated in pN1b tumors (adjusted P < 0.05). Selected significant genes are displayed in Fig. 3B. Among the different categories of genes included in the NanoString panel design, the greatest proportion of significant genes came from the set that were selected based on their differential expression in TCGA data rather than any previously described biological function or pathway membership (55), suggesting that this may be a promising strategy for the development of future prognostic signatures.
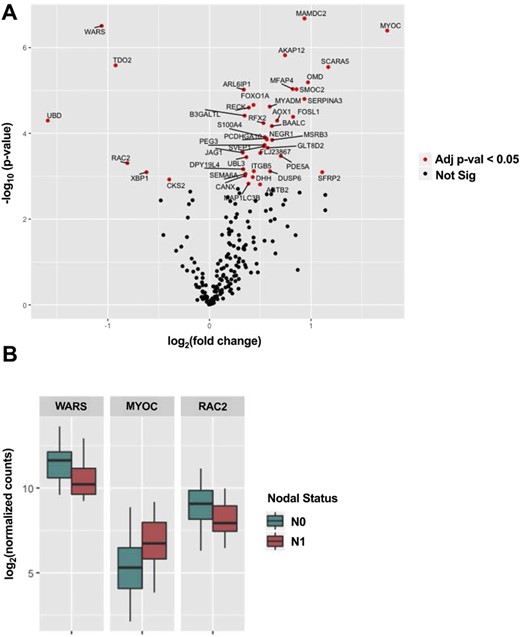
(A) Differential RNA expression levels from the custom Nanostring panel in pN0 tumors vs pN1b tumors. Altogether, 37 genes were significantly upregulated, and six genes were significantly downregulated in pN1b tumors (adjusted P < 0.05). (B) Selected important genes.
Molecular classification of disease
Although the magnitude of the difference in average expression of each individual gene was low, we reasoned that the collective expression profile of all genes could serve as a classifier of progressive disease. Using a randomized training set of 60 pN0 and pN1b cases, we created a random forest machine learning–based classifier to predict disease stage from the primary tumor RNA profile and evaluated the performance using a held-out test set of 41 samples (Fig. 4A, B). When applied to the testing set, this classifier had an area under the receiver-operating curve of 0.93. When the probability threshold for the two classes was selected based on both the receiver-operating curve and precision-recall curve, it exhibited high accuracy, correctly predicting 37 out of 41 cases. Predictions of pN0 were correct 90% of the time, and predictions of pN1b were correct 91% of the time (Fig. 4C).
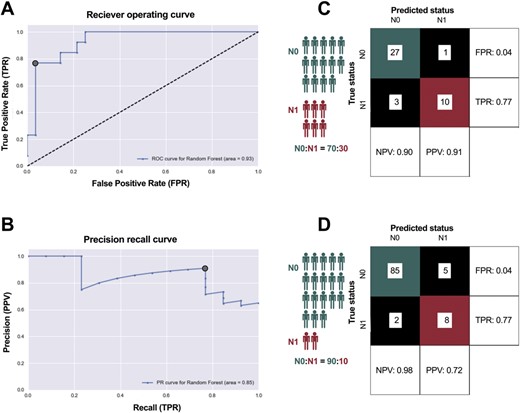
(A, B) Development of a random forest machine learning-based classifier to predict disease stage from the primary tumor RNA profile, evaluated using a held-out test set of 41 samples. (C) Predictions of pN0 were correct 90% of the time, and predictions of pN1b were correct 91% of the time. (D) Considering a population of patients where only 10% progress to pN1b disease, the PPV decreases to 0.72.
Whereas pN1b cases represented 30% of our test set, in practice the proportion of patients with thyroid PMC who progress to pN1b stage is much smaller (estimated ∼10%). Therefore, the PPV of our classifier is likely to decrease when applied to a representative population. We modeled this effect on PPV by changing the class distribution while keeping the false-positive and false-negative rates of the classifier constant. Considering a population of patients where only 10% progress to pN1b disease, the PPV decreases to 0.72 (Fig. 4D).
Discussion
Despite applying a highly sensitive deep exon sequencing technique to evaluate oncogenic mutations in 410 cancer genes, no significant differences were seen between the genomic landscape of primary tumors that demonstrated clinically significant lateral neck lymph node metastases and those that appeared to be confined to the thyroid gland. As expected, these PMCs were genetically simple tumors with low mutational burden, demonstrating the expected mutations in BRAF, RAS, RET, and TERT. Although known to be a risk factor of poorer outcomes (26, 45, 62–65), the presence of the BRAFV600E mutation was not predictive of clinically significant lateral neck lymph node metastasis at presentation. Mutation combinations such as BRAF + TERT or BRAF + TERT + TP53 were only seen in papillary microcarcinomas presenting with clinically apparent large lateral neck lymphadenopathy (not identified in pN0 cases or in pN1b cases with metastatic lymph nodes <2 cm in largest diameter). Furthermore, these mutational combinations were associated with more aggressive histological phenotypes in the clinically apparent lymph node metastases and much poorer outcomes than would have been expected for patients with pN1b papillary microcarcinoma. These data are consistent with previous studies that demonstrate that tumors with concurrent BRAF and TERT mutations demonstrate more aggressive clinical features and have poorer outcomes (60, 65). Further studies will be required to determine if this finding can be verified in larger series and whether this combination of genetic abnormalities is present in PMC tumors that progress during observation.
Although the genomic landscape was very similar between patients with pN1b and pN0 disease, the custom NanoString RNA expression profile analysis revealed statistically significant differential expression of 43 genes (37 upregulated and six downregulated in primary tumors with pN1b compared with pN0 disease). Neither the most upregulated gene (WARS, a gene encoding the enzyme tryptophanyl-tRNA synthetase, which catalyzes the aminoacylation of tRNA with tryptophan, not described in thyroid cancer) (66), the most downregulated gene (MYOC, a gene encoding myocilin, a protein found in the trabecular meshwork and ciliary body in the eye, not described in thyroid cancer) (67), nor any of the other differentially expressed genes were independent predictors of the presence of pN1b disease (Fig. 3).
The largest proportion of differentially expressed genes was derived from analysis of the TCGA data rather than selection based on literature review, pathway membership, or presumed biological function. Thus, successful development of custom RNA expression profiles should emphasize the selection of candidate genes based on previous published gene expression studies integrated with a bioinformatics-based analysis to define the optimal gene set for analysis.
Because no single gene expression profile could reliably predict the presence of pN1b disease, we used a random forest machine learning–based approach to develop a molecular classifier based on the collective expression profiles of all the genes analyzed. When applied to our sample set, which had a 30% prevalence of pN1b disease, the molecular classifier performed well, demonstrating a PPV of 91% and a negative predictive value of 90%. Even when reanalyzed based on the projected 10% prevalence of pN1b disease expected in a surgical population, the performance of the classifier demonstrated a clinically relevant PPV of 0.72 and negative predictive value of 0.98. Additional studies are needed to determine if there is an incremental value of the molecular classifier to routine neck ultrasonography in the detection of clinically significant metastatic cervical lymphadenopathy.
In summary, whereas the genomic landscape of tumors with lateral neck lymph node metastasis (pN1b) and pN0 disease were remarkably similar, differential RNA expression was identified in 43 genes selected for analysis because of their association with tumor stage and disease progression. Furthermore, the few patients with multiple driver mutations (such as BRAF + TERT or BRAF + TERT + TP53) demonstrated an increased risk for early metastatic spread and transition to dedifferentiated histologies. These data demonstrate the power of using a comprehensive bioinformatics approach to the development of custom transcriptomic assays to identify informative genes most likely to be differentially expressed in primary tumor samples.
Acknowledgments
Financial Support: This work was supported by National Cancer Institute Grant P30 CA08748 and by Cycle for Survival, the Marie-Josée and Henry R. Kravis Center for Molecular Oncology (to M.B.) and the SPORE in Thyroid Cancer Grant P50 CA172012-01A1 (to J.A.F.).
Disclosure Summary: The authors have nothing to disclose.
Data Availability:
The datasets generated during and/or analyzed during the current study are not publicly available but are available from the corresponding author on reasonable request.
Abbreviations:
- FFPE
formalin-fixed paraffin-embedded
- PMC
papillary microcarcinoma
- PPV
positive predictive value
- PTC
papillary thyroid carcinoma
