


Abstract
Weight control is hypothesized to be improved when physical activity and energy intake are both high [high energy turnover (ET)].
The impact of three levels of ET on short-term appetite control is therefore investigated at fixed levels of energy balance.
In a randomized crossover trial, 16 healthy adults (25.1 ± 3.9 y of age; body mass index, 24.0 ± 3.2 kg/m2) spent three daylong protocols for four times in a metabolic chamber. Four conditions of energy balance (ad libitum energy intake, zero energy balance, −25% caloric restriction, and +25% overfeeding) were each performed at three levels of ET (PAL 1.3 low, 1.6 medium, and 1.8 high ET; by walking on a treadmill). Levels of appetite hormones ghrelin, GLP-1, and insulin (total area under the curve) were measured during 14 hours. Subjective appetite ratings were assessed by visual analog scales.
Compared with high ET, low ET led to decreased GLP-1 (at all energy balance conditions: P < 0.001) and increased ghrelin concentrations (caloric restriction and overfeeding: P < 0.001), which was consistent with higher feelings of hunger (zero energy balance: P < 0.001) and desire to eat (all energy balance conditions: P < 0.05) and a positive energy balance during ad libitum intake (+17.5%; P < 0.001).
Appetite is regulated more effectively at a high level of ET, whereas overeating and consequently weight gain are likely to occur at low levels of ET. In contrast to the prevailing concept of body weight control, the positive impact of physical activity is independent from burning up more calories and is explained by improved appetite sensations.
Energy turnover (ET) is defined as the level of energy balance (EB), that is, a high ET is achieved at a high level of energy expenditure (very physically active) and a corresponding high energy intake (EI). The same EB can be achieved with a low ET at a low level of energy expenditure and corresponding low EI (see Fig. 1).
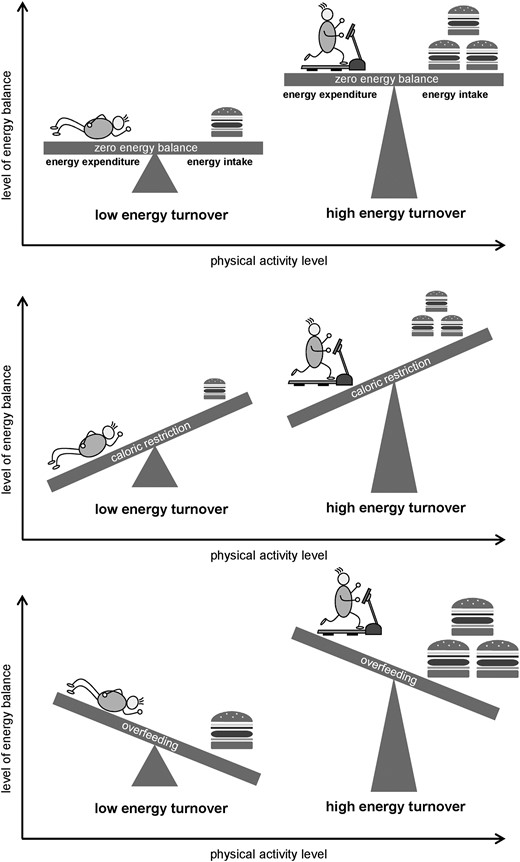
Graphic depiction of the ET concept.
From a teleological point of view, energy expenditure should directly impact the control of appetite and EI (1). A historical study led to the hypothesis that appetite is homeostatically controlled when the physical activity level is high but this control is lost at lower energy expenditure (2). This paradigm of an asymmetric control of EB with a “regulated zone” at high energy expenditure and an “unregulated zone” at low energy expenditure (3) is incompletely verified because it requires a fixed EB at different levels of energy expenditure, a condition that can be obtained in the complex setting of a metabolic chamber. Studies under free-living conditions provide only indirect evidence for this paradigm because EB is not fixed.
Data from Stubbs et al. (4) suggest that there is no compensatory increase in ad libitum food intake in response to 9 days of medium or high exercise level leading to a negative EB compared with inactive control under free-living conditions. Alternatively, inactivity has been shown to promote excess EI and weight gain (5), sedentary time (physical inactivity) is positively associated with adipose tissue mass (6), and exercise is known to facilitate weight control. Time spent in moderate-to-vigorous physical activity was inversely associated with prospective weight gain in young adults (7) and weight regain after weight loss (8). Additionally, a high level of structured aerobic exercise has been shown to reduce body fat mass by increasing energy expenditure, which is not compensated by an increase in EI (9).
Hunger and satiety are responses to neural and hormonal information reporting the current state of EB to key brain regions via signals such as appetite hormones (10). A dramatic reduction in energy expenditure during 1 day of sitting was not accompanied by reduced appetite signals (11). Changes in appetite-regulating hormones following acute exercise might be intensity-dependent, with increasing intensity leading to a greater suppression of orexigenic signals and greater stimulation of anorexigenic signals (12). Hunger and appetite regulatory hormones were found to be insensitive to low-intensity bouts of physical activity, suggesting beneficial implications on body weight control (13). The effect of ET modulated by different durations of low-intensity physical activity on appetite control remains unclear.
The aim of the current study was to investigate the effect of different levels of ET obtained by varying amounts of low-intensity physical activity (brisk walking) on short-term appetite control during different degrees of EB under highly controlled conditions in a metabolic chamber. We hypothesize that appetite is better controlled at high ET independent of EB.
Subjects and Methods
Study population
Sixteen healthy adults (3 women, 13 men) aged between 20 and 40 years were recruited from December 2016 to January 2018 by notice board postings at the Universities of Hohenheim and Stuttgart (both in Stuttgart, Germany) and from social networks. Exclusion criteria were chronic diseases, regular use of medication or supplements, alternative eating habits, food allergies or intolerances, claustrophobia, and smoking. The study protocol was approved by the Ethics Committee of the State Medical Council of Baden-Württemberg, Germany (F-2016-099), in accordance with the Declaration of Helsinki. This trial was registered at ClinicalTrials.gov as no. NCT03361566. All subjects provided written informed consent before participation.
Study protocol
The randomized crossover trial comprised a highly controlled nutritional intervention for 4 weeks in every subject for which 3 days per week were spent in a metabolic chamber at the Institute of Nutritional Medicine, University of Hohenheim in Stuttgart, Germany. An outline of the study protocol is given in Fig. 2. Three different levels of daylong ET [low, physical activity level (PAL) 1.3; medium, PAL 1.6; high, PAL 1.8] were obtained by controlled walking on a treadmill in the metabolic chamber and correspondingly matched EI. Energy requirement at different levels of physical activity was determined during ad libitum EI. In the following, EB on intervention days was changed between zero EB, 25% caloric restriction (CR), and 25% overfeeding (OF). The order of ET levels within each EB condition was randomized as well as the order of CR and OF as the second and fourth conditions. Block randomization was conducted using computer-generated random numbers. Each EB condition started with a 3-day run-in period with controlled diet and fixed macronutrient composition to adapt macronutrient oxidation to macronutrient intake (14) and to ensure equal baseline conditions. Subjects entered the metabolic chamber the evening before each 24-hour intervention to adapt to the environment. Daily routine was strictly controlled with wakeup at 6:00 am, breakfast at 7:00 am, lunch at 1:00 pm, dinner at 7:00 pm, and bedtime at 10:30 pm. The three ET days were separated by one washout day each and participants were allowed to leave the institute for 12 hours on these days.
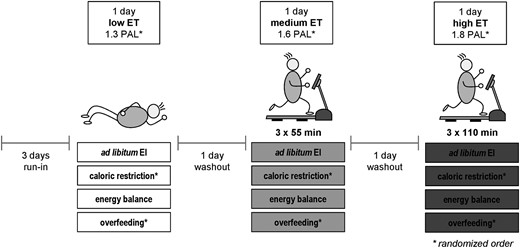
Study protocol of the randomized crossover intervention at three different levels of ET under four different EB conditions. Different levels of ET were achieved by walking on a treadmill at the speed of 4 km/h for either 0 min (low ET), three times for 55 min (medium ET), or three times for 110 min (high ET). Energy balance conditions were ad libitum EI, zero EB, caloric restriction (−25%), and overfeeding (+25%). Levels of ET during each EB condition were randomized as well as order of caloric restriction and overfeeding. Intervention days were preceded by 3 d of run-in at every EB condition and separated by one washout day each. During the entire study protocol subjects received a controlled diet with constant macronutrient relation (50% carbohydrates, 35% fat, 15% protein).
Diet composition
Macronutrient composition was 50% carbohydrates, 35% fat, and 15% protein for all days and for each meal using a Western style diet. During ad libitum EI, subjects were asked to complete all meals within 30 minutes and eat until they felt comfortably full. Leftovers were weighed and the EI was calculated. Individual energy requirement (Erq) for the three levels of physical activity was measured in a metabolic chamber under ad libitum EI condition. On the following intervention days, participants were fed 100% Erq at EB, 75% Erq at CR, and 125% Erq at OF. Leftovers were not allowed during these periods, and all meals were consumed within 30 minutes. During the different EB conditions, the diet consisted of the same food items on chamber days, washout days, and during run-in periods, respectively. Every food item was weighted to the nearest 0.1 g for each participant according to his or her individual energy requirement using a digital scale. Individual diet composition and actual energy and macronutrient intake were calculated using Prodi® 6 software (Wissenschaftliche Verlagsgesellschaft, Stuttgart, Germany). Food was provided by the Institute for Nutritional Medicine, University of Hohenheim, and subjects were instructed to only consume the allocated foods, water, and unsweetened fruit or herbal tea and to abstain from any exercise during the whole study period.
24-Hour EI
The metabolic chambers are two 9 m2 rooms and have a total volume of 21,000 L each (D&S Consulting Services, New York, NY). Equipment and methodology are described in detail elsewhere (15). Room temperature and flow rate were set to 24.5°C and 120 L/min, respectively. Response time correction of the metabolic chamber data were performed using z transformation (16). Total energy expenditure during 24 hours (TEE) was continuously measured (from 6:00 am to 6:00 am) by rates of oxygen consumption and carbon dioxide production using the Promethion integrated whole-room indirect calorimeter system (Sable Systems International, Las Vegas, NV) and by using the Weir equation (17). Twenty-four–hour urea excretion was assessed to calculate nitrogen excretion on intervention days at EB, CR, and OF to correct TEE for protein oxidation [for details, see (15)]. Owing to technical problems during data collection, full TEE data for the whole intervention period are available for 11 participants only, whereas TEE data for ad libitum EI are available for all 16 participants.
Appetite control
Objective and subjective appetite control were assessed. For the objective assessment concentrations of appetite-regulating hormones ghrelin, GLP-1, and insulin were measured in blood samples on intervention days during EB, CR, and OF. Using EI and TEE data, individual EBs for different ET levels were calculated as ∆EB (%) = (EI / TEE × 100) − 100.
For subjective assessment of appetite, participants reported their sensations of hunger, fullness, and desire to eat using visual analog scales (VASs) every 2 hours during the day and at 0, 30, 60, and 120 minutes postprandial on intervention days during EB, CR, and OF. A subsample of eight subjects additionally completed VASs on desire for something sweet, salty, and fatty at the same time points. VASs consisted of a 100-mm horizontal line with “not at all” anchored at 0 mm and “extremely” at 100 mm (18). Higher ratings indicate greater experienced sensations. Total area under the curve was calculated for appetite hormones for 14 hours (7:00 am to 9:00 pm) and for VASs for 15 hours (7:00 am to 10:00 pm) using the trapezoidal rule (19). Because energy requirement for CR and OF was calculated as −25% and +25% of the EI at EB, absolute values for EI differed between ET conditions (e.g., –600 kcal at CR low ET and –832 kcal at CR high ET). Results on appetite hormones and VASs were therefore adjusted for differences in absolute intake of calories.
Blood sampling and analytical methods
Blood samples were taken every 2 hours during the day from 7:00 am to 9:00 pm at EB, CR, and OF and 0, 30, 60, and 120 minutes postprandially. Plasma samples for the measurement of appetite hormones were collected in BD™ P800 tubes (Becton Dickinson, Franklin Lakes, NJ) containing a mixture of protease, esterase, and DPP-IV inhibitors to prevent hormonal degradation. Samples were stored on ice after collection and then centrifuged immediately. Total ghrelin, total GLP-1, and insulin were measured using a Bio-Plex ProTM human diabetes 3-plex kit (Bio-Rad Laboratories, Hercules, CA) containing antibody-conjugated microspheres. Analysis was performed on a Bio-Plex® 200 suspension array reader (Bio-Rad Laboratories) according to the manufacturers’ instructions. Standard curve optimization and data analysis were performed with Bio-Plex Manager™ software 6.1. Twenty-four hour urea excretion was determined using photometry (Beckman Coulter, Brea, CA; AU5800). Aliquots of all samples were stored at −80°C until analysis.
Body composition
Height was measured using a stadiometer (Seca 274; Seca, Hamburg, Germany) and body composition was assessed using air displacement plethysmography by the BodPod™ Body Composition System (Cosmed, Rome, Italy) at baseline. Fat mass index (FMI) was calculated as fat mass divided by height squared (kg/m2). Weight was assessed by an electronic scale coupled to the BodPod™ system. Body weight was also measured at the beginning and end of each EB condition using a calibrated electronic scale (Seca mBCA 515; Seca). All measurements were conducted in the fasting state and in underwear.
Physical activity
Prior to the study start, which walking time and speed were needed to reach the predetermined PALs was tested. Medium and high ET were achieved through different treadmill protocols. On medium ET days, participants walked three times for 55 minutes (11 km) on a treadmill (Kettler Track 9 with software World Tours 2.0; Kettler, Ense-Parsit, Germany) at a speed of 4 km/h starting 10 minutes after meal termination. On high ET days, time on the treadmill was doubled to three times for 110 minutes (22 km) at the same speed. Besides the prescribed time on the treadmill participants remained sedentary (sitting and lying) but awake until bedtime. On the low ET days participants remained sedentary all of the time. PAL was calculated as PAL = TEE/resting energy expenditure (REE) with REE = sleeping energy expenditure (SEE) + 0.5 × SEE (20) using TEE and SEE data from metabolic chambers. SEE was measured as reported by Schrauwen et al. (21) as the lowest energy expenditure value of three consecutive hours during sleep between 12:00 am and 6:00 am. Physical activity was continuously measured via step count using the triaxial activity monitor ActivPAL™ 3C, (Paltechnologies, Glasgow, UK). The ActivPAL™ uses dynamic triaxial acceleration and inclination logging technology and is a valid and reliable device (22). The ActivPAL™ was fixed in the middle of the upper thigh with waterproof patches and was worn permanently during the whole study period, and subjects were requested to refrain from exercise during this time. Data were analyzed with ActivPAL™ Professional v7.2.32 software. Owing to technical failure, one subject had no valid data of physical activity for the whole intervention and two participants had missing data for one EB condition each. For washout days ActivPAL™ data are available for n = 7 to 12 participants only.
Statistical analyses
Primary outcome variables for the present analysis are ghrelin, GLP-1, and insulin concentrations. Secondary outcomes are subjective appetite sensations (VAS) and EB during ad libitum EI. Calculation of the required sample size was conducted using G*Power 3.1.9.2 software (written by F. Faul, University of Kiel, Kiel, Germany) for ghrelin concentration as the primary outcome variable. King et al. (23) observed 29.9% lower ghrelin concentrations after exercise compared with inactivity at the same EB in a randomized crossover intervention. Based on these results, 13 participants are required to detect this difference in ghrelin concentration between low ET and high ET at the same EB (assuming a two-sided power of 95% and an α level of 5%). The statistical software R (2018) was used to analyze the data. Data evaluation started with the definition of an appropriate statistical mixed model (24, 25). The data were assumed to be normally distributed and to be heteroscedastic with respect to the different levels of EB and ET. These assumptions were based on a graphical residual analysis. The statistical model included EB (ad libitum EI, EB, CR, OF) and ET (low, medium, high), as well as their interaction term as fixed factors. The subject identity was regarded as a random factor. Additionally, the correlations of the measurement values due to the several intervention days were taken into account (autocorrelation). Based on this model, a pseudo R2 was calculated (26) and an ANOVA was conducted, followed by multiple contrast tests [e.g., see (27, 28)] to compare the three levels of ET within each EB condition. Deviations of ∆EB (%) during ad libitum EI from an equal EB were tested vs the fixed value (0%) by multiple contrast tests also. Taking this model into account, Pearson correlations were calculated for all levels of ET combined comparing daylong insulin and ghrelin. Data are presented as mean ± SD, and a two-sided P of <0.05 was considered to be statistically significant.
Results
Basal characteristics of the study population
Sixteen adults (3 women, 13 men) aged 20 to 32 years (25.1 ± 3.9 years) with a body mass index between 19.6 and 31.2 kg/m2 (24.0 ± 3.2 kg/m2) and an FMI between 1.8 and 14.1 kg/m2 (5.3 ± 3.2 kg/m2) participated in the trial. According to World Health Organization criteria, one women and four men were overweight and one women was obese. Taking body composition into account, two women and two men had an FMI above the age- and sex-adjusted 95th percentile (29). Body weight did not change during any of the four EB conditions (all P > 0.05, data not shown).
Parameters of EB
Components of EB are shown in Table 1. Compared with low ET, TEE was 24% higher with medium ET and 40% higher with high ET during EB. EI and TEE differed between all ET levels (all P < 0.01). PAL and steps per day were similar between same ET levels (all P > 0.05) except for a lower PAL at low ET during CR compared with OF (P < 0.01). As intended by study protocol, EB was negative during CR, positive during OF (all P < 0.001), and equal during EB. Steps per day were similar on all washout days following the interventions (all P > 0.05, data not shown).
EB Parameters for Interventions Differing in ET and EB
| Ad Libitum EI | CR | Zero EB | OF | |||||||||
|---|---|---|---|---|---|---|---|---|---|---|---|---|
| Low ET | Med ET | High ET | Low ET | Med ET | High ET | Low ET | Med ET | High ET | Low ET | Med ET | High ET | |
| TEE, kcal/d | 2480 ± 99 | 2873 ± 134 | 3320 ± 277 | 2258 ± 107 | 2653 ± 117 | 3098 ± 189 | 2296 ± 99 | 2847 ± 37 | 3210 ± 157 | 2340 ± 86 | 2846 ± 91 | 3271 ± 172 |
| Steps/d | 399 ± 967 | 17,599 ± 299 | 34,603 ± 1257 | 543 ± 894 | 17,609 ± 483 | 34,536 ± 1884 | 429 ± 910 | 17,703 ± 327 | 34,747 ± 1110 | 443 ± 845 | 17,788 ± 370 | 34,765 ± 1593 |
| PAL | 1.31 ± 0.04 | 1.55 ± 0.06 | 1.76 ± 0.09 | 1.27 ± 0.05 | 1.53 ± 0.08 | 1.75 ± 0.08 | 1.30 ± 0.03 | 1.57 ± 0.04 | 1.76 ± 0.07 | 1.34 ± 0.05 | 1.55 ± 0.05 | 1.74 ± 0.09 |
| EI, kcal/d | 2789 ± 182 | 3060 ± 254 | 3308 ± 405 | 1794 ± 182 | 2158 ± 254 | 2486 ± 405 | 2390 ± 182 | 2874 ± 254 | 3325 ± 405 | 2978 ± 182 | 3586 ± 254 | 4,161 ± 405 |
| EB, % | 17.5 | 7.0 | −0.3 | −20.5 | −19.0 | −21.0 | 3.4 | 0.0 | 1.6 | 27.6 | 25.4 | 24.2 |
Values are means ± SD, n = 16; steps/d, n = 13–15; PAL, n = 11; TEE and EB for zero EB, CR, and OF, n = 11. Parameters differed between interventions according to study protocol.
Abbreviation: Med, medium.
Appetite hormones
Results for daylong concentrations of appetite hormones are shown in Fig. 3. Ghrelin concentrations were higher with lower ET during CR and OF [all P < 0.05, Fig. 3(a)] except for a nonsignificantly lower ghrelin with high ET compared with medium ET during CR. GLP-1 concentrations were lower, with lower ET during all EB conditions [all P < 0.01, Fig. 3(b)] except for nonsignificant differences between low and medium ET during CR and between medium and high ET during OF. Insulin concentrations were higher with lower ET during OF (low vs high ET and medium vs high ET, both P < 0.01) and EB (medium vs high ET, P < 0.05), whereas no differences were found between insulin concentrations at three levels of ET during CR despite a tendency of higher concentrations with low ET compared with high ET [P = 0.058; Fig. 3(c)]. Daylong insulin and ghrelin concentrations were negatively correlated, with r = −0.34 (P < 0.001).
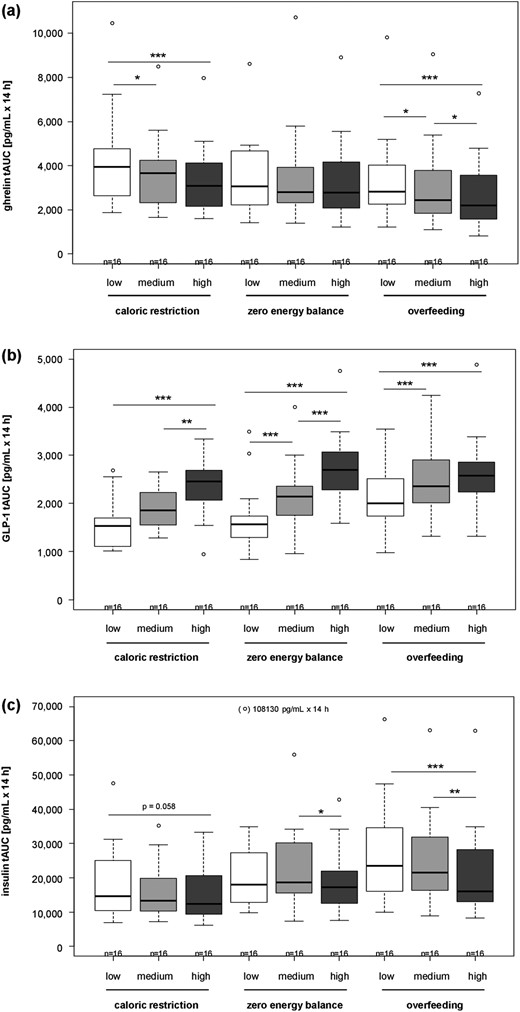
Comparison of daylong appetite hormone responses for ghrelin (a), GLP-1 (b), and insulin (c) as tAUC for 14 h between interventions with differing ET and differing EB. Mean ± SD; n = 16. *P < 0.05, **P < 0.01, ***P < 0.001, by linear mixed model with multiple contrast tests. tAUC, total area under the curve.
Subjective appetite ratings
Results for subjective appetite ratings are shown in Table 2. Hunger was higher with lower ET during EB (all P < 0.01), whereas no differences in hunger were found between levels of ET during CR and OF. Fullness was lower with lower ET during all EB conditions (all P < 0.05) except for nonsignificant differences between medium and high ET during EB and OF. Desire to eat was higher with lower ET during all EB conditions (all P < 0.05) except for nonsignificant differences between low and medium ET for CR and OF and between medium and high ET for EB and OF. Desire for something sweet, salty, or fatty was assessed in a subsample of n = 8 but showed no consistent results (data not shown).
Comparison of Daylong Subjective Appetite Feelings From Visual Analog Scales (All tAUCs) Between Interventions With Differing ET and Differing EB
| CR | Zero EB | OF | |||||||
|---|---|---|---|---|---|---|---|---|---|
| Low ET | Medium ET | High ET | Low ET | Medium ET | High ET | Low ET | Medium ET | High ET | |
| Hunger, mm × 15 h | 660 ± 146 | 578 ± 139 | 542 ± 201 | 559 ± 74 | 466 ± 71a | 409 ± 46a,b | 412 ± 347 | 348 ± 30 | 303 ± 92 |
| Fullness, mm × 15 h | 470 ± 79 | 537 ± 82c | 630 ± 85a,b | 535 ± 72 | 636 ± 114d | 710 ± 178a | 709 ± 120 | 813 ± 123c | 879 ± 145a |
| Desire to eat, mm × 15 h | 678 ± 151 | 630 ± 200 | 502 ± 77a,e | 574 ± 112 | 437 ± 71a | 391 ± 68a | 381 ± 148 | 330 ± 82 | 277 ± 107c |
Values are mean ± SD, n = 16; linear mixed model with multiple contrast tests.
Abbreviations: Med, medium; tAUC, total area under the curve.
P < 0.001, significantly different from low ET.
P < 0.01, significantly different from medium ET.
P < 0.05, significantly different from low ET.
P < 0.01, significantly different from low ET.
P < 0.05, significantly different from medium ET.
EB during ad libitum EI
In line with the findings for appetite hormones and subjective appetite ratings, ad libitum EI led to a more positive EB at a lower ET (low vs medium and low vs high ET, both P < 0.01, Fig. 4). During low and medium ET, EB was positive (+17.5%, P < 0.001 and +7.0%, P < 0.05, respectively), but with high ET, EB was equal (P > 0.05).
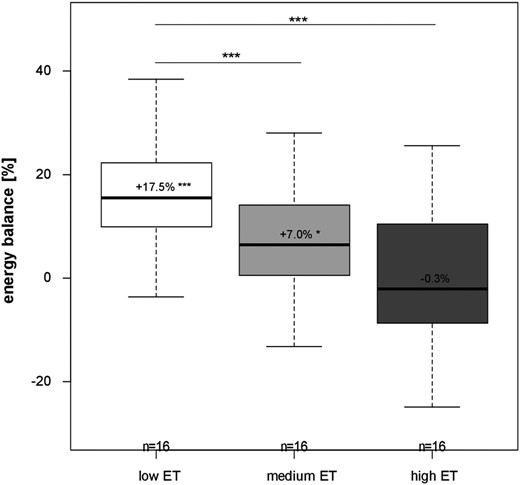
Comparison of EB (%) between interventions with differing ET during ad libitum EI. Mean ± SD; n = 16. *P < 0.05, ***P < 0.001, by linear mixed model with multiple contrast tests.
Discussion
The current study confirms the hypothesis that appetite control is improved at higher levels of ET achieved by low-intensity physical activity. The results are independent of EB and are verified by changes in endocrine signals, subjective appetite ratings, and ad libitum EI: ghrelin concentrations, hunger, and desire to eat were higher, GLP-1 concentrations were lower, and EB during ad libitum EI was positive with low ET compared with high ET.
In a prospective study by Hume et al. (30), gain in fat mass within a 2- to 3-year period was predicted by low ET but not by energy surfeit at baseline using state-of-the-art methods for assessment of total energy expenditure. However, the study was criticized for not measuring real ET but simply examining baseline energy expenditure of weight-stable persons against long-term changes in body fat (31). Nevertheless, the results by Hume et al. are in line with the present randomized intervention study that carefully measured ET at different levels of EB in a whole-room calorimeter and that has demonstrated improved appetite control with increased ET.
The present findings indicate a relationship between decreasing ghrelin levels in the observed concentration range and a reduced food consumption. These findings are confirmed by a meal test trial where physiological ghrelin levels were closely correlated with hunger during the postprandial period and predicted the amount of subsequent food consumption (32). Ghrelin concentrations are known to rise in the fasted state until meal initiation and to fall afterward proportional to the ingested energy content (33). Reduced ghrelin concentrations with increasing ET could therefore be due to higher energy content of meals with increasing ET. It was shown that stomach distention does not directly affect declining ghrelin concentrations (34), indicating that the size or volume per se has no effect on postprandial ghrelin suppression. Because insulin is essential for postprandial ghrelin suppression (35), the inverse correlation between insulin and ghrelin concentrations in the present trial supports an indirect anorexigenic effect of insulin via ghrelin suppression. Because daylong insulin secretion decreased with higher ET [Fig. 3(c)], the direct anorexigenic effect of insulin may be of minor importance. The anorexigenic effect implied by high GLP-1 [Fig. 3(b)] and the suppressed orexigenic effect of ghrelin [Fig. 3(a)] with a higher ET both seem to be sufficient to promote satiety and decrease desire to eat (Table 2). These effects were also found with CR and OF [Fig. 3(a) and 3(b)], and therefore the impact of ET on appetite control seems to be independent of EB.
Beyond ET, the type of energy deficit might also impact appetite control. Equal energy deficits (−1100 kcal/d) induced by 90 minutes of exercise at 70% maximal oxygen uptake or CR differently affected appetite control and food intake in healthy males, with only CR leading to elevated ghrelin concentrations and a compensation of the energy deficit (23). A similar effect in women was already reported earlier (36). The current study confirms these findings despite a lower intensity of physical activity because a high ET achieved by brisk walking led to lower appetite and ad libitum EI compared with low ET. Similarly, no compensatory increases in acylated ghrelin, appetite, or EI were observed after an acute brisk walking session (37). This corresponds to the idea of “exercise-induced anorexia” after an acute bout of moderate-to-vigorous exercise, which is characterized by a short-lived reduction in hunger and a delayed onset of EI but without a full compensation of the energy deficit (38). It is discussed that “exercise-induced anorexia” is mediated by lowered concentrations of acylated ghrelin and elevated concentrations of GLP-1 and PYY [for review, see (39)]. The results of the present trial confirm these findings, as ghrelin was reduced and GLP-1 increased with high ET.
At a low ET, the macronutrient intake may have been too small and therefore not sufficient to stimulate GLP-1 secretion and ghrelin suppression. A threshold effect could therefore explain the lack in satiety (Table 2) and energy overconsumption during ad libitum EI (Fig. 4). This assumption is supported by the finding of higher prospective weight gain with snacking behavior (frequent consumption of small amounts of food) under free-living conditions (40).
In line with our findings, Stubbs et al. (41) showed in a metabolic chamber trial that ad libitum EI does not adequately adapt to a reduction in physical activity (PAL 1.8 to 1.4) and thus led to a positive EB. In the current study, during ad libitum EI, EB was 17.5% positive with low ET. Assuming 13.1 kcal/g for energy content and energy cost of fat mass synthesis (42), an exclusive gain in fat mass would resemble about +32 g for 1 day of inactivity. Therefore, an inactive lifestyle facilitates caloric overconsumption and thus weight gain.
Low-intensity physical activity was chosen to increase the PAL, simulating daily activities without the effects of vigorous exercise on metabolism and avoiding fatigue or pain in persons with very low fitness. Furthermore, low-intensity physical activity is considered to play an important role in promoting health and may be implemented more easily in public health strategies than high-intensity exercise (43). In the current study, a PAL of 1.76 was required to achieve the “regulated zone” of energy expenditure, where appetite is matched to actual energy demand. The setting of a 9-m2 metabolic chamber only allows physical activity on a treadmill and not manifold physical activities (like housekeeping or taking the stairs) as compared with free-living conditions. Therefore, the amount of steps that is necessary to achieve a high ET was ≥34,500 steps per day. Under free-living conditions, the appropriate amount of steps per day would therefore be much lower. In line with our findings, the World Health Organization in 2001 recommended a PAL target of ≥1.75 that represents an individual whose occupation involves regular physical activity (i.e., regular exercise) whereas a PAL of 1.4 represents a sedentary individual (44). Because the difference between a PAL of 1.4 and 1.75 equates to an additional energy expenditure of 490 kcal/d (with an REE of 1400 kcal/d), a public health recommendation of only 150 of 300 min/wk moderate intensity physical activity from 2010 (45) is unrealistically low (43, 46, 47). As an outcome of the International Association for the Study of Obesity First Stock Conference, a consensus statement was published that confirmed the necessary PAL of 1.7 or 45 to 60 min/d moderate intensity physical activity to prevent unhealthy weight gain (46). Accordingly, another study demonstrated that a habitual PAL of ≥1.62 was associated with improved appetite control compared with a PAL of ≤1.49 (48). Because in our study this high level of physical activity was obtained at a low intensity (walking at 4 km/h), this led to an unrealistic long duration of activity. Future studies need to investigate whether a higher intensity of physical activity at a lower duration is equally sufficient for optimal control of EB. Importantly, note that our study was conducted in mostly lean young subjects and a typical Western diet was used (energy density 5.8 kcal/g). Therefore, the PAL necessary to obtain EB may be different in subjects with obesity and a less energy-dense diet.
The role that exercise can play in energy expenditure is commonly exaggerated (49). Our findings show that the positive impact of physical activity on weight control is partially independent of burning up more calories and is additionally explained by an improvement in appetite sensations. Furthermore, increasing physical activity may be easier for most people than eating less [for review, see (50)]. Therefore, maintaining an equal EB due to achieving a high ET seems to be easier compared with obtain a low ET. However, a high level of energy expenditure and thus a high ET may also be a risk factor for future weight gain when ET cannot be maintained in the long term. Thus, a gain in FM is observed with detraining in athletes (51) or postpregnancies (52). Additionally, increasing ET by exercise in people with obesity led to a compensatory increase in EI that alleviated the beneficial effect of exercise on body weight (53).
The extensive study protocol in randomized crossover design and the highly standardized metabolic ward conditions are a strength of our study. Nevertheless, there are also some limitations that should be addressed. We measured total ghrelin concentrations, which may mask relevant changes in acylated ghrelin that seems to be essential for appetite control (37). However, it was found that the ratio of acylated and total ghrelin is relatively robust, rendering total ghrelin an appropriate surrogate (33). Because only acute effects of changes in ET were investigated in the present trial, the results cannot be transferred to long-term habitual high or low ET. In daily life, ET is highly variable from day to day. For example, brief periods where EI far exceeds energy expenditure last from one meal to several days and regularly occur over the weekend (54). In line with our results, others have found that individuals with higher habitual PALs better adjust EI in response to EB perturbations compared with habitually inactive individuals (48, 55). However, long-term interventions are needed to confirm the present findings. Because only three women were investigated in the current study, sex differences in appetite control could not be analyzed. The impact of sex on appetite control remains unclear, with some studies showing sex differences [for review, see (39)] whereas others did not (55).
In conclusion, a high ET improves appetite control, reflected by changes in hormonal biomarkers, including increased GLP-1 and decreased ghrelin and insulin concentrations independent of EB. These results indicate an asymmetric control of appetite where reduced energy expenditure was not compensated by an appropriate adaptation in EI. In contrast to the prevailing concept of body weight control, the positive impact of physical activity is not completely explained by burning up more calories but, at certain volumes, also involves improving appetite control. Importantly, for prevention of weight gain a PAL of 1.76 does not require vigorous physical activity or exercise but can be obtained by low-intensity physical activity (e.g., reached by occupational activities such as postal carriers or nursing professions).
Acknowledgments
Financial Support: This work was supported solely by budgetary resources of the University of Hohenheim, Stuttgart, Germany.
Clinical Trial Information: ClinicalTrials.gov no. NCT03361566 (registered 1 December 2016).
Author Contributions: A.B.-W. designed research; F.A.H., F.B., and A.N. conducted research; F.A.H. analyzed data; A.N. analyzed metabolic chamber data; F.A.H. and A.B.-W. wrote the paper and had primary responsibility for the final content; M.H. gave statistical advice and wrote R code; A.B.-W., F.A.H., F.B., M.J.M., and J.E.B. discussed the data; and all authors read and approved the final manuscript.
Additional Information
Current Affiliation: F.A. Hägele’s, F. Büsing’s, M.J. Müller’s, and A. Bosy-Westphal’s current affiliation is Department of Human Nutrition, Institute of Human Nutrition and Food Sciences, Christian Albrechts University, Kiel, Germany). A. Nas’s current affiliation is Department of Applied Nutritional Science and Dietetics, Institute of Nutritional Medicine, University of Hohenheim, Stuttgart, Germany.
Disclosure Summary: The authors have nothing to disclose.
Data Availability:
The datasets generated during and/or analyzed during the current study are not publicly available but are available from the corresponding author on reasonable request.
Abbreviations:
- CR
caloric restriction
- EB
energy balance
- EI
energy intake
- Erq
energy requirement
- ET
energy turnover
- FMI
fat mass index
- OF
overfeeding
- PAL
physical activity level
- REE
resting energy expenditure
- SEE
sleeping energy expenditure
- TEE
total energy expenditure during 24 hours
- VAS
visual analog scale
