


Abstract
Increased PTH after successful parathyroid surgery represents a clinical conundrum. We aimed to determine the prevalence of persistently elevated PTH (PePTH) postsurgery, along with predisposing factors.
and Setting: Patients ≥ age 18 with parathyroidectomy performed at University of North Carolina Hospitals for primary hyperparathyroidism (PHPT) over a 12-year period were identified from the Carolina Data Warehouse. Clinical and demographic characteristics were collected, transformed, and analyzed.
Five hundred seventy patients met initial criteria for PHPT, and of those 407 had postoperative values. One hundred forty-four had laboratory results within 3 to 18 months post operatively. There was no clinical difference between those with and without long-term laboratory follow-up. Presurgery, patients had average calcium of 11 mg/dL and PTH 125.4 pg/mL. Ninety-seven percent of patients had normalized calcium after surgery, but 30% had PePTH, which can be predicted at 3 months. Patients with PePTH (persistent elevation of PTH) after surgery did not differ from those with normalized PTH in terms of sex, age, body mass index, or excised gland weight; presurgery 25-vitamin D was slightly lower, but not abnormal (26 ± 15 vs 36 ± 11). The presurgical PTH was significantly higher (P < 0.001) in those with PePTH (156.5 pg/mL compared with presurgical level of 102.5 in those whose PTH normalized).
Nearly one-third of PHPT patients have elevated PTH levels postsurgery in a tertiary hospital setting. At presentation, patients with PePTH tend to have higher PTH relative to calcium levels. Whether PePTH after surgical treatment of PHPT has pathological consequences is unknown.
Primary hyperparathyroidism (PHPT) is the third most common endocrine disorder after diabetes and thyroid disease with a prevalence of 0.1% to 1%. Indications for parathyroidectomy to treat PHPT have changed over time. In 2014, the National Institutes of Health guidelines were broadened to include patients with vertebral fractures, and nephrolithiasis or nephrocalcinosis on imaging as indications for surgery (1). The 2014 Fourth International Workshop for the Management of Asymptomatic Primary Hyperparathyroidism further suggested considering parathyroidectomy for normocalcemic PHPT if the patient demonstrated worsening bone mineral density, any fragility fracture, kidney stones, or nephrocalcinosis (1). This approach, along with the inclusion of osteoporosis (T score ≤ −2.5) in an incident population that is older and disproportionally female, promises to increase the number of parathyroid surgeries. Furthermore, the availability of a minimally invasive outpatient surgical approach has already increased the number of patients referred for surgery. A survey of endocrine surgeons showed that from 1980 to 2000, the number of parathyroidectomy operations performed every 5 years nearly tripled, with more than half utilizing a minimally invasive approach (2).
Successful surgery, defined as a normal calcium 6 months postoperatively, is achieved in > 95% of cases (3, 4). The use of intraoperative PTH sampling has allowed many surgeons to perform a focused exploration, whereas others continue to perform a four-gland exploration. Four-gland exploration will yield more visually abnormal glands that are removed, although the success rate of both procedures appear to be equivalent (3). Despite the success of surgery, it has been widely reported in the literature that many patients who achieve normalized serum calcium continue to have elevated PTH levels (5, 6). Overall, persistent elevation of PTH after surgery has been reported over a range from 3% to 46%, with an average among series of 24% (5).
The purpose of our study was to determine the prevalence of persistently elevated PTH (PePTH) at our tertiary referral center, and to generate potential hypotheses for predisposing biologic variables. Understanding outcomes after parathyroid surgery is increasingly important given the increased rates of surgery for both clinical and subclinical hyperparathyroidism.
Materials and Methods
Study subjects
Patients age 18 and older with parathyroidectomy performed at University of North Carolina (UNC) Hospitals in Chapel Hill, North Carolina from 1 January 2004 to 16 May 2016 were identified from the Carolina Data Warehouse. The institutional review board approved the study. The Carolina Data Warehouse is a central data repository containing clinical, research, and administrative data sourced from the UNC Health Care System. Patients were located using CPT code 60500 for parathyroidectomy and ICD9 code 252.0, or ICD10 code E21 for hyperparathyroidism. Any patient with PTH measured post operatively was included. Those with creatinine ≥ 2 were excluded. Chart review was performed to exclude patients with genetic predisposition to hyperparathyroidism such as multiple endocrine neoplasia. Clinical and demographic characteristics captured included age, sex, body mass index (BMI), parathyroid hormone, calcium, vitamin D (total), creatinine, and urinary calcium prior to and up to 18 months postsurgery, performed as standard protocol by UNC Laboratories. PTH values measured were intact.
Statistical methods
Serum measurements for PTH and biomarkers both pre and postsurgery revealed varying numbers of measurements (e.g., between 0 and 15 presurgery calcium readings). These were aggregated into a single value to represent each patient. We transformed skewed and heteroscedastic distributions of patient data by conducting Box-Cox analyses of ANOVAs using patients as a categorical variable. The resulting transformation to normality and homoscedasticity was then applied to each patient’s data and the mean from the transformed values was used. It is important to note that the back-transformation of these means constitute estimates of the median of each patient’s distribution of values. We defined “presurgery” as the mean of all transformed values in the month prior to surgery. If there were no values in that period, the single transformed value closest in time prior to surgery was used.
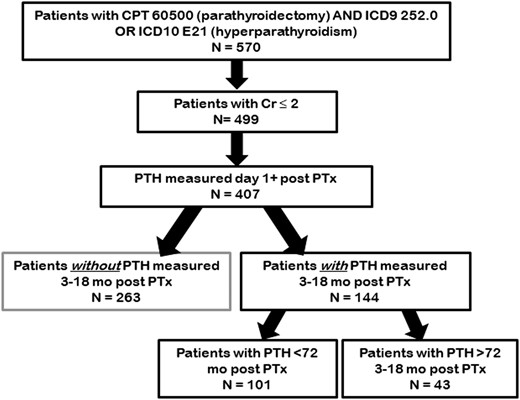
Our primary outcome measure was PTH values measured > 9 months postsurgery (see Fig. 1). As many patients having surgery in our center did not receive long-term follow-up directly within the UNC system, their postsurgical PTH levels were lost to follow-up. We assessed whether these missing data points biased our sample by comparing the known presurgery values for laboratory tests on patients with available follow-up to those patients without follow-up values. We further describe our sample by comparing those patients whose postsurgery PTH values are “high” to those whose values are “normal” within the subset that have readings in our designated window. In neither case do we control for multiplicity of tests.
Patient cohort.
We performed exploratory analyses to determine if PTH levels were stable 3 to 18 months postsurgery. We fit a mixed effects model regressing individual PTH readings within that interval as a polynomial function of time with random effects for patients. We also looked at the distribution of slopes over time for those patients with sufficient PTH measurements to allow fitting of individual regressions. Patients with measurements both prior to and after 9 months were classified as “high” or “normal” and checked to see if such classifications were consistent over this period.
To test whether the relationship between pre- and postsurgical PTH values is moderated by presurgery calcium levels, we fit a multiple regression model to predict postsurgery PTH from presurgery PTH, calcium, and their interactions, using α = 0.05 as criterion for significance. If the interaction was sufficiently nonsignificant (P > 0.20), we refit the model without the interaction term for greater interpretability.
Results
Characteristics of primary hyperparathyroid patients treated with surgery
Records for patients with PHPT who had parathyroidectomy performed from 2004 to 2016 at UNC Hospitals were obtained via Carolina Data Warehouse search. Five hundred seventy patients were identified, and of those 499 had a creatinine < 2 (Fig. 1). Postoperative (at least 1-day postsurgery) values for PTH and calcium were available in 407 patients, with 144 patients having PTH measurements within 3 to 18 months after surgery.
Examination of within-patient distributions of the laboratory values shows that PTH, calcium, urinary calcium, and creatinine were highly skewed and heteroscedastic. Box-Cox analyses determined that PTH, calcium, and urinary calcium became normally distributed with constant variance following logarithmic transformations; for interpretation, we used log base 2 transformations. Creatinine and urinary creatinine also required transformations for aggregation, via the square root and reciprocal of the square root, respectively. Transformed variables were used for all subsequent analyses. In contrast, the distributions of phosphorous and vitamin D were sufficiently normal and were not transformed before patient means were taken.
Table 1 describes the patient characteristics of those meeting the search criteria. The average age was 57.6 ±13.9, 79% female, and BMI 30.3 ± 7.6. The median presurgery values were as follows: calcium 11 mg/dL and PTH 125 pg/mL (the distributions were nonnormal, so these numbers represent back transformations). There were 129 vitamin D3 levels available with a mean of 30.6 ± 12.55 ng/mL.
Presurgical Clinical Characteristics Stratified by Availability of Follow-Up Values
| Readings Within 3–18 mo | |||||
|---|---|---|---|---|---|
| Variable | Overall | No | Yes | P | Reference Range |
| N | 407 | 263 | 144 | ||
| Sex | |||||
| Female | 328 (80.6) | 207 | 121 (84) | ||
| Male | 79 (19.45) | 56 | 23 (16) | 0.277 | |
| Age | 57.57 ± 13.92, n = 395 | 57.38 ± 13.77, n = 254 | 57.90 ± 14.24, n = 141 | 0.723 | |
| BMI | 30.28 ± 7.60, n = 314 | 30.76 ± 7.59, n = 192 | 29.53 ± 7.6, n = 122 | 0.165 | |
| Calcium | 11 [10.6–11.4], n = 399 | 10.9 [10.6–11.4], n = 257 | 11.1 [10.6–11.4], n = 142 | 0.373 | 8.5–10.2 mg/dL |
| 24-h urine calcium | 284 [182–393], n = 114 | 280 [193–396], n = 64 | 296 [176–385], n = 50 | 0.782 | 100–300 mg/24 h |
| Creatinine | 0.86 [0.73–1], n = 379 | 0.86 [0.72–1], n = 242 | 0.84 [0.74–1], n = 137 | 0.459 | 0.6–1 mg/dL |
| Phosphorus | 3.06 ± 0.54, n = 306 | 3.01 ± 0.54, n = 188 | 3.13 ± 0.54, n = 118 | 0.05 | 2.9–4.7 mg/dL |
| PTH | 125.4 [91.8–174.9], n = 361 | 130.7 [93.1–183.5], n = 224 | 122.8 [85–168.9], n = 137 | 0.159 | 12–72 pg/mL |
| Vitamin D | 30.63 ± 12.55, n = 129 | 29.34 ± 11.79, n = 78 | 32.61 ± 13.51, n = 51 | 0.145 | 20–80 ng/mL |
Categorical variables (sex) are summarized with counts and (percentages), and tested with a χ2 test. Continuous variables that are sufficiently normal are summarized with means ± SDs, and tested with t tests. Continuous variables that are highly skewed and heteroscedastic are summarized with medians and [quartiles], and tested with the Mann-Whitney U test.
Long term follow-up of patients postsurgery
Of the 407 patients in our data set, 3 to 18 months postoperative PTH was unavailable in 65%. To assess whether patients receiving follow-up in our tertiary referral center were equivalent to those lost to follow-up, we queried presurgical demographic and laboratory data. The demographics of patients with missing data were not significantly different than those who had data at 1 year (Table 1). They were predominantly women (79%) with average age 57 ± 13.7 and BMI 30.8 ± 7.6. The precalcium was 10.9 mg/dL with a PTH of 130.7 pg/mL, which was not significantly different from that of the group for which we had data at 1 year (11.1 mg/dL and 122.8 pg/mL, respectively). There was also no statistical difference in the BMI, or presurgical values for calcium, creatinine, 24-hour urine calcium, PTH, or vitamin D, when compared with those with available follow-up laboratory testing. To further assess possible effects of dropout, we also tested if presurgery values differed between those with data > 9 months post and those with data only in the earlier (3 to 9 months) postsurgery follow-up period (not shown). None of the variables differed significantly (all Ps > 0.10). We concluded that it was reasonable to use complete case analysis to address our study questions.
Available individual PTH readings between 3 and 18 months postsurgery are displayed in Fig. 2. A linear mixed effects models regressing individual log2 PTH readings on a second degree polynomial function of time was not significant (χ2 = 4.3, df = 2, P = 0.11). Twenty-two patients had enough readings within 3 to 18 months to perform individual regressions of their measurements as a function of time. The mean slope for a linear function of time was approximately zero, which we interpreted to mean as that the PTH data were stable over time. Thirty-six patients had readings in both the 3- to 9-month and 9- to 18-month time periods. Of those, 28 were either both “normal” or both “high,” revealing a statistically significant degree of agreement (κ = 0.5, P = 0.001). We split the patients into those with PePTH measured anytime between 3 and 18 months after surgery. Of patients with elevated PTH, 36% of the collected values were measured at 3 to 9 months and 28% had measures at 9 to 18 months. These proportions did not differ significantly (χ2 = 0.9, df = 1, P = 0.34), allowing use of a wider 3- to 18-month window within which to aggregate postsurgical PTH values.
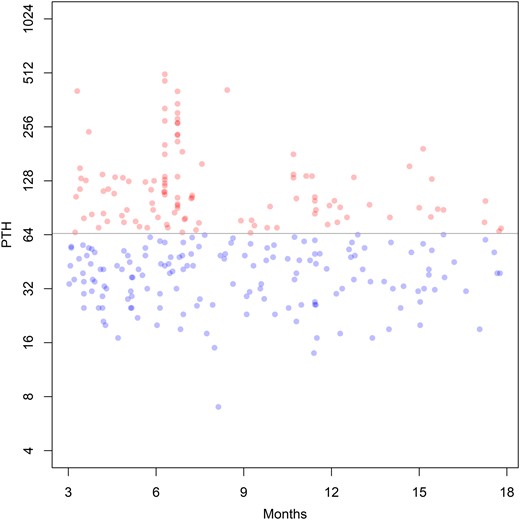
Individual postsurgery PTH readings from 3 to 18 mo postsurgery. If the individual reading was “normal,” it is represented by a blue dot; if it was “high,” it is represented by a red dot. The points are semitransparent to show overlapping values (which then appear darker). The horizontal line demarcates the boundary between “normal” and “high” readings according to conventional criteria. Note that the vertical scale is log base 2; i.e., each vertical increment represents a doubling of the laboratory value.
Clinical characteristics of the patients with PePTH
After demonstrating data stability, patients were separated into those with elevated (30%) vs normal PTH at 1-year postoperatively. Table 2 compares patients whose mean log2 postsurgical PTH were “high” to those “normal” for all patients with readings in that interval. Patients with high PTH at 3 to 18 months were 79% female, compared with 86% female with normal PTH. Age and BMI of patients with high PTH did not differ from those with normalized PTH: average age of 57.4 ± 14.1 and 59.22 ± 14.8, and BMI of 29.1 ± 8 and 30.49 ± 6.73, respectively. Gland weights were recorded for 117 of 144 patients; they did not differ significantly between the groups. The median weight was 0.80 for those with normalized PTH vs 1.0 for patients with elevated PTH. Postsurgery, calcium remained above normal in 3% of patients, consistent with expected surgical success rates (3, 4).
Descriptive Statistics for Demographics and Presurgery Biomarkers for Those Patients With PTH (3–18 mo), Stratified by Postsurgical PTH Values
| High PTH Within 3–18 mo | |||||
|---|---|---|---|---|---|
| Variable | Overall | No | Yes | P | Reference Range |
| N | 144 | 101 | 43 | ||
| Sex | |||||
| Female | 121 (84) | 87 | 34 | ||
| Male | 23 (16) | 14 | 9 | 0.417 | |
| Age | 57.90 ± 14.24, n = 141 | 56.82 ± 14.54, n = 103 | 59.22 ± 14.75, n = 41 | 0.374 | |
| BMI | 29.53 ± 7.6, n = 122 | 28.96 ± 7.90, n = 87 | 30.49 ± 6.73, n = 38 | 0.301 | |
| Calcium | 11.1 [10.6–11.4], n = 142 | 11.1 [10.6–11.5], n = 102 | 11 [10.5–11.3], n = 43 | 0.305 | 8.5–10.2 mg/dL |
| 24-h urine calcium | 296 [176–385], n = 50 | 267 [185–393], n = 38 | 311 [137–357], n = 12 | 0.683 | 100–300 mg/24 h |
| Creatinine | 0.84 [0.74–1], n = 137 | 0.81 [0.74–1], n = 95 | 0.91 [0.8–1.09], n = 42 | 0.03* | 0.6–1 mg/dL |
| Phosphorus | 3.13 ± 0.54, n = 118 | 3.17 ± 0.52, n = 84 | 3.05 ± 0.6, n = 34 | 0.279 | 2.9–4.7 mg/dL |
| PTH | 122.8 [85–168.9], n = 137 | 102.5 [75.6–145], n = 96 | 156.5 [122.8–240.5], n = 41 | <0.001* | 12–72 pg/mL |
| Vitamin D | 32.61 ± 13.51, n = 51 | 35.57 ± 11.64, n = 35 | 26.12 ± 15.38, n = 16 | 0.019 | 20–80 ng/mL |
| Gland weight | 0.80 (0.40–1.70), n = 117 | 0.80 (0.40–1.50), n = 81 | 1.00 (0.60–1.70), n = 36 | 0.139 | grams |
Categorical variables (sex) are summarized with counts and percentages, and tested with a χ2 test. Continuous variables that are sufficiently normal are summarized with means ± SDs, and tested with t tests. Continuous variables that are highly skewed and heteroscedastic are summarized with medians and [quartiles], and tested with the Mann-Whitney U test. Significant difference between groups defined by high PTH within 3 to 18 mo is shown with an asterisk.
The clinical characteristics of patients with high PTH differed only in the presurgery values for PTH, vitamin D, and creatinine. Presurgery vitamin D was 26.1 ± 15.4 ng/mL in the group with elevated PTH after surgery and 35.6 ± 11.6 in the group with normal PTH after surgery (P = 0.019). Presurgery creatinine was 0.81 mg/dL in the group with normal PTH after surgery and 0.91 in the group with elevated PTH after surgery (P = 0.03). However, the difference did not remain significant after adjusting for age (P = 0.09). Most importantly, presurgery PTH was significantly elevated at 156.5 pg/mL for those that had elevated PTH at 3 to 18 months, as compared with 102.5 pg/mL in those with normalized PTH (P < 0.001).
Model for predicting elevated PTH postsurgery
The test of the interaction of presurgery PTH with calcium was not significant [F(1, 133) = 0.0002, P = 0.99]. Therefore, we fit a simpler model without the interaction term to facilitate interpretation. In the additive model, presurgery PTH was significantly related to postsurgery PTH (β = 0.43, t = 6.1, P < 0.001). Presurgery calcium was also significantly, but inversely, related to postsurgery PTH (β = −2.44, t = −3.2, P = 0.002). Thus, patients with higher PTHs, and lower calcium levels presurgery were more likely to have an elevated PTH postsurgery. Figure 3 displays presurgery PTH and calcium data with a line demarcating the boundary between the regions where the model predicts “normal” and “high” postsurgery PTH values. This model suggests that the presurgical values can potentially identify patients who are more likely to have persistent postsurgical elevation of PTH despite normal calcium: as a rule, these patients have laboratories where higher PTH levels are associated with lower elevations in calcium, suggesting resistance to the hormone.
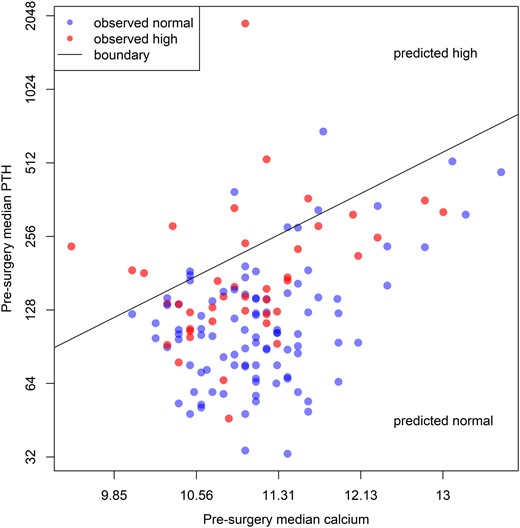
Estimated median presurgery values for calcium and PTH. If the postsurgery estimated median is “high,” the patient is represented in red, otherwise in blue. The points are semitransparent to show overlapping values (which then appear darker). The diagonal line constitutes the set of paired presurgery values that yield predicted postsurgery PTH values of exactly 65; it demarcates the boundary between the region where most patients will have “normal” postsurgery PTH values and the region in which most patients will have “high” values. Note that both axes are log base 2; i.e., constant spatial increments represent different amounts of the laboratory value.
As sensitivity analyses, we replicated these tests using different temporal windows for postsurgery PTH values (viz., all available data, and including only readings between 9 and 15 months). In all replications, the pattern of significances was the same (nonsignificant interactions, significant presurgery PTH, and calcium) and the estimated slopes for presurgery PTH and calcium were within one standard error of the values in our primary model. As another sensitivity analysis we dropped a single, high-influence patient whose presurgery PTH was nearly 2000 and who had high PTH postsurgery, and reran the analyses. Again, the qualitative pattern of significances was the same and the estimated βs from the models were highly similar.
Discussion
The development of minimally invasive parathyroidectomy and broader indications for surgery have led to an increase in surgical management of PHPT. The most recent guidelines for asymptomatic hyperparathyroidism recommend surgery based on bone density, urine calcium, and evidence of renal disease, even in the presence of normal serum calcium (1). With increasing numbers of surgeries, emerging data suggests that a substantial number of patients will have PePTH. In our series, 97% patients had normal calcium postsurgery, but of those with laboratory values available for follow-up, 30% continued to have elevated PTH levels. Our results are consistent with prior reports describing PePTH. For example, in one cohort of 62 patients undergoing surgery for PHPT, 21% had elevated PTH at 6 months despite achieving normocalcemia (7). Lavryk et al. (8) described an isolated elevation of PTH in ∼23% of postsurgical patients at 12 months. Another study showed that there was normocalcemic elevation in PTH after 5 months in 28% of patients (9). Another group tracked 96 patients for more than 10 years after successful parathyroidectomy: nearly half demonstrated elevated PTH at some point during follow-up (10). In a PubMed search, de la Plaza reviewed 33 studies that followed PTH postsurgery: the prevalence of PePTH was 12% to 43% prior to 3 months, and 3% to 46% at greater than 6 months (5). The increasing awareness of the large percentage of patients with PePTH raises questions about whether PePTH can be predicted and whether there are etiologies that can be addressed.
Risk factors for PePTH have been thought to include older age, high preoperative PTH (9, 11–13), larger adenomas (4, 13), vitamin D deficiency (11, 12, 14, 15), higher serum creatinine or lower glomerular filtration rate (11, 14), and high bone turnover (13). Although we found no evidence for association with age, vitamin D deficiency, or weight of the gland excised, our data did indicate that a high preoperative PTH correlated with an increased risk of PePTH. This relationship suggests that this group of patients may have an altered set point for PTH release. This might involve parathyroid hormone resistance (higher parathyroid hormone required to maintain their calcium levels), or decreased sensitivity of the calcium sensing receptor.
Several candidate genes have been linked to parathyroid adenomas arising out of familial hyperparathyroid syndromes, including GCM2, which functions in parathyroid development (16), MEN1 (17), tumor suppressor genes (e.g., SFRPs, AP2S1), and proto-oncogenes (RET, EXH2) (18). Although 10% of patients with PHPT have hereditary disease involving multiple other endocrine systems (syndromic) or forms of isolated PHPT (19), most PHPT patients do not meet criteria for genetic disease.
Although many surgeons equate postoperative normocalcemia with a curative procedure, whether PePTH represents insufficient surgery is unclear. This raises the question of whether a more limited neck exploration is inferior to four-gland exploration. Mazzaglia et al. (4) compared the rate of PePTH at 2 weeks between limited parathyroid exploration and four-gland exploration and found that those who underwent a four-gland exploration had a higher prevalence of PePTH, even though more glands, on average, were removed. This suggests that the type of surgery should not impact the incidence of PePTH; however, in the Mazzaglia et al. (4) study, patients who underwent a limited neck exploration were also treated routinely postoperatively with supplemental calcium, which might improve rates of normal PTH postsurgery. A retrospective analysis of uncontrolled patient-initiated calcium supplementation in patients with PePTH 5 months after surgery was linked to normalization of PTH in some (9). However, there have been no controlled, prospective studies of calcium supplementation. Similarly, an association of vitamin D deficiency with PePTH has also been suggested by many authors (7, 12, 14, 20–22). In our study, the presurgical vitamin D levels were significantly lower in those with elevated PTH postsurgery. We did not have enough postsurgery vitamin D levels to significantly analyze as an associated factor.
Surgery is recommended as standard of care to prevent complications of hypercalcemia. A recent meta-analysis that included five randomized control trials of patients with mild uncomplicated PHPT suggests that there were no differences between active surveillance and parathyroidectomy in terms of fractures, nephrolithiasis, cardiovascular events, or death, whereas one included randomized control trial showed a statistically significant increase in bone mineral density (23). Due to increased rates of screening in the osteoporotic population, more patients with minimally elevated or normocalcemic PHPT are being identified. Mild, asymptomatic hyperparathyroidism was associated with skeletal changes by dual-energy X-ray absorptiometry and high resolution peripheral quantitative computed tomography, and bone quality appears to improve 1 year after parathyroid surgery (24). Cipriani et al. (25) studied patients with mild, asymptomatic PHPT, and replete vitamin D and found that 2 years after surgery there were improvements in bone microarchitecture by peripheral quantitative computed tomography. Neither of these positive studies with respect to bone end points reported PTH at the time of bone assessment. In a more recent retrospective study, the results of surgery were reported in 71 patients with normocalcemic PHPT. Of these, pre- and postsurgical bone mineral density was available in 38 patients. Patients with a normal PTH postsurgery had improvements in bone mineral density, whereas those with PePTH postsurgery did not (26). In contrast, Westerdahl et al. (13) compared a small group of patients (n = 17), of whom six had PePTH; here patients with PePTH showed an increase in bone mineral content at 1 year, whereas patients with normal PTH levels did not. More definitive prospective studies are needed to define the effects of a postoperative PTH elevation on bone.
Our retrospective study has limitations. Although our analysis suggests that patients lost to follow-up did not differ from those we were able to analyze, this group represented only approximately half of patients receiving parathyroidectomy in our center. Our patient data set had limited availability of vitamin D values, so we cannot fully rule out a role for secondary hyperparathyroidism due to vitamin D deficiency. It should be noted that pathology reports for excised glands showed significant variation in reporting; many did not have gland weight or had fragments of parathyroid gland. As such it may be premature to draw conclusions regarding these weights with respect to the presence of PePTH. Finally, we did not have bone density measurements.
In summary, our analysis suggests that fully a third of patients undergoing minimally invasive parathyroidectomy will continue to have elevated PTH, despite normalization of calcium. A higher PTH level and lower serum calcium level were predictive of PePTH postoperatively. We also found that elevated PTH measured at 3 months will predict continued hormone elevation. In those patients with PePTH, we would advocate follow-up to eliminate secondary causes of hyperparathyroidism. Further studies are necessary to determine if the PePTH levels are associated with significant effects on bone.
Acknowledgments
Financial Support: Supported by the National Center for Advancing Translational Sciences (NCATS), National Institutes of Health, through Grant Award Number UL1TR002489.
Disclosure Summary: The authors have nothing to disclose.
Data Availability:
All data generated or analyzed during this study are included in this published article or in the data repositories listed in References.
Abbreviations:
- BMI
body mass index
- PePTH
persistently elevated PTH
- PHPT
primary hyperparathyroidism
- UNC
University of North Carolina
