


Abstract
Recent data on long-term outcomes and aggressiveness of medullary thyroid carcinoma (MTC) are lacking for patients with multiple endocrine neoplasia type 2 (MEN2).
To analyze the long-term outcomes in MEN2 and compare MTC aggressiveness in three defined RET mutation-risk categories: moderate risk (MOD), high risk (H), and highest risk (HST).
Retrospective study of 263 operated patients with MEN2 from one German tertiary referral center from 1979 to 2017 comparing demographic, biochemical, genetic, and outcome parameters
None (observational study)
Long-term survival and outcomes in three risk groups
Surgery was performed at a mean age of 35.3 ± 18.8 (MOD, n = 122), 23.0 ± 15.7 years (H, n = 120), and 14.9 ± 9.3 (HST, n = 21) years (P < 0.05). The mean follow-up was 12.9 ± 9.8 years. Age and tumor stage at diagnosis differed among the three risk groups (P < 0.0001). Multivariate analysis of disease-specific survival (DSS) showed that increasing age [hazard ratio (HR), 1.06; 95% CI, 1.02 to 1.09], stage III/IV at diagnosis (HR, 7.39; 95% CI, 2.39 to 22.8), and HST group (HR, 14.4; 95% CI, 3.32 to 62.6) were significantly associated with worse DSS; the H group was not (P = 0.175). The DSS rates and outcomes were not different between the MOD and H groups (P = 0.179 and P = 0.893, respectively) but were significantly inferior in the HST group (P < 0.0008 and P < 0.0001, respectively).
MTC in patients with MEN2 showed a clearly different age of onset in the different risk groups. DSS and outcomes after MTC diagnosis were similar in the MOD and H groups, suggesting similar tumor behavior. The HST group had inferior outcomes and survival vs the MOD and or H groups.
Multiple endocrine neoplasia type 2 (MEN2) is an autosomal-dominant inherited cancer syndrome characterized by a high penetrance of medullary thyroid carcinoma (MTC). MTC represents the most common cause of morbidity and mortality for patients with MEN2 and is usually the first clinical presentation of the disease. The syndrome is caused by one of several identified germline mutations in the RET (rearranged during transfection) proto-oncogene, with a strong genotype–phenotype correlation (1–3). A number of codon-specific RET mutations have been well defined and stratified into risk levels by the American Thyroid Association (ATA). The ATA guidelines for the management of MTC have categorized mutations as moderate risk (MOD), high risk (H), and highest risk (HST) (2). The guidelines have defined the HST category (RET M918T mutations) as a distinct clinical entity with its own phenotype (MEN2B). This category has the earliest onset, poorer clinical outcomes, and increased MTC aggressiveness compared with MEN2A. Within MEN2A, the guidelines have defined an H RET category (mainly codon 634 mutations), which has been associated with more aggressive disease, and a MOD risk category (all other RET mutations), which has been associated with later onset and more benign behavior than the H category. This categorization has been based on mutations associated with similar MTC disease aggressiveness and the assumption that individuals with an earlier development of the disease would also develop metastatic disease earlier, leading to worse outcomes, and, therefore, must have more virulent mutations.
Despite this classification, the disease patterns vary greatly within a defined risk group with the same codon-specific mutation and, even, within the same family (4, 5). The HST patients (MEN2B) will develop MTC at an early age but with wide-ranging aggressiveness. Recent studies found good long-term overall and stage-specific survival rates for patients with MEN2B, which suggested that MTC in MEN2B might not be intrinsically more aggressive than MTC in MEN2A or sporadic MTC (6, 7). Another comparative study found that patients with MOD and H germline RET mutations experienced similar overall survival and intervals to the development of distant metastatic disease after diagnosis, suggesting that MTC is similar in clinical aggressiveness after the pathologic diagnosis (8).
In the present, large, single-institution study of 263 patients with MEN2, we analyzed the clinical disease-specific survival (DSS) and outcomes in the three RET mutation risk groups in MEN2 during the past 40 years.
Patients and Methods
Patients
We performed a retrospective medical record review of 329 patients with an established MEN2 diagnosis from 1979 to 2017. Using a standardized case report form, we retrieved epidemiological, genotypic, clinical, biochemical, and imaging data and data from the surgical procedures. All the patients had been seen at regular intervals, every 6 to 12 months, by two of us (K.F.-R., F.R.) at the endocrine outpatient clinic of the University of Heidelberg (1979 to 1995) and at a specialized endocrine practice in Heidelberg (1996 to 2017). Care was provided in accordance with the state-of-the-art clinical and therapeutic protocol at the diagnosis (2, 9).
Methods
All laboratory tests and imaging procedures were performed as part of routine care using standard commercial tests. Calcitonin (Ctn) was measured using a wide variety of assays during the 40-year interval. The patients were considered cured of MTC when the Ctn values were considered undetectable according to the functional sensitivity of the assay used or when the serum Ctn level was within the reference range at the last biochemical follow-up examination or <10 pg/mL.
MEN2 was diagnosed if the genetic analysis showed a mutation of the RET gene. A total of 35 patients were excluded from the analysis: 7 with unavailable RET molecular analysis results and 28 with only insufficient data available. Of the remaining 294 patients with verified RET mutations, 31 were gene carriers who had not yet undergone surgery and 263 who had undergone thyroidectomy. MTC and/or C-cell hyperplasia was diagnosed from the histopathological examination findings. The tumor stage was defined according to the American Joint Committee on Cancer TNM classification, 7th edition (10), and were based on the clinical and pathological assessments. C-cell hyperplasia only was classified as stage 0.
The 263 patients with MEN2 were subgrouped by risk categories according to the RET mutation status, as suggested by the ATA: HST (codon 918; n = 21), H (codons 634 and 883; n = 120), and MOD (all other mutations, excluding codon 918 and codons 634 and 883; n = 122; Table 1) (2). The patients belonged to 118 families, 54 in the MOD, 44 in the H, and 20 in the HST group. The number of index patients was 53, 27, and 20 in the MOD, H, and HST groups, respectively. Some of the index patients were not in our care. If the first screening in the families revealed signs or symptoms of MEN2, the patients underwent surgery directly (40, 52, and 1 in the MOD, H, and HST group, respectively). In the asymptomatic gene carriers, surgery was delayed by 2 ± 1.3 years in MOD and 1.6 ± 0.7 years in the H group until the Ctn level was greater than the upper reference range (27 patients in the MOD and 41 patients in the H group). Time-dependent onset and progression of MTC were determined by comparing the mean age at stage I (T1 tumor) and stage III (lymph node-positive disease) of the patients, stratified by the ATA risk group.
Description of MEN2 Cohort of Surgically Treated Patients Classified in Three RET Mutation Risk Groups
| Characteristic | All Patients | ATA MOD Group | ATA H Group | ATA HST Group | P Value |
|---|---|---|---|---|---|
| Genotype | NA | Exon 10, 13–15 | RET C634X, A883F | RET M918T | |
| Patients, n | 263 | 122 | 120 | 21 | |
| Age at surgery, y | |||||
| Mean ± SD | 28.0 ± 18.1 | 35.3 ± 18.8 | 23.0 ± 15.7 | 14.9 ± 9.3 | < 0.0001a |
| Median (range) | 25 (0.5–81) | 33 (1-78) | 21 (1–81) | 15 (0.5–40) | H-HST, 0.043b |
| Sex, n (%) | |||||
| Male | 113 (43) | 55 (45) | 52 (43) | 6 (29) | |
| Female | 150 (57) | 67 (55) | 68 (57) | 15 (71) | |
| Stage, n (%) | < 0.0001c | ||||
| All | 260 (100) | 121 (100) | 118 (100) | 21 (100) | |
| 0 | 47 (18) | 31 (26) | 15 (13) | 1 (5) | |
| I | 82 (32) | 30 (25) | 50 (42) | 2 (10) | |
| II | 46 (18) | 17 (14) | 26 (22) | 3 (14) | |
| III | 67 (25) | 38 (31) | 22 (19) | 7 (33) | |
| IV | 18 (7) | 5 (4) | 5 (4) | 8 (38) | |
| Follow-up duration, y | 0.0001d | ||||
| Mean ± SD | 12.9 ± 9.8 | 10.8 ± 9.0 | 15.8 ± 9.5 | 13.3 ± 12.1 | |
| Median (range) | 12 (1–48) | 7.5 (1–38) | 16 (1–46) | 9 (1–48) | |
| Status at final follow-up, n (%) | 261 (100) | 122 (100) | 118 (100) | 21 (100) | |
| No evidence of disease | 144 (55) | 69 (56) | 72 (61) | 3 (14) | < 0.0001c |
| Minimal disease | 55 (21) | 28 (23) | 23 (19) | 4 (19) | |
| Metastasis | 39 (15) | 17 (14) | 15 (13) | 7 (33) | M-H, 0.8936c |
| Death from disease | 23 (9) | 8 (7) | 8 (7) | 7 (33) |
Abbreviation: M-H, moderate-high.
ANOVA.
t Test.
χ2 Test.
Kruskal-Wallis-test.
The primary endpoints were DSS (death from MTC) and the final outcome at the end of the study period. The survival time was calculated as the interval from the initial operation for MTC until death from MTC or the last follow-up examination. For the final outcome analysis, the patients were stratified into four groups according to their response to therapy: cured (biochemical evidence of cure, with Ctn undetectable or within the normal range), minimal residual disease (elevated Ctn but no structurally identifiable disease), metastasis (structurally identifiable disease), and death (cancer-related death from progressive MTC) (11). The ethics committee of the University of Heidelberg approved the study protocol (approval no. S-003/2015).
Statistical analysis
Continuous data are expressed as the mean ± SD and range and categorical data as the absolute and relative frequencies. Between-group differences were calculated using ANOVA for continuous data, the t test for two-group comparisons of the continuous data, the Kruskal-Wallis test for the follow-up duration, and the χ2 test for the categorical data. The analyses were performed with patients grouped according to the ATA risk categories, tumor stage, and outcomes according to the response to therapy. MTC survival was illustrated using the Kaplan-Meier method. The different tumor stages were compared using a log-rank test. The possible prognostic factors for DSS were analyzed using multivariable Cox regression. P values < 0.05 were considered statistically significant. Because the present study was a retrospective observational study, no adjustments for multiple testing were performed. All statistical analyses were descriptive and were performed using SAS, version 9.4 WIN (SAS Institute).
Results
Patient demographics
Our cohort included 263 patients (113 males and 150 females) with an established MEN2 diagnosis. The 263 patients were classified according to the mutation risk group: MOD (n = 122), H (n = 120), and HST (n = 21; Table 1). The results of respective RET analyses are shown in Table 2. The MOD group included 44 patients with exon 10 codons 611, 618, and 620; 3 patients with exon 11 codon 630 mutations; 74 patients with exon 13-15 codon 768, 790, 791, 804, 891, and 904 mutations; and 1 patient with an exon 8 codon 553 mutation. The H group consisted of 119 patients with 634 mutations and 1 patient with an A883F mutation. The HST group consisted of 21 patients with the M918T mutation (Table 2). The mean age at initial surgery differed substantially among the three risk groups (P < 0.0001; Table 1). The youngest mean age was 14.9 years for the HST group compared with 23 years for the H group and 35.3 years for the MOD group. The mean follow-up time was 12.9 ± 9.8 years (range, 1 to 48 years). The mean observation time was 15.8 years for the H, 13.3 years for the HST, and 10.8 years for the MOD groups and differed substantially. More than one half of patients had a diagnosis of localized disease, with stage 0 (C-cell hyperplasia) and stage I (T1 tumor) disease comprising 51% of MOD and 55% of H patients but only 15% of HST patients. In addition, 35% of MOD patients and 23% of H patients had tumors that had extended beyond the thyroid (stage III and IV) compared with 71% of HST patients. A statistically significant difference was found in the distribution of the tumor stage at diagnosis among the different risk groups (P < 0.0001). The index patients (n = 100) were older (36.1 ± 17.7 years) than the nonindex patients (n = 163; 23.1 ± 16.8 years). Also, their diagnosis was at a more advanced tumor stage in all risk groups (P < 0.0001, χ2 test), and they had worse outcomes (P < 0.0001). Finally, 20 of the 23 patients who had died of MTC had belonged to the group of index patients.
RET Mutations in MOD, H, and HST Groups
| ATA Group | Mutation | Patients, n |
|---|---|---|
| MOD | ||
| G533C | 1 | |
| C611F | 5 | |
| C618R/S/G/F | 5/18/1/1 | |
| C620R/G/F/Y | 7/2/2/3 | |
| C630R | 3 | |
| E768N | 1 | |
| L790F | 17 | |
| Y791F | 8 | |
| V804L/M | 2/28 | |
| S891A | 17 | |
| S904F | 1 | |
| Total | 122 | |
| H | ||
| C634R | 30 | |
| C634G | 23 | |
| C634F | 4 | |
| C634W | 13 | |
| C634Y | 49 | |
| A883F | 1 | |
| Total | 120 | |
| HST | ||
| M918T | 21 | |
| Total | 21 |
To further calculate the onset and progression of MTC, the patients were stratified according to the three risk groups with respect to age at tumor stage I and III. This resulted in a total of six different age groups, two for each risk group (Table 3). The age-related progression of MTC differed substantially across the three risk groups and within the two tumor stages. Stage I tumors presented in the different risk groups (MOD, H, and HST) at a mean age of 31.6, 17.7, and 4.3 years, respectively. Compared with the H group, MTC stage I presented 13.4 years earlier in the HST patients and 13.9 years later in the MOD patients. Within the different risk groups (M, H, and HST), the mean interval to the development from stage I to stage III disease was 10.1, 12.7, and 12.1 years, respectively (Table 3).
Age at Diagnosis of Stage I and Stage III in Three RET Mutation Risk Groups and Interval of Tumor Growth (Stage I to Stage III) Within and Among Risk Groups
| Tumor Stage | MOD | H | HST | P Value | Mean Interval Between Risk Groups, y | |
|---|---|---|---|---|---|---|
| MOD–H | H–HST | |||||
| I | MOD–H, 0.0001 | 13.9 | 13.4 | |||
| Patients, n | 33 | 50 | 2 | |||
| Age, y | 31.6 ± 17.8 | 17.7 ± 13.7 | 4.3 | |||
| III | MOD–H 0.0049; H–HST, 0.0322; MOD–HST, < 0.0001 | |||||
| Patients, n | 38 | 22 | 7 | 11.3 | 14.0 | |
| Age, y | 41.7 ± 15.3 | 30.4 ± 13.0 | 16.4 ± 11.7 | |||
| P value | 0.014 | 0.0005 | ||||
| Mean interval from stage I to III, y | 10.1 | 12.7 | 12.1 | |||
Survival
Cancer-related survival rates were obtained using the Kaplan-Meier method (Fig. 1). DSS at 5, 10, and 20 years was 97.9%, 89.9%, and 89.9% for the MOD patients; 96.5%, 94.3%, and 93.2% for the H patients; and 89.1%, 76.8%, and 54.6% for the HST patients, respectively. The multivariate analysis for DSS found that tumor stage III/IV, increasing age at diagnosis, and HST were substantially associated with an increased risk of death; biological sex was not a statistically significant prognostic factor (Table 4). No difference in DSS was observed between the MOD and H patients. However, DSS among the HST patients was distinctly inferior compared with the DSS for the MOD and H patients.
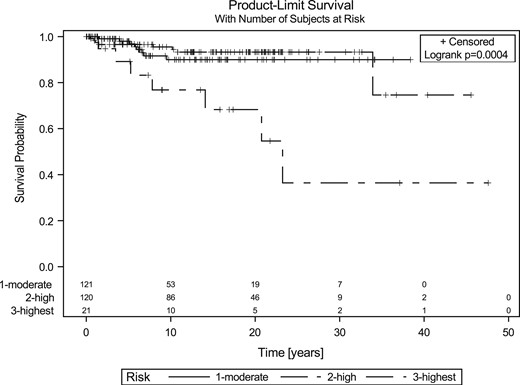
DSS in the three RET mutation risk groups. No statistically significant differences were found between the MOD and H patients; however, the DSS for the HST group was significantly inferior statistically (P = 0.0008).
Multivariate Analysis of DSS and Prognostic Factors for Patients With Hereditary MTC
| Factor | HR | 95% CI | P Value |
|---|---|---|---|
| Sex | 1.520 | 0.641–3.603 | 0.342 |
| Age at diagnosis | 1.058 | 1.024–1.093 | 0.0008 |
| Tumor stage III-IV | 7.389 | 2.394–22.813 | 0.0005 |
| H group | 2.103 | 0.718–6.160 | 0.1752 |
| HST group | 14.412 | 3.316–62.635 | 0.0004 |
| Factor | HR | 95% CI | P Value |
|---|---|---|---|
| Sex | 1.520 | 0.641–3.603 | 0.342 |
| Age at diagnosis | 1.058 | 1.024–1.093 | 0.0008 |
| Tumor stage III-IV | 7.389 | 2.394–22.813 | 0.0005 |
| H group | 2.103 | 0.718–6.160 | 0.1752 |
| HST group | 14.412 | 3.316–62.635 | 0.0004 |
Clinical outcome
The tumor stage at diagnosis substantially affected the clinical outcomes. More than one half of the MOD patients (56%) and H patients (61%) but only 14% of the HST patients were considered cured, with undetectable Ctn levels or levels <10 pg/mL at the end of the study (Table 1; Fig. 2). Only 7% of MOD and H patients had died at the end of the study period compared with 33% of HST patients. No statistically significant difference was found in the outcomes between MOD (n = 122) and H (n = 118; P = 0.8936, χ2 test). However, the HST patients (n = 21) had substantially worse outcomes compared with the MOD and H patients (n = 220; P < 0.0001, χ2 test; Fig. 2). Only 4% of lymph node-positive patients had achieved long-term biochemical cure.
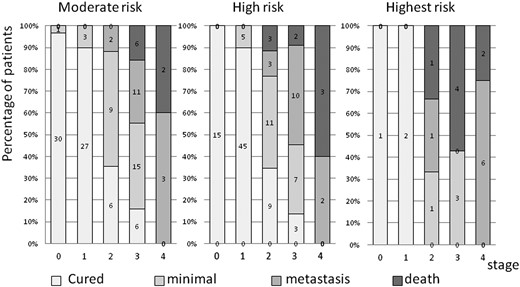
Disease outcome in the three RET mutation risk groups. MOD group, n = 122; H group, n = 118; HST group, n = 21.
Comparison of survival and outcome of patients with diagnosis before and after 1996
The comparison of the patients with a diagnosis and who had been surgically treated before (n = 103) and after 1996 (n = 157) showed a substantial shift to earlier tumor stages at diagnosis in recent years. This led to substantial improvement in the 10-year survival in all risk groups treated after 1996 (Table 5). The difference in survival between the risk groups seen before 1996 disappeared after 1996. No difference was found in stage-dependent survival before or after 1996. Parallel with better survival, the outcomes for all risk groups had improved. The number of cured patients (P = 0.0017), and patients with minimal residual disease (P = 0.0008) had increased in all risk groups, and the number of disease-specific deaths (P = 0.2982) and patients with metastases (P = 0.2360) did not significantly change over time.
Comparison of Patients With MTC Diagnosis and Treated Before and After 1996
| Characteristic | Before 1996 | After 1996 | P Value |
|---|---|---|---|
| Patients, n | 103 | 157 | |
| Stage, n (%) | < 0.0001a | ||
| 0 | 5 (4.9) | 42 (26.8) | |
| I | 26 (25.2) | 56 (35.7) | |
| II | 29 (28.2) | 17 (10.8) | |
| III | 36 (35.0) | 31 (19.8) | |
| IV | 7 (6.8) | 11 (7.0) | |
| 10-y Survival, % | Before 1996, 0.0005b; after 1996, 0.63b | ||
| MOD | 85 | 92 | |
| H | 93 | 96 | |
| HST | 67 | 89 | |
| Outcome | |||
| Cured, n/N (%) | 0.0017a | ||
| MOD | 8/31 (25.8) | 61/91 (67.8) | |
| H | 27/62 (42.6) | 45/56 (80.3) | |
| HST | 1/10 (10) | 2/11 (18.1) | |
| Death, n/N (%) | 0.298a | ||
| MOD | 4/31 (12.9) | 4/91(4.4) | |
| H | 6/62 (9.7) | 2/56 (3.6) | |
| HST | 6/10 (60) | 1/11 (9.1) |
χ2 Test.
Log-rank test.
Discussion
Comparing H and MOD groups in MEN2
Our data support the well-known observation that patients with MEN2 who carry a RET mutation within the HST group will develop MTC earliest, followed by patients who carry a mutation in the H group, and then those with mutations in the MOD group (12, 13). The patients with MEN2 in the different risk groups had a clearly different age of MTC onset (14.9, 23, and 35.3 years, respectively) with an interval of 8.1 to 12.3 years among the HST, H, and MOD groups (Table 1). Substantial differences in age at the appearance of T1 tumors (stage I; mean age, 4.3, 17.7, and 31.6 years in the HST, H, and MOD groups, respectively) and at the appearance of tumor in the cervical lymph nodes (stage III; mean age, 16.4, 30.4, and 41.7 years, respectively) were also observed among the three risk groups (Table 3). This age-related penetrance of MTC among the different RET mutations is well established and the basis for the age-related recommendation for the timing of prophylactic thyroidectomy (2). The classification into three risk categories (HST, H, and MOD) implies that the different risk groups will also exhibit different levels of MTC aggressiveness. With the development of MTC at an early age, a more aggressive course of MTC can be assumed. This gradation suggests that MTC development is age related and that progression will be more pronounced in the H and HST groups. However, this assumption must be changed owing to the comparable survival and outcomes observed in the H and MOD groups in the present study. These findings were first described in an earlier study by Voss et al. (8) in 2016. Their study specified that patients with H and MOD RET mutations had similar tumor stages at diagnosis, similar progression from stage I to stage III, a similar interval to the development of distant metastatic disease after the MTC diagnosis, and similar overall survival (and, therefore, a similar aggressive clinical course). Although individuals possessing H mutations presented with MTC earlier than did those with MOD mutations by nearly 13 years, once MTC had developed, the clinical course was statistically equivalent between the two groups in terms of the time to the development of lymph node-positive or distant metastatic disease and survival.
The natural course or growth rate of MTC cannot be measured directly. Tumor growth can be approximated by comparing the tumor diameter at different tumor stages at the surgical pathological level. With this procedure, the annual primary tumor growth rates for the different stages of MTC in the different risk groups were calculated by Machens et al. (14) in 2014. The primary tumor growth rates were not substantially different between the MOD and H patients. Moreover, the rate of lymph node development was 0.6 to 0.7 lymph node annually, independently of the ATA risk group. These results did not support the assumption that MTC aggressiveness depended on the mutation risk group. In an additional study of hereditary MTC grouped by RET mutational risk reported by Machens et al. (15) in 2018, the progression of MTC within the histopathological groups (normal/C-cell hyperplasia, lymph node-negative, and lymph node-positive MTC) was substantially age related. However, the change in status from lymph node-negative to lymph node-positive MTC occurred at similar intervals in all risk groups (8 to 12 years) (15). This finding was confirmed by our data: tumor growth between stage I (lymph node negative) and stage III (lymph node positive) had similar intervals of 12 years in the MOD and H groups (Table 3). These data imply that although they had an advanced age at onset, MOD patients can have equally aggressive tumors compared with H patients, although occurring later in life. Nevertheless, among the HST patients, we found a trend toward accelerated tumor progression compared with MOD and H patients. However, the number of patients in our study was too low for statistical analysis of this point.
Together with the findings from Voss et al. (8), these results support the hypothesis that MEN2A mutations in ATA MOD and H groups will determine the age of onset of MTC but that MTC is an equally aggressive tumor in the two groups after its initial onset.
Survival and outcome in MEN2B
We found that MTC will manifest 13.4 years earlier in the HST group than in the H group and is associated with the youngest age of onset. The tumor stage at diagnosis and survival in the HST group were inferior to those in the H and MOD groups. The presentation at diagnosis of the HST group was more comparable to that of sporadic MTC. Also, the HST group had worse outcomes than did the MOD and H groups, with a lower cure rate and a higher death rate. These results suggest that patients with MEN2B must be classified further in the HST group concerning the age at onset, tumor aggressiveness, and outcomes. Compared with MEN2A, there has been widespread failure to achieve early clinical recognition of MEN2B. In part, this failure has resulted from the lack of a family history component (mostly de novo mutations), the rarity of the disease, and the age-dependent development of the typical clinical phenotype later in childhood (6).
Characteristics, survival, and outcome of whole MEN2 cohort
Our cohort is comparable to other large MEN2 cohorts regarding the female/male ratio (12, 13, 16, 17), age at diagnosis (12, 13, 16, 17), and genotype and distribution of risk groups (17, 18). Concerning the TNM stage, our cohort seemed to differ from others (12), with a greater proportion of patients with C-cell hyperplasia and stage I disease, presumably owing to the high proportion of screening patients.
The survival of patients with MEN2 has improved within the past 20 years (19). In our MOD group, the 10- and 20-year survival rates were 90% and 90%, respectively. The 10- and 20-year survival rates were 94% and 93%, respectively, in the H group, and distinctly inferior (77% and 55%, respectively) in the HST group. This positive trend was confirmed in all risk groups by comparing the patients who had undergone surgery before and after 1996 (Table 5). This improvement was attributed to the earlier diagnosis and surgery, with a shift toward more favorable tumor stages affecting survival and outcome. This considerable progress made in the last decades was achieved by the use of molecular and biochemical screening and the increasing use of comprehensive operative techniques.
Appropriately, the diagnosis for nearly 50% of H and MOD patients will be at early stages (C-cell hyperplasia or stage I) and these patients will be cured compared with only 14% of HST patients. Among the cured patients, 119 had Ctn levels <0.5 pg/mL and 19 had Ctn levels of <0.5 to 10 pg/mL. Only 3 patients (2%), who had been initially classified as cured, developed pathological basal Ctn levels during the follow-up period. This was much lower than previously reported: 5% to 21% (11, 20–28) of patients with MTC postoperatively had achieved an initial biochemical cure but later developed biochemical recurrence. This might have resulted from differences in sensitivity and specificity and that the different Ctn assays used formerly were not directly comparable. Also, it could not be ruled out that a small proportion in our cohort with long-term biochemical cure might develop biochemical recurrence eventually.
The results from the present study showed that patients with stage I and II MTC without regional lymph node metastases will have 100% survival. This could likely be explained by the high rate of biochemical cure in this subgroup. Also, six patients in our cohort with lymph node-positive MTC achieved long-term biochemical cure. In these patients, the number of metastatic lymph nodes did not exceed four. Corresponding trends have been demonstrated in institutional series (29–32).
In contrast, 9% of all patients died: 7% of MOD patients and 7% of H patients but 33% of HST patients (mostly with stage III and IV). The DSS of the patients with MTC is strongly dependent on their tumor stage and age at diagnosis. This has been well recognized for decades (16, 18, 25, 33–35) and was confirmed in the present study. However, the significance of biological sex as an independent prognostic factor remains controversial (18, 25, 33–35). In the present study, sex was not a predictor of adverse outcomes (P = 0.3669). Concerning the tumor stage, comparisons with other studies would be complicated because of the application of different staging systems and, thus, hindering reasonable conclusions (17, 36–38).
Study limitations
The retrospective nature of the present study carried the limitations that reflect the heterogeneity in patient management during the previous four decades. The operation techniques have changed, the quality of data has changed, data were missing, and no systematic follow-up evaluations had been performed for all the patients. For optimal assessment of DSS among the MTC subgroups, all risk groups should be preferably followed up until all the patients had died in one of the cohorts. However, owing to the slow growth of these tumors with a 20-year survival rate of 80% to 90%, such follow-up evaluations could potentially span more than 50 years. The median follow-up time in the present study was 12.9 years (9 to 16 years for the different risk groups), longer than any comparable reported study. The sample size especially for the rare HST group was much lower than that for the H and MOD groups. A larger sample size and/or longer follow-up might have provided more events and, thus, greater statistical strength. Nevertheless, substantial differences could be shown.
Conclusion
We found that patients with MEN2A carrying mutations classified as MOD and H will have a different onset of disease but similar tumor aggressiveness, survival, and outcomes. Once MTC has developed, the clinical course will be equivalent in these two risk groups, with the same aggressiveness. This has important implications: patients in the MOD group should be followed up as intensively as patients in the H group to enable an early diagnosis and enable cure through early thyroidectomy. Patients with MEN2B, classified as HST, will have the earliest onset of MTC and inferior survival and outcomes compared with patients with MEN2A. Thus, MEN2B is a distinct clinical entity with its own phenotype and a different prognosis.
Acknowledgments
Disclosure Summary: The authors have nothing to disclose.
Data Availability:
All data generated or analyzed during this study are included in this published article or in the data repositories listed in the References.
Abbreviations:
- ATA
American Thyroid Association
- Ctn
calcitonin
- DSS
disease-specific survival
- H
high risk
- HR
hazard ratio
- HST
highest risk
- MEN2
multiple endocrine neoplasia type 2
- MOD
moderate risk
- MTC
medullary thyroid carcinoma
