


Abstract
Polycystic ovary syndrome (PCOS) is closely linked to hyperandrogenism (HA). In PCOS, HA has been associated with metabolic disturbances that increase the risk for cardiovascular disease (CVD).
To assess the association of high serum androgen levels, as a postmenopausal remnant of PCOS, with the prevalence of atherosclerosis and incidence of CVD in postmenopausal women.
The Rotterdam Study, a prospective population-based cohort study. Median follow-up was 11.36 years.
General community.
A total of 2578 women aged >55 years. Exclusion criteria were missing informed consent or follow-up data, perimenopausal status, and menopause by surgical intervention or at an unnatural age (age <40 or >62).
None.
Linear, logistic, and Cox regression models assessed the association of top quartiles (P75) of serum testosterone, free androgen index (FAI), dehydroepiandrosterone, and androstenedione and sex hormone–binding globulin with coronary artery calcium, carotid intima-media thickness (IMT), pulse wave velocity, peripheral artery disease, and incidence of coronary heart disease (CHD), stroke, and CVD.
Mean age (standard deviation) was 70.19 (8.71) years, and average time since menopause was 19.85 (9.94) years. Highest quartile FAI was associated with higher pulse wave velocity (β [95% confidence interval (CI)], 0.009 [0.000 to 0.018]). Highest quartile dehydroepiandrosterone [β (95% CI), −0.008 (−0.015 to −0.001)] and androstenedione [β (95% CI), −0.010 (−0.017 to −0.003)] levels were associated with a lower IMT. We found no association between high androgen levels and incident stroke, CHD, or CVD.
Postmenopausal high androgen levels were not associated with an elevated risk for CVD. Cardiovascular health in women with PCOS might be better than was anticipated.
Androgens in women are present throughout life and produced by the adrenal glands as well as by the ovaries. After menarche (i.e., during early puberty and adolescence), testosterone levels generally rise and reach peak values around the age of 20 (1). After adolescence, serum androgen concentrations gradually decline. Although after menopause the ovarian contribution is minimalized, detectable androgen concentrations will still be present (2).
The most common cause of elevated androgen levels, hyperandrogenism (HA), in women of reproductive age is polycystic ovary syndrome (PCOS). Depending on the population under study and diagnostic criteria used, PCOS is as prevalent as 10% to 15% (3, 4). HA in PCOS is defined as the presence of hirsutism or an increase in serum testosterone or the free androgen index (FAI) (5). In addition, androgen precursors such as dehydroepiandrosterone (DHEA) and androstenedione (Adione) are often elevated among women with PCOS (6, 7).
An increased prevalence of metabolic abnormalities has been observed in women with PCOS, especially in those exhibiting HA (8, 9). In addition, signs of early atherosclerotic disease have been observed in women with PCOS (10, 11). Presumably, this unfavorable cardiometabolic profile persists into the postmenopausal period, suggesting a higher risk for cardiovascular disease (CVD) morbidity and mortality later in life (12–14). Nevertheless, because of the scarcity of large-scale studies with sufficient follow-up time, results regarding long-term CVD incidence among women with PCOS are inconclusive (15, 16).
Free testosterone, Adione, and the FAI have been suggested as the best markers to predict the presence of PCOS at all ages, especially after the onset of menopause (7). In the absence of large-scale PCOS patient cohorts with long-term follow-up, we aimed to assess the association of the possible postmenopausal remnant of PCOS (e.g., elevated androgen levels), with both prevalent atherosclerosis and incident CVD in a large prospective population-based cohort study of postmenopausal women. Additionally, we defined a PCOS phenotype consisting of testosterone or FAI levels in the top quartile together with reported cycle irregularities at 25 years of age. Prevalence of atherosclerosis and incident CVD events were further examined among women fulfilling the PCOS phenotype criteria.
Materials and Methods
Study setting
This study was embedded in the Rotterdam Study (RS), a prospective population-based cohort study among subjects ≥55 years in the municipality of Rotterdam, the Netherlands. The rationale and design of the RS have been described in detail elsewhere (17). The baseline examination was completed between 1990 and 1993 (RS-I). In 2000, the cohort was extended to include inhabitants who had reached 55 years of age or moved into the study district after the start of the original cohort (RS-II). Participants were all interviewed at home and then underwent an extensive set of physical examinations at the research center every 3 to 5 years. The current study used data from the third examination of the original cohort (RS-I-3, 1997 to 1999) and the first examination of the extended cohort (RS-II-1, 2000 to 2001). There were no eligibility criteria to enter the RS cohorts except the minimum age and residential area based on ZIP codes. For this study, we excluded women who were not postmenopausal and those who had entered menopause at an unnatural age (<40 or >62) or by a surgical intervention. RS has been approved by the medical ethics committee according to the Population Screening Act: Rotterdam Study, executed by the Ministry of Health, Welfare and Sports of the Netherlands. All participants in the present analysis provided written informed consent to participate and to obtain information from their treating physicians (17).
Sex steroid measurements
Blood for sex steroid assessment was drawn during the postmenopausal period and at the first visit to the study center. Serum levels of testosterone, DHEA, and Adione were measured in the fasting blood samples with liquid chromatography–tandem mass spectrometry. The FAI was calculated as [Testosterone (nmol/L) * 100/sex hormone–binding globulin (SHBG) (nmol/L)]. Estradiol levels were measured with a radioimmunoassay. Estradiol levels <18.35 pmol/L were under the detection limit of the immunoassay used.
SHBG, insulin, and lipid measurements
SHBG and insulin levels were determined with the Immulite platform (Diagnostic Products Corporation, Breda, the Netherlands). Total and high-density lipoprotein (HDL) cholesterol, triglyceride, and fasting glucose were measured on the COBAS 8000 Modular Analyzer (Roche Diagnostics, Almere, the Netherlands).
Other measurements
Type 2 diabetes mellitus (DM) was diagnosed on the basis of a fasting plasma glucose level of ≥7.0 mmol/L (≥126.1 mg/dL) or use of antidiabetic medication. Body mass index (BMI, in kg/m2) was calculated. Waist circumference was measured in standing position, without heavy outer garments, midway between the lower rib and iliac crest. Blood pressure was measured twice at the right brachial artery in sitting position with a random-zero sphygmomanometer, and the average of the two measurements was used for the analysis. Information on reproductive history (including menstrual cycle irregularities at 25 years of age), medication, education, and smoking was obtained during the home interview by a computerized questionnaire.
Outcome assessments
Subclinical measures of atherosclerosis
Coronary artery calcium (CAC) was measured in the epicardial coronary arteries with either a C-150 electron beam computed tomography scanner (Imatron, South San Francisco, CA) or a 16- or 64-slice multidetector computed tomography scanner (Somatom Sensation 16 or 64; Siemens, Forchheim, Germany) and quantified with the Agatston method (18). The ATL UltraMark IV (Advanced Technology Laboratories, Bothell, WA) was used for carotid intima-media thickness (IMT) measurements. Ultrasonography of the left and right carotid arteries was performed, and the mean of the maximal measurements from the near and far walls on both the left and right sides was used for the analysis (18). Pulse wave velocity (PWV) was measured with an automatic device (Complior; Artech Medical, Pantin, France) that measures the time delay between the rapid upstroke of simultaneously recorded pulse waves in the carotid and the femoral arteries in meters per second (18). Peripheral arterial disease (PAD) was defined as ankle brachial index values of ≤0.9.
Incident CVD
The clinical events included incident stroke, coronary heart disease (CHD), and a composite CVD outcome (the occurrence of either CHD or stroke). Follow-up data were collected through general practitioners in the study area and subsequent collection of information from letters by medical specialists and discharge reports in case of hospitalization. Follow-up was done until January 2012. Incident CHD was defined as fatal or nonfatal myocardial infarction or death from CHD, as described previously (19). Strokes were diagnosed when a patient had typical neurologic symptoms and a computed tomography or magnetic resonance imaging, made within 4 weeks after the occurrence of stroke, confirmed the diagnosis (20).
Statistical analysis
Analyses were performed with IBM SPSS Statistics version 21 (IBM Corp., Armonk, NY). A two-sided P <0.05 denoted statistical significance. We used single imputation by the Expectation Maximization method in SPSS to impute the missing values for the covariables. Participant characteristics were described as mean [standard deviation (SD)] for continuous variables and proportions for dichotomous variables. Hormone levels were categorized into quartiles. Androgen levels in the highest quartile were considered indicative of HA. Hormone levels in the middle of the range, P25 to P50, were used as the reference category. The relation between hormones and prevalent atherosclerosis was examined cross-sectionally, with linear regression used for the association with CAC, IMT, and PWV and logistic regression for the association with PAD. IMT and PWV were log transformed to obtain a normal distribution. CAC was analyzed as natural logarithm of (CAC + 1). Results were expressed in regression coefficient (β) or odds ratio (OR) and their corresponding 95% confidence intervals (CIs).The association between hormone levels and incident cardiovascular events (CHD, stroke, and composite CVD) was examined with the Cox proportional hazard models. Results were expressed as hazard ratios (HRs) and their corresponding 95% CIs.
Adjustments were made to eliminate the effect of possible confounders. The first model was adjusted for age, years since menopause, and cohort. The second model was further adjusted for total and HDL cholesterol, lipid-lowering medication, smoking, systolic blood pressure, treatment of hypertension, DM, waist/hip ratio, and the use of hormones.
We further aimed to identify women with (premenopausal) features of PCOS and assess their risk for atherosclerosis and incident CVD. PCOS was defined as either testosterone or FAI levels in the highest quartile together with a reported history of cycle irregularities at age 25. Prevalence of atherosclerosis and incident CVD events among these women were compared with those of women with no history of cycle irregularities and testosterone and FAI in the reference range (P25 to P50). The Kaplan-Meier method was used to generate a cumulative survival plot for CHD, stroke, and the composite CVD outcome, in GraphPad Prism version 5 (GraphPad Software Inc., La Jolla, CA).
We performed different sets of sensitivity analyses. First, we repeated the cross-sectional analyses regarding the association of hormones with atherosclerosis after excluding women who had prevalent CVD at baseline. Second, we assessed the association between extreme hormone levels (>P90) and atherosclerosis and incident CVD. Last, we repeated the cross-sectional and longitudinal analyses after excluding all women who reported using hormones. We further considered a more conservative Bonferroni-adjusted P of 0.001, corresponding to 42 sets of analyses.
Results
In total, 3452 women had data available data on all hormones and were therefore eligible for this study. We excluded women for whom informed consent and follow-up data were not available (N = 36). Furthermore, those who were not postmenopausal (N = 108) or who entered menopause by a surgical intervention (N = 670) or at an unnatural age (age of menopause <40 or >62 years, N = 60) were excluded, leaving 2578 women for our analysis. Mean (SD) age was 70.19 (8.71), and the mean time (SD) since menopause was 19.85 (9.94) years. Cycle irregularities at the age of 25 were reported by 272 (10.6%) women. A total of 316 (12.3%) women had prevalent type 2 DM, and 232 (9.0%) had prevalent CVD at baseline. The baseline characteristics are listed in Supplemental Table 1.
Participants were divided into quartiles based on their serum hormone levels. The reported results are for the hormonal levels in the highest quartiles (P75), with the middle of the range (P25 to P50) as the reference category. Testosterone or FAI levels in the highest quartile were considered indicative of HA. The cutoff for the highest quartile of testosterone serum concentrations (>P75, i.e., >1.19 nmol/L) in our study to define HA was similar to that suggested by others [1.4 nmol/L (41.0 ng/dL) and 1.1 nmol/L (30.9 ng/dL)] (7, 16).
Sex steroids and prevalent atherosclerosis
Results from the linear and logistic regression models for associations of the highest quartile of testosterone, DHEA, Adione, the FAI, and SHBG levels with CAC scores, carotid IMT, PWV, and presence of PAD are presented in Table 1. Carotid IMT, PWV, and PAD data were available in 2339, 2174, and 2295 women, respectively, and CAC measurements were available in a smaller sample set (N = 1483). After adjustment for cardiovascular risk factors, we found no association between high testosterone levels and any of the surrogate markers of atherosclerosis. FAI in the highest quartile was associated with a higher PWV. High Adione and DHEA levels were associated with lower IMT. Finally, SHBG values in the highest quartile were associated with lower PWV. None of the associations were significant at a more conservative Bonferroni-corrected P value of 0.001. We found no association between hormone levels in the highest quartile and CAC or PAD.
Association Between High Levels of Sex Steroids and SHBG With Surrogate Markers of Atherosclerosis
| CAC [β (95% CI)] | IMT [β (95% CI)] | PWV [β (95% CI)] | PAD [OR (95% CI)] | |
|---|---|---|---|---|
| Testosterone | ||||
| Model 1 | −0.140 (−0.469 to 0.189) | −0.006 (−0.014 to 0.001) | 0.001 (−0.009 to 0.010) | 0.95 (0.69 to 1.31) |
| Model 2 | −0.100 (−0.414 to 0.213) | −0.004 (−0.011 to 0.003) | 0.003 (−0.006 to 0.012) | 0.99 (0.72 to 1.38) |
| FAI | ||||
| Model 1 | 0.303 (−0.014 to 0.620) | 0.002 (−0.005 to 0.010) | 0.021 (0.012 to −0.031) | 0.99 (0.72 to 1.35) |
| Model 2 | −0.093 (−0.407 to 0.220) | −0.005 (−0.012 to 0.002) | 0.009 (0.000 to 0.018) | 0.87 (0.62 to 1.21) |
| Adione | ||||
| Model 1 | −0.161 (−0.476 to 0.155) | −0.008 (−0.016 to −0.001) | 0.010 (0.001 to 0.020) | 1.01 (0.73 to 1.38) |
| Model 2 | −0.263 (−0.563 to 0.037) | −0.010 (−0.017 to −0.003) | 0.008 (0.000 to 0.017) | 0.93 (0.67 to 1.29) |
| DHEA | ||||
| Model 1 | −0.149 (−0.463 to 0.165) | −0.011 (−0.018 to −0.003) | −0.002 (−0.011 to 0.008) | 0.70 (0.50 to 0.98) |
| Model 2 | −0.152 (−0.450 to 0.147) | −0.008 (−0.015 to −0.001) | 0.003 (−0.006 to 0.012) | 0.72 (0.51 to 1.01) |
| SHBG | ||||
| Model 1 | −0.252 (−0.580 to 0.076) | −0.007 (−0.015 to 0.001) | −0.022 (−0.032 to -0.012) | 1.06 (0.78 to 1.45) |
| Model 2 | 0.054 (−0.271 to 0.379) | 0.002 (−0.005 to 0.009) | −0.010 (−0.019 to −0.001) | 1.24 (0.89 to 1.72) |
We used linear regression for CAC, IMT, and PWV and logistic regression for PAD. Results are shown as β estimates or ORs and 95% CIs for hormonal levels in the top quartile (P75), with levels between P25 and P50 used as the reference category. Boldface indicates a significant association at P <0·05. Model 1 is adjusted for age, years since menopause, and cohort. Model 2 is adjusted for age, years since menopause, cohort, waist/hip ratio, total and HDL cholesterol, lipid-lowering medication, smoking, systolic blood pressure, treatment of hypertension, DM, and use of hormones. Carotid IMT, PWV, and PAD data were available in 2339, 2174, and 2295 women, respectively. Data on CAC were available for 1483 women.
Sex steroids and incident CVD
In the analysis concerning incident CVD, only women without prevalent CVD at baseline (N = 2346) were included. Compared with women with CVD at baseline, women without prevalent CVD were younger, entered menopause slightly later, and had a lower waist/hip ratio. Moreover, a lower diastolic blood pressure, lower fasting glucose, and lower prevalence of type 2 DM was observed among these women. There were no significant differences in mean serum hormone levels in women with or without prevalent CVD (data not shown).
The median follow-up time was 11.36 years, during which 165 women (7.0%) developed CHD and 215 women (9.2%) experienced a stroke. Overall, 359 (15.3%) developed CVD (stroke or CHD) during follow-up. When we adjusted for cardiovascular risk factors, we found no significant associations between high serum levels of any of the sex steroids and SHBG and the incidence of any of the studied clinical CVD outcomes (Table 2).
Association Between High Levels of Sex Steroids and SHBG With Incident CVD
| CHD [HR (95% CI)] | Stroke [HR (95% CI)] | CVD [HR (95% CI)] | |
|---|---|---|---|
| Testosterone | |||
| Model 1 | 0.81 (0.52 to 1.24) | 1.31 (0.90 to 1.91) | 1.06 (0.79 to 1.43) |
| Model 2 | 0.85 (0.55 to 1.31) | 1.31 (0.80 to 1.91) | 1.10 (0.82 to 1.47) |
| FAI | |||
| Model 1 | 1.04 (0.67 to 1.60) | 0.82 (0.57 to 1.17) | 0.91 (0.68 to 1.22) |
| Model 2 | 0.84 (0.54 to 1.32) | 0.75 (0.52 to 1.10) | 0.80 (0.59 to 1.09) |
| Adione | |||
| Model 1 | 1.10 (0.71 to 1.72) | 1.29 (0.90 to 1.86) | 1.17 (0.87 to 1.57) |
| Model 2 | 1.04 (0.67 to 1.63) | 1.25 (0.87 to 1.79) | 1.13 (0.83 to 1.52) |
| DHEA | |||
| Model 1 | 0.83 (0.51 to 1.35) | 0.89 (0.61 to 1.29) | 0.89 (0.65 to 1.21) |
| Model 2 | 0.87 (0.54 to 1.42) | 0.90 (0.62 to 1.31) | 0.92 (0.67 to 1.26) |
| SHBG | |||
| Model 1 | 1.05 (0.66 to 1.66) | 0.95 (0.66 to 1.36) | 0.97 (0.72 to 1.30) |
| Model 2 | 1.36 (0.84 to 2.18) | 0.98 (0.68 to 1.42) | 1.10 (0.81 to 1.50) |
Results are shown as HRs and 95% CIs for hormonal levels in the top quartile (P75), with levels between P25 and P50 used as the reference category. Model 1 is adjusted for age, years since menopause, and cohort. Model 2 is adjusted for age, years since menopause, cohort, waist/hip ratio, total and HDL cholesterol, lipid-lowering medication, smoking, systolic blood pressure, treatment of hypertension, DM, and use of hormones.
PCOS and the risk for atherosclerosis and CVD
Out of the 272 women with a reported history of cycle irregularities, 106 also had testosterone or FAI levels in the highest quartile and were therefore marked as having PCOS. A control group was composed of 171 women with no history of cycle irregularities and hormone levels in the reference range (P25 to P50). Women with PCOS had a larger waist/hip ratio, had a higher BMI, and more often had type 2 DM (20% vs 7%). In addition, lower HDL and higher triglyceride levels and lower SHBG levels were observed among these women (Table 3). After adjusting for cardiovascular risk factors, we found no association with prevalent atherosclerosis, nor did we observe an increased risk for incident CVD in women marked as having PCOS (Table 4). No difference was observed in event-free survival for CHD, stroke, or the composite CVD outcome between women fulfilling the criteria for PCOS and the control group (Fig. 1).
Baseline Characteristics of Women With PCOS and Controls
| PCOS, N = 106 | Controls, N = 171 | P | |
|---|---|---|---|
| Age, y | 69.57 (8.72) | 69.20 (8.60) | 0.73 |
| Age at menopause, y | 51.00 (3.85) | 50.19 (3.92) | 0.09 |
| Years since menopause, y | 18.56 (9.19) | 19.00 (10.15) | 0.71 |
| Waist/hip ratio | 0.89 (0.08) | 0.86 (0.08) | 0.01 |
| BMI, kg/m2 | 27.92 (4.53) | 26.84 (3.83) | 0.03 |
| Current smoking, n (%) | 17 (16.0%) | 28 (16.4% | 0.94 |
| Systolic blood pressure, mm Hg | 142.30 (21.74) | 143.61 (19.22) | 0.60 |
| Diastolic blood pressure, mm Hg | 74.55 (10.39) | 77.03 (9.92) | 0.05 |
| Hypertension, n (%) | 70 (66.0%) | 107 (62.6%) | 0.56 |
| Cholesterol, nmol/L | 5.98 (0.85) | 6.09 (1.01) | 0.34 |
| HDL cholesterol, mmol/L | 1.40 (0.35) | 1.57 (0.39) | <0.01 |
| Triglyceride, mmol/L | 1.62 (0.86) | 1.39 (0.62) | 0.02 |
| Lipid-lowering medication, n (%) | 8 (7.5%) | 24 (14.0%) | 0.10 |
| Fasting blood glucose, mmol/L | 6.25 (1.83) | 5.79 (1.41) | 0.03 |
| DM | 20 (18.9%) | 12 (7.0%) | <0.01 |
| Prevalent CVD | 7 (6.6%) | 11 (6.4%) | 0.96 |
| Hormones | |||
| SHBG, nmol/L | 43.58 (33.36 to 78.25) | 63.00 (57.70 to 69.70) | <0.01 |
| Estradiol, pmol/L | 38.77 (21.23 -69.41) | 29.44 (18.35 to 58.61) | 0.06 |
| Androstenedione, nmol/L | 2.63 (2.00 to 3.31) | 2.17 (1.67 to 2.88) | 0.01 |
| DHEA, nmol/L | 9.12 (6.13 to 14.14) | 8.68 (6.20 to 12.24) | 0.68 |
| Testosterone, nmol/L | 1.30 (1.04 to 1.71) | 0.74 (0.68 to 0.80) | <0.01 |
| FAI | 2.69 (2.13 to 3.49) | 1.16 (1.05 to 1.29) | <0.01 |
PCOS was defined as testosterone or FAI levels >P75 and a history of cycle irregularities. Controls were defined as FAI and testosterone levels P25 to P50 with no history of cycle irregularities. Values are reported in means and SDs or medians (27th to 75th quartile) for continuous variables or as a number (percentage) for categorical variables. Boldface values indicate that the association is significant at P <0.05.
Association Between PCOS Phenotype and Surrogate Markers of Atherosclerosis and With Incident CVD
| PCOS, N = 106 | ||
|---|---|---|
| Model 1 | Model 2 | |
| Surrogate markers, β or (95% CI) | ||
| IMT | 0.009 (−0.008 to 0.025) | 0.010 (−0.007 to 0.026) |
| PWV | −0.011 (−0.031 to 0.010) | −0.016 (−0.036 to 0.004) |
| PAD | 0.77 (0.37 to 1.60) | 0.66 (0.284 to 1.51) |
| Incident CVD, HR (95% CI) | ||
| CHD | 1.10 (0.46 to 2.66) | 0.73 (0.27 to 1.99) |
| Stroke | 1.14 (0.56 to 2.23) | 1.16 (0.55 to 2.42) |
| CVD | 1.10 (0.61 to 1.97) | 0.94 (0.51 to 1.76) |
Results are shown as β estimates or ORs or HRs and 95% CIs. PCOS was defined as testosterone or FAI levels >P75 and a history of cycle irregularities. Controls were defined as FAI and testosterone levels P25 to P50 and no history of cycle irregularities. Model 1 is adjusted for age, years since menopause, and cohort. Model 2 is adjusted for age, years since menopause, cohort, waist/hip ratio, total and HDL cholesterol, smoking, systolic blood pressure, treatment of hypertension, DM, and use of hormones. (CAC was excluded because of the low number of available measurements for this analysis).
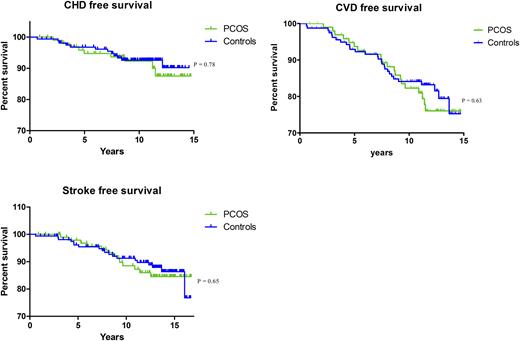
CVD event-free survival in women fulfilling the criteria for the PCOS phenotype and controls; CVD event-free survival during follow-up in women fulfilling the criteria for the PCOS phenotype and controls. PCOS was defined as testosterone or FAI levels >P75 and a history of cycle irregularities. Controls were defined as FAI and T levels between P25 and P50 and no history of cycle irregularities.
Sensitivity analyses
Three sensitivity analyses were performed. First, the cross-sectional analyses regarding the association of sex steroids and SHBG with atherosclerosis were repeated after we excluded all women who had prevalent CVD at baseline. Results regarding the association of hormones with surrogate markers of atherosclerosis remained the same (Supplemental Table 2). Second, we assessed the association between extreme levels of sex steroids and SHBG (>P90) and prevalent atherosclerosis and incident CVD. Results of this set of analyses were in concordance with the analyses regarding the association of hormone levels in the top quartile (>P75) with prevalent atherosclerosis and incident CVD. Extreme FAI levels (>P90) were associated with a higher PWV. Extreme Adione and DHEA levels were associated with a lower IMT. Extreme SHBG values were associated with lower PWV. We found no association between extreme hormone levels and CAC or PAD. In addition, we did not find any association between extreme sex steroid levels and incident CVD (Supplemental Tables 3 and 4). Finally, we repeated the analyses after excluding women who reported using hormones. The results for this set of analyses were not different from those of our main analysis (Supplemental Tables 5 and 6).
Discussion
In this large population-based study of postmenopausal women, we did not find a robust association between high androgen levels and surrogate markers of atherosclerosis or incident CVD. Although women with PCOS exhibited an unfavorable metabolic profile, it did not translate into a larger prevalence of atherosclerosis or an increased risk for incident CVD among these women.
Surrogate markers of atherosclerotic CVD can be prevalent among clinically asymptomatic women, and the menopausal transition marks an upward transition of cardiovascular risk (21). High circulating androgen levels have been associated with an unfavorable cardiovascular risk profile and increased prevalence of subclinical atherosclerosis in postmenopausal women (21, 22). Our findings suggest there might indeed be some association between high androgen levels and surrogate markers for CVD. However, the association between high androgen levels and surrogate markers for atherosclerosis in our study was not robust and consistent. These findings are in line with several previous reports indicating inconsistent relationships between androgen levels and measures of subclinical atherosclerosis among postmenopausal women. Moreover, to what extent these surrogate markers translate into real hard endpoints remains controversial (23).
The few available studies on androgens and CVD did not demonstrate a clear relationship, indicating that atherosclerosis burden among postmenopausal women might be caused largely by adverse cardiovascular risk factors, and HA per se might not be a risk factor for CVD (24, 25). In line with these findings, we also did not find an association between high androgens per se and incident CVD. Even when assessing the extreme levels (serum hormone levels >P90), amply exceeding cutoffs suggested by previous studies (7, 16), we observed no increased risk for CVD.
HA in PCOS has been associated with an unfavorable cardiometabolic profile during the reproductive years. It has been suggested that these women might be especially at risk for CVD morbidity and mortality later in life (26). In comparing women with PCOS to those without PCOS, we were not able to detect any significant associations with CVD endpoints. This result could reflect the small number of women included in the PCOS phenotype analyses. However, to our knowledge this is the largest study to assess CVD in women exhibiting postmenopausal features of PCOS. In addition, the few available studies on CVD in women with PCOS also did not demonstrate an association with CVD (mortality) and point toward the same direction as the current study (15, 16).
The only available long-term follow-up study in women with PCOS showed persistence of CVD surrogate markers into postmenopausal life without an increased incidence of stroke or CVD (15). These results are in line with the current findings. However, women with PCOS in our study were at risk to develop type 2 DM, which has been reported previously as well (12).
One could argue we might have studied a relatively healthy sample. Because the mean duration between menopause and our study entry was 19 years, women experiencing CVD at early age may have already died before being eligible for inclusion in the RS. Therefore, the possible selection bias could have shifted the associations in the current study toward the null. However, androgen levels in women with or without prevalent CVD at baseline were not significantly different. The pathological mechanism behind early CVD might be different and does not seem to be driven by HA per se.
Several previous reports have suggested a greater burden of atherosclerosis among younger and middle-age women with PCOS, especially in those with both cycle irregularities and HA (10, 11, 21, 27). Little is known about the real incidence of atherosclerosis at older ages in women who previously suffered from PCOS. Our findings indicate that PCOS is not associated with more severe atherosclerosis at older age.
Recent studies have implicated a common biological mechanism behind both PCOS susceptibility and a later age at menopause, which ameliorates ovarian aging and thus expands the reproductive lifespan (28). In line with this notion, women with PCOS in our study had entered menopause on average 1 year later than those in the control group, a nonsignificant difference. Reproductive performance seems to be a good marker for a women’s general health later in life, and an extended reproductive lifespan is correlated with long-term health and longevity, probably caused by longer estrogen exposure (29, 30). Therefore, despite the fact that PCOS is associated with risk factors for CVD such as higher BMI and insulin levels, which are strongly correlated with HA and the known unfavorable cardiometabolic profile, evidence now seems to indicate that long-term health in these women might be better than was previously anticipated.
Conclusions and implications
In conclusion, persistent high androgen levels in women after menopause were associated with an increase in surrogate markers of CVD but did not show a robust association with CVD. Long-term health in these women might therefore be better than previously thought. Long-term follow-up in a large group of women diagnosed with PCOS during their premenopausal years is necessary to confirm these findings and to evaluate the necessity for cardiovascular screening.
Abbreviations:
- BMI
body mass index
- CAC
coronary artery calcium
- CHD
coronary heart disease
- CI
confidence interval
- CVD
cardiovascular disease
- DHEA
dehydroepiandrosterone
- DM
diabetes mellitus
- FAI
free androgen index
- HA
hyperandrogenism
- HDL
high-density lipoprotein
- HR
hazard ratio
- IMT
intima-media thickness
- OR
odds ratio
- PAD
peripheral arterial disease
- PCOS
polycystic ovary syndrome
- PWV
pulse wave velocity
- RS
Rotterdam Study
- SD
standard deviation
- SHBG
sex hormone–binding globulin
Acknowledgments
Financial Support: The Rotterdam Study is funded by Erasmus MC and Erasmus University, Rotterdam, the Netherlands; the Netherlands Organisation for Scientific Research; the Netherlands Organisation for Health Research and Development; the Research Institute for Diseases in the Elderly; the Ministry of Education, Culture and Science; the Ministry for Health, Welfare and Sports; the European Commission, DG XII; and the Municipality of Rotterdam. This study is supported in part by the Dutch Heart Foundation, grant number 2013T083.
Disclosure Summary: J.S.E.L. has received unrestricted research grants from the following companies (in alphabetical order): Dutch Heart Foundation, Ferring. He also received consultancy fees from Danone, Metagenics Inc., Titus Healthcare, Roche, and Euroscreen. L.J. and T.M. report receiving research support from Metagenics Inc. K.D. is supported by Erasmus Mundus Western Balkans, a project funded by the European Commission. O.H.F. reports receiving grants or research support from Metagenics Inc. and Nestle. M.K. is supported by the NWO VENI grant (VENI 91616079). In the most recent 5-year period B.C.J.M.F. has received fees and grant support from the following entities (in alphabetical order): Actavis/Watson/Uteron, COGI, Dutch Heart Foundation, Dutch Medical Research Counsel, Euroscreen, Ferring, Merck Serono, OvaScience, Pantharei Bioscience, PregLem/Gedeon Richter/Finox, Roche, Teva, and World Health Organisation. The remaining authors have nothing to disclose.
References
Author notes
These authors contributed equally to this work.
