


Abstract
Metformin is used in pregnancy in women with gestational diabetes mellitus, polycystic ovary syndrome (PCOS), and obesity. Metformin passes the placenta.
To explore the effects of metformin use in PCOS pregnancies on offspring growth to 4 years of age.
Follow-up study of two randomized, double-blind, placebo-controlled trials.
Secondary care centers. Eleven public hospitals in Norway.
One hundred eighty-two children of mothers with PCOS who participated in two randomized controlled trials.
Metformin 1700 or 2000 mg/d or placebo from first trimester to delivery in the original studies. No intervention in the current study.
Height, weight, body mass index (BMI), and overweight/obesity at 4 years of age and head circumference at 1 year of age, converted to z scores.
The difference in height z score means between the groups at 4 years of age was nonsignificant (0.07 [95% confidence interval (CI): –0.22 to 0.36]; P = 0.651). At 4 years of age, the metformin group had higher weight z score than the placebo group [difference in means: 0.38 (0.07 to 0.69); P = 0.017] and higher BMI z score [difference in means: 0.45 (0.11 to 0.78); P = 0.010]. There were more overweight/obese children in the metformin group [26 (32%)] than in the placebo group [14 (18%)] at 4 years of age [odds ratio: 2.17 (1.04 to 4.61); P = 0.038]. The difference in mean head circumference z score at 1 year of age was 0.27 (–0.04 to 0.58; P = 0.093).
Metformin-exposed children had higher BMI and increased prevalence of overweight/obesity at 4 years of age.
Polycystic ovary syndrome (PCOS) affects 5% to 13% of women in fertile age (1). Insulin resistance and hyperandrogenism are central in the complex etiology, with metabolic and reproductive implications (2). Women with PCOS have higher risk of adverse pregnancy outcomes and are likely to provide an altered intrauterine environment (3–5). A recent Australian retrospective cohort study indicated an increased prevalence of malformations, metabolic syndrome, obesity, and hospitalization later in life among these women’s offspring (6). However, evidence regarding offspring anthropometrics at birth and during childhood, indicative of the children’s metabolic status and future health (7, 8), is scarce (4). Associations have been reported between PCOS and both large-for-gestational-age and small-for-gestational-age born offspring (3, 6, 9). Being born large for gestational age increases the risk of adult malignancy and obesity, whereas small for gestational age is related to later central adiposity and to cardiovascular mortality, in particular when followed by accelerated growth during childhood (7, 8, 10).
Metformin is increasingly prescribed to pregnant women with PCOS, gestational diabetes mellitus, type II diabetes mellitus, and recently obesity and has been suggested to decrease the risk of PCOS-associated pregnancy complications (11–13). Its primary site of action is the hepatocytes, where it lowers the energy output of the mitochondria, resulting in a compensatory reduction of the energy consumption of the cell, particularly by reduced gluconeogenesis (14). Metformin passes the placenta and is present in therapeutic concentrations in umbilical cord blood (15). Teratogenicity has not been reported (16). However, the long-term health effects of intrauterine metformin exposure remain unsettled due to limitations in study design (17–21) and have mainly been studied in children born to women with gestational diabetes mellitus. These studies compared metformin (given alone or in combination with insulin when needed) to insulin treatment and were not placebo controlled (13, 22). Results from one of the studies suggested a redistribution of fat from visceral to subcutaneous deposits in children at 2 years of age (21). The authors suggested that this may indicate a protective effect of metformin exposure on the offspring’s metabolic health (21). The other study reported that children exposed to metformin were taller and heavier at 18 months of age (18).
Only a few studies have described the impact of intrauterine metformin exposure on the future health of offspring of women with PCOS. A nonrandomized study revealed no deviation in growth until 18 months of age of metformin-exposed children compared with sex-specific normative data for US infants (17). Previously, we reported on follow-up data of 25 children from our pilot study, revealing no difference in growth or body composition between metformin- and placebo-exposed children at the age of 8 (19). We have also reported on 197 children from the PregMet study, a placebo-controlled randomized controlled trial (RCT) with high compliance, comparing metformin to placebo treatment throughout pregnancy. In this questionnaire-based follow-up at 1 year of age, children exposed to metformin during fetal life were heavier than children in the placebo group (20). Information on body mass index (BMI) was not available. The aim of the current study was therefore to investigate the potential effects of intrauterine metformin exposure on anthropometrics from birth to 4 years of age, hypothesizing less overweight and obesity in metformin-exposed offspring. In addition, we aimed to explore the anthropometric development of children (placebo exposed) born to women with PCOS compared with a standard population.
Material and Methods
Study design
The current study is a follow-up of two randomized, controlled, double-blinded studies. Eligible to participate in the follow-up study were children of mothers who participated in “The Metformin Treatment of Pregnant Women with Polycystic Ovary Syndrome study” (the pilot study) from 2000 to 2003 or “The Metformin in Pregnant PCOS Women study” (the PregMet study) from 2005 to 2009 (23, 24). In both studies, pregnant women with PCOS were randomized to either metformin or placebo to assess the potential of metformin to reduce pregnancy complications (23, 24).
The Committee for Medical Research Ethics of Health Region IV, Norway, approved both the pilot study (project number 51-2000), the PregMet study (project number 145.04), and the present follow-up study (project number 2014/96). Written informed consent was obtained from all women before inclusion in the pilot and the PregMet studies, and additional written consent was obtained from the children’s parents or caretakers before inclusion to the present follow-up study. The Declaration of Helsinki was followed throughout the studies.
The pilot study
Forty women with PCOS were included at St Olav’s Hospital in Trondheim, Norway. All women met the Rotterdam 2003 criteria for PCOS in a retrospect analysis (23, 25). Inclusion criteria for the pilot study were: (1) PCOS diagnosed prior to the index pregnancy; (2) age 18 to 40 years; (3) gestational age between 5 and 12 weeks; and (4) a singleton viable fetus. The participants were randomized to metformin 1700 mg daily or placebo (23).
The PregMet study
In all, 257 pregnant women with PCOS participated with 274 pregnancies, included from 11 study centers in Norway. Inclusion criteria for the PregMet study were: (1) PCOS diagnosed according to the Rotterdam criteria; (2) age 18 to 45 years; (3) gestational age between 5 and 12 weeks; and (4) a singleton viable fetus (24, 25). The participants were randomized to either 2000 mg metformin daily or placebo (24).
All participants in both studies received counseling on lifestyle and diet at inclusion. To counteract possible metformin effects on folate or vitamin B levels, the participants were advised to take 0.8 mg folate and one multivitamin tablet daily throughout pregnancy. An intake of more than 85% of the prescribed tablets was self-reported by 80% of the participants, which were thus considered to have good/acceptable compliance. Randomization, blinding, participant flow, and measurements performed in the pilot and the PregMet studies are described in detail elsewhere (23, 24).
The present follow-up study
Of the 314 pregnancies included in the pilot and the PregMet studies, 4 patients miscarried, 14 dropped out, 1 was excluded due to misdiagnosis, and 3 offspring died (Fig. 1). In all, 292 children from the pilot and the PregMet studies were invited by mail to participate in the current follow-up study. Two reminders were sent to nonresponders. Inclusion criteria were: (1) born to a mother who participated in the pilot study or the PregMet study and (2) the parent(s) agreed on participation in the present follow-up study.
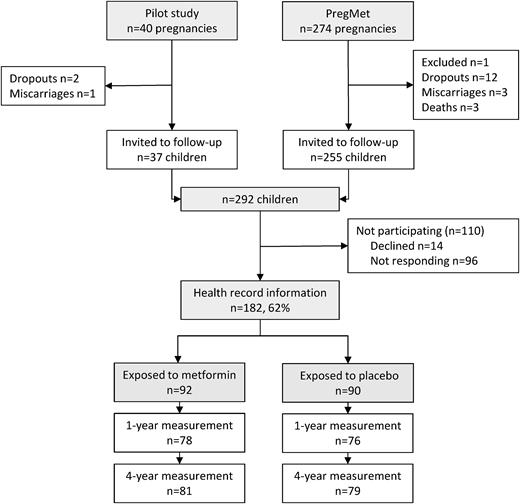
Flowchart on randomization, dropouts, and exclusions.
At inclusion, the offspring’s parent/caregiver either brought a copy of the child’s health record or gave their written consent to retrieval of the health record at the child health care clinics by study personnel. In Norway, length/height, weight, and head circumference are routinely measured at consultations free of charge at public child health care clinics. There are seven scheduled visits during the first year of life and later at 1.5, 2, and 4 years of age. All the measurements are recorded in the child’s health record.
Data management
Primary endpoints were height, weight, BMI, and overweight/obesity at 4 years of age and head circumference at 1 year of age. Secondary outcomes were the mean effect of metformin on anthropometric measurements from 6 months of age up to the last measurement (4 years of age for height, weight, and BMI; 1 year of age for head circumference) and birth anthropometrics (length, weight, BMI, and head circumference).
The anthropometric measurements at six time points were applied in the analyses; birth, 6 months, 1 year, 1.5 years, 2 years, and 4 years. As the exact age at the time of measurement varied, sex- and age-adjusted standard deviation scores (z scores) for length/height, weight, BMI, and head circumference were computed from Norwegian growth references (26). These are built on anthropometric measurements of live-born children between 37 and 42 weeks of gestation, without congenital anomalies or diseases that could affect growth and whose parents were from Norway or northern Europe (26).
Overweight and obesity were defined and calculated according to the extended international (International Obesity Task Force) BMI cut-offs (27).
The impact on offspring growth of being born to a mother with PCOS was examined by assessing the deviation in z scores (height, weight, BMI, head circumference) between the placebo group and the reference population (z score zero). A 95% confidence interval (CI) containing zero was considered a nonsignificant deviation between the placebo group and the reference population.
Data entry, management, and analyses were performed at the Department of Laboratory Medicine, Children’s and Women’s Health at the Norwegian University of Science and Technology.
Statistical analysis
Data were analyzed according to the intention-to-treat principle. For nonrepeated measurements, the groups were compared with a Chi-Square test for categorical variables and a two-tailed, independent samples t test for continuous variables. IBM SPSS Statistics version 22.0 (IBM, SPSS Inc. USA, Chicago, IL) was used for this purpose.
The effect of metformin on the repeated anthropometric measurements over time was assessed by mixed linear models in R version 2.13.1 (R Development Core Team, Vienna, Austria). There was significant covariance heterogeneity between repeated measurements in all variables. In particular, the correlations between measurements at birth and later ages were significantly lower than correlations between measurements performed between 6 months and 4 years of age. Consequently, the covariance structure for the error term was specified as unstructured. The effect of metformin at 4 years of age and the average effect of metformin between 6 months and 4 years of age were examined using the Wald test. Potential metformin effect modification on anthropometric z scores at 4 years of age was examined for maternal prepregnancy BMI and offspring sex separately using the Wald test. P < 0.05 was considered statistically significant. The effect of metformin on overweight/obesity at 4 years of age was assessed with a mixed logistic model with offspring ID as a random effect. To examine the potential effects of metformin at 4 years of age and number needed to harm for an additional case of overweight/obesity, the Wald test was used. Subgroup analyses according to sex were performed on primary endpoints. Results are presented as difference in means between the metformin and placebo groups (denoted as “d”) for length/height, weight, and BMI at birth and at 4 years of age and for head circumference at birth and at 1 year of age. For the measurements between 6 months of age and the primary endpoints, this was the average difference taking into account repeated measurement structure of the data.
Results
Children were enrolled between April 2014 and July 2016. Of the 292 invited children/parents, 170 mothers with 182 children (12 women participated twice in the PregMet study) consented to participate by providing, or giving their written consent to retrieval of, information on the children’s growth from their health records at child health care clinics (62% participation rate) (Fig. 1). Data from all the 182 children were included in the mixed linear models analysis. However, information on the main outcomes (weight, height, and BMI at 4 years of age) was missing for 21 of the included children, and head circumference at 1 year of age was missing for 28 of the included children. Hence, of the invited children, data were available from 161 children at 4 years of age and 154 children at 1 year of age.
There was no difference between baseline characteristics (age, height, systolic and diastolic blood pressure, and parity) of women whose children participated and women with children who did not, except for a higher prevalence of smoking among mothers of nonparticipants (14.5% vs 5.3%, P = 0.008; data not shown).
The metformin effect
The metformin and the placebo groups were comparable regarding maternal baseline characteristics at inclusion, mode of conception, pregnancy complications, maternal weight gain in pregnancy, placenta weight, and duration of breast feeding (Table 1).
Characteristics of the Mothers (n = 170) at Inclusion and the Modes of Conception, Pregnancy Complications, and Placenta Weight in the Pregnancies (n = 182a)
| n | Metforminb | n | Placebob | |
|---|---|---|---|---|
| At baseline | ||||
| Age, y | 87 | 29.5 ± 3.7 | 83 | 29.7 ± 4.2 |
| Height, cm | 87 | 167.1 ± 5.3 | 83 | 167.6 ± 5.1 |
| Weight, kg | 87 | 81.3 ± 20.3 | 83 | 79.6 ± 18.4 |
| BMI, kg/m2 | 87 | 29.1 ± 7.0 | 83 | 28.4 ± 6.5 |
| Systolic blood pressure, mm Hg | 87 | 118 ± 13 | 83 | 117 ± 12 |
| Diastolic blood pressure, mm Hg | 87 | 73 ± 10 | 83 | 72 ± 10 |
| Pulse, bpm | 76 | 74 ± 10 | 72 | 74 ± 9 |
| OGTT (75 g) | ||||
| Fasting plasma glucose, mmol/L | 78 | 4.5 ± 0.5 | 76 | 4.7 ± 0.6 |
| 2-h plasma glucose, mmol/L | 78 | 5.4 ± 1.5 | 75 | 5.4 ± 1.6 |
| Smoking, % | 87 | 3 (3.4) | 83 | 6 (7.2) |
| Parity | 87 | 83 | ||
| Nullipara, % | 53 (60.9) | 48 (57.8) | ||
| Multipara, % | 34 (39.1) | 35 (43.2) | ||
| PCOS phenotype | ||||
| National Institutes of Health criteria, % | 78 | 48 (61.5) | 76 | 46 (60.5) |
| Fulfills only Rotterdam criteria, % | 78 | 30 (38.5) | 76 | 30 (39.5) |
| Mode of conception | 92 | 90 | ||
| Spontaneously, % | 52 (56.5) | 52 (57.8) | ||
| Ovulation induction, % | 25 (27.2) | 14 (15.6) | ||
| IVF/ICSI, % | 15 (16.3) | 21 (23.3) | ||
| Other, % | 0 (0) | 3 (3.3) | ||
| Weight gain in pregnancy, kg | 90 | 9.1 ± 5.5 | 89 | 10.2 ± 5.2 |
| Pregnancy complications | 92 | 90 | ||
| Preterm birth, % | 2 (2.2) | 7 (7.8) | ||
| GDMc, % | 21 (22.8) | 29 (32.2) | ||
| Preeclampsia, % | 14 (15.2) | 12 (13.3) | ||
| Placenta weight, g | 82 | 649 ± 160 | 77 | 673 ± 162 |
| Breastfeeding | ||||
| Duration of breastfeeding, mo | 70 | 9.5 ± 4.1 | 65 | 9.0 ± 3.7 |
| Duration of exclusive breastfeeding, mo | 68 | 4.6 ± 2.8 | 62 | 4.2 ± 2.9 |
None of the comparisons between the groups showed statistical significant difference (P < 0.05).
Abbreviations: GDM, gestational diabetes mellitus; ICSI, intracytoplasmic sperm injection; IVF, in vitro fertilization; OGTT, oral glucose tolerance test.
Twelve mothers participated twice.
Data presented as mean ± standard deviation or n (%) as appropriate.
Gestational diabetes mellitus defined as fasting plasma glucose higher than 7.0 mmol/L and/or 2-hour serum glucose higher than 7.8 mmol/L after a 75-g oral glucose tolerance test.
Offspring anthropometric outcomes were assessed by mixed models analysis (Table 2; Fig. 2).
Height, Weight, BMI, and Overweight/Obesity at 4 Y of Age and Head Circumference at 1 Y of Age, Calculated With Mixed Models Analysis
| n | At 4 Y | Metformin Effect | P | ||
|---|---|---|---|---|---|
| Height, cm | Metformin | 82 | 104.9 (104.0 to 105.7) | 0.24 (–0.99 to 1.46) | 0.705 |
| Placebo | 79 | 104.7 (103.8 to 105.5) | |||
| Height z score | Metformin | 82 | 0.18 (–0.03 to 0.38) | 0.07 (–0.22 to 0.36) | 0.651 |
| Placebo | 79 | 0.11 (–0.10 to 0.32) | |||
| Weight, kg | Metformin | 81 | 18.3 (17.8 to 18.8) | 0.81 (0.13 to 1.49) | 0.020 |
| Placebo | 79 | 17.5 (17.0 to 18.0) | |||
| Weight z score | Metformin | 81 | 0.44 (0.22 to 0.66) | 0.38 (0.07 to 0.69) | 0.017 |
| Placebo | 79 | 0.06 (–0.16 to 0.28) | |||
| BMI, kg/m2 | Metformin | 81 | 16.6 (16.3 to 16.9) | 0.67 (0.20 to 1.14) | 0.005 |
| Placebo | 79 | 15.9 (15.6 to 16.3) | |||
| BMI z score | Metformin | 81 | 0.49 (0.25 to 0.72) | 0.45 (0.11 to 0.78) | 0.010 |
| Placebo | 79 | 0.04 (–0.20 to 0.28) | |||
| Overweight/obesity, % | Metformin | 81 | 26 (32) | 2.17 (1.04 to 4.61) | 0.038 |
| Placebo | 79 | 14 (18) | |||
| n | At 1 Y | Metformin Effect | P | ||
| Head circumference | Metformin | 78 | 47.0 (46.7 to 47.2) | 0.43 (0.05 to 0.81) | 0.026 |
| Placebo | 76 | 46.5 (46.3 to 46.8) | |||
| Head circumference z score | Metformin | 78 | 0.62 (0.40 to 0.85) | 0.27 (–0.04 to 0.58) | 0.093 |
| Placebo | 76 | 0.36 (0.13 to 0.58) | |||
Outcomes are presented as means (95% CI) or as numbers (%) as appropriate. Metformin effects are presented as the mean difference (95% CI) for anthropometric variables and as odds ratio (95% CI) for the prevalence of overweight.
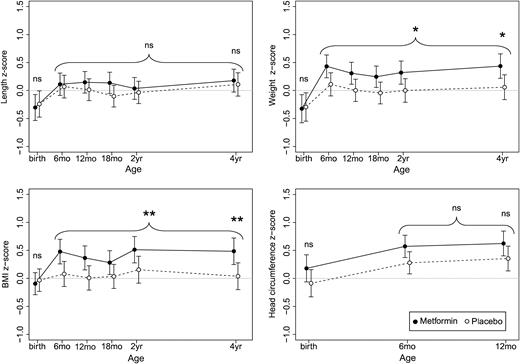
Development of length/height, weight, and BMI from birth to 4 years of age and head circumference from birth to 1 year, expressed as z scores and assessed by mixed linear models analysis. Metformin group (n = 92): solid lines and filled markings; placebo group (n = 90): broken lines and open markings; *P < 0.05, ** P ≤ 0.01. There was no statistically significant difference in height between the groups. The metformin group had higher weight and BMI at 4 years of age, a difference traceable back to 6 months of age. There was no significant difference in head circumference. ns, not significant.
Metformin had no effect on height z score at 4 years of age (d = 0.07; 95% CI: –0.22 to 0.36; P = 0.651) (Table 2), on the average height z score between 6 months and 4 years of age (d = 0.11; 95% CI: –0.13 to 0.36: P = 0.376), or on birth length z score (d = –0.06; 95% CI: –0.39 to 0.27; P = 0.708).
The metformin group weighed more than the placebo group at 4 years of age (z score d = 0.38; 95% CI: 0.07 to 0.69; P = 0.017) (Table 2). This pattern was apparent from 6 months of age (Fig. 2), and the estimated average effect of metformin on weight z score between 6 months and 4 years of age was 0.32 (95% CI: 0.06 to 0.58; P = 0.015). Metformin had no effect on birth weight z score (d = –0.03; 95% CI: –0.39 to 0.33; P = 0.867).
The metformin group had a higher BMI at 4 years of age (d = 0.45; 95% CI: 0.11 to 0.78; P = 0.010) (Table 2), a difference traceable back to 6 months of age (Fig. 2). The estimated average effect of metformin on the BMI z score during this period was 0.36 (95% CI: 0.09 to 0.64; P = 0.010). Likewise, there were more children with overweight/obesity at 4 years of age in the metformin group than in the placebo group (odds ratio: 2.17; 95% CI: 1.04 to 4.61; P = 0.038) (Table 2). The number needed to harm for an additional case of overweight/obesity at 4 years of age was 7.4 (95% CI: 3.85 to 125.0). Metformin had no effect on BMI z score at birth (d = –0.06; 95% CI: –0.35 to 0.22; P = 0.659).
There was no statistically significant effect of metformin on head circumference at the last measurement at 1 year of age (d = 0.27; 95% CI: –0.04 to 0.58; P = 0.093) (Table 2). The estimated average effect of metformin on head circumference z score between 6 months and 1 year of age was 0.28 (95% CI: –0.01 to 0.57; P = 0.055). The effect of metformin on head circumference z score at birth was 0.27 (95% CI: –0.08 to 0.61; P = 0.127).
There was no statistically significant effect modification of sex or maternal prepregnancy BMI on any of the anthropometric z score outcome variables (data not shown). Subgroup analysis of sex of primary endpoints is presented in Supplemental Table 1.
The PCOS effect
The impact of PCOS on offspring anthropometrics was evaluated by assessing the deviation in z score between the placebo group and the reference population (Fig. 2). There was no difference between the placebo group and the reference population regarding length/height at any point in time. Children in the placebo group weighed less at birth, but at subsequent measurements, the weight did not deviate from the reference population. The BMI of the placebo group did not deviate from the reference population at any time point. The head circumference of the placebo group was similar to the reference population at birth, but was larger at subsequent measurements.
Discussion
The main finding of this study was that metformin-exposed children had higher BMI at 4 years of age.
Strengths and limitations of study
A strength of this study is that it is, to date, the largest follow-up study of two RCTs on metformin exposure in utero, of children born to mothers with PCOS. These trials took place in routine clinical practice, and participants were representative for the population of women with known diagnosis of PCOS. This population probably presents specific metabolic characteristics also during pregnancy, and the current results might not easily translate to mothers without PCOS, or even to mothers that are not aware of having PCOS. Adherence to study medication during pregnancy was high, and the original studies were conducted in accordance with “Good Clinical Practice Principles” (23, 24). The anthropometric development was assessed by repeated measurements on each child, performed at child health care clinics in Norway, by nurses specially trained in child health care. The participation rate in the present follow-up study was 62%. Primary outcome measurements were present in 53% at 1 year and in 55% at 4 years, which is fairly good considering the follow-up rates in other clinical studies (18, 21). The maternal baseline characteristics of the participants and nonparticipants were comparable, except for more smokers among mothers who did not participate in the follow-up. The latter is a limitation of the study, as smoking is a negative marker of lifestyle and socioeconomic status, and the selection might thus have been skewed. However, we found no association between BMI at 4 years of age and smoking or employment status (data not shown). Other possible limitations of this study are participant rate: A higher participation rate might have provided a more precise estimate of the true effect of metformin, reduced the chance of random error, and increased the power of the study. Further, the applied Norwegian growth reference at birth is not gestational age specific, causing an inaccuracy of the z scores of the anthropometrics at birth. Information on the children’s nutrition, beyond the duration of breastfeeding, was not available and could not be adjusted for. However, significant differences between the groups are unlikely, as this is an RCT with comparable groups at baseline.
Comparison with other studies
There is limited data on this topic for comparison with our results. In one nonrandomized study on PCOS pregnancies, the postnatal growth of metformin-exposed children did not differ from the reference population at the age of 18 months (17). Another study on gestational diabetes mellitus pregnancies reported no difference in height, weight, or head circumference, but a potentially more favorable fat distribution among metformin-exposed children than children in the insulin group at 2 years of age (21). Ijäs et al. (18) found that metformin-exposed children from pregnancies with gestational diabetes mellitus were heavier at 18 months of age, which corresponds well with our results. In contrast to our results, Ijäs et al. (18) found that the growth of the metformin-exposed children was proportional, as they were also taller. However, the results from these studies on gestational diabetes mellitus are not easily interpretable, as they were not placebo controlled, and the treatment started later in pregnancy than was the case in our study. Further, the women randomized to metformin in these two studies needed supplemental insulin in 46% and 32% of the cases, respectively (18, 21).
The metformin effect
There was a stable difference in weight between the intervention groups from 6 months of age onwards, resulting in a higher prevalence of overweight and obesity in the metformin group at 4 years of age. High BMI in childhood tends to persist to adolescence and adulthood and is associated with morbidity and premature mortality later in life (28, 29). In theory, two main mechanisms of action of metformin are possible. First, it can result in maternal alterations, as metformin has the potential to ameliorate insulin resistance and thus the insulin-induced hyperandrogenism (30). These alterations may change the intrauterine environment (5) and therefore be mediators between metformin and the observed alteration in the anthropometric development. Weight gain in pregnancy is positively associated with offspring BMI at 3 years of age (31) and could represent a mediator. In the current study, we observed, however, no statistically significant alterations of the maternal parameters associated with metformin. For pregnancy weight gain in particular, there was rather a trend toward lower weight gain in the metformin group. Any substantial indirect effect of metformin on offspring, mediated through alterations of maternal parameters seems therefore to be less likely. Second, as metformin crosses the placental barrier (15), a direct effect of metformin on the offspring is possible. Salomäki et al. (32) reported that mice exposed to metformin in utero had lower birth weights and body composition similar to offspring of maternal malnourishment models. This is compatible with the molecular mechanisms of action of metformin. Metformin inhibits the mitochondrial respiratory chain, resulting in increased adenosine 5′-monophosphate (AMP):adenosine triphosphate ratio (14). This in turn initiates several cascades, most of them dependent upon activation of AMP-activated protein kinase. The result is mainly an inhibition of the gluconeogenesis, turning the cell into a catabolic or “starving” state (14). In agreement with our results, Salomäki et al. (32) described intrauterine metformin-exposed mice with increased weight after birth, mainly caused by an increased amount of fat tissue. The alterations in weight associated with intrauterine metformin exposure might be seen in light of “developmental origin of health and disease” or “the Barker hypothesis” postulating that the fetal and early life environment has effects on health later in life by permanently altering the physiology and the metabolism of the body (8, 33). A possible mechanism of these alterations is epigenetic programming (33).
In the present follow-up study, the difference in head circumference between groups at birth did not reach statistical significance. This is most probably due to lack of power to detect a difference between the groups (type II error), as measurements of head circumference of all newborns (N = 270) in the PregMet study showed a larger head circumference in those who were exposed to metformin (24). The effect of metformin on head circumference from 6 months to 1 year of age was borderline significant. In children, head circumference measurements are strongly correlated to brain volume (34) and are associated with better cognitive function and reduced risk of premature mortality from coronary heart disease (35). Metformin crosses the blood-brain barrier in rats and is distributed in several parts of the brain (36). AMP-activated protein kinase, upon which most of the mechanisms of actions of metformin are dependent, is an important energy sensor also in neurons (37). The mechanisms explaining the association between metformin and the probable alterations in head circumference, and how these alterations might be translated into future cognitive and mental health, are unclear.
Subgroup analyses of sex revealed a larger head circumference at 1 year of age among metformin-exposed girls than in placebo-exposed girls (Supplemental Table 1). No such difference was found among boys. There is no obvious explanation to this seemingly sex-related difference in metformin effect.
There was a higher prevalence of overweight/obesity at 4 years of age among metformin-exposed boys, compared with placebo-exposed boys, whereas no difference was found between the treatment groups in girls. This should be interpreted in light of the different prevalence of overweight among placebo-exposed boys and girls. Importantly, sex was not found to cause any statistically significant modification of the metformin effect on any of the outcome variables. Further, it is noteworthy that these subgroup analyses were not adjusted for multiple testing and therefore should be interpreted with caution.
The PCOS effect
To evaluate the postnatal growth of offspring of women with PCOS, we compared the placebo group with the reference population. Only a limited number of studies have described the postnatal growth of offspring of women with PCOS, with diverging conclusions (38–40). In our study, the height, weight, and BMI of the placebo group did not deviate from the reference population from 6 months of age. These results should be assessed in relation to the maternal prepregnancy BMI of 28.4 kg/m2, as maternal prepregnancy BMI correlates positively to offspring weight in childhood (31). It is therefore surprising that the placebo group does not develop higher BMI than the reference population. The BMI of the mothers in the reference population is unfortunately not available. However, the average maternal prepregnancy BMI in a large Norwegian cohort study comparable to the reference population was 24.0 kg/m2 (31). Comparing our data to offspring of healthy overweight mothers could have provided more information on the isolated effect of PCOS on the growth of the offspring. However, a reference population of healthy overweight mothers was not found. The seeming lack of concordance between the elevated maternal BMI and offspring BMI in the present follow-up study is assumed beneficial. It might partly be due to potential improvements in lifestyle related to study participation. The head circumference of the offspring in the placebo group was larger than the reference population from 6 months of age. This might be methodologically related, as many nurses measured the children in the follow-up routinely in the primary health care, whereas the reference was constructed from measurements performed by few trained observers using strict methodology. The unexpected findings of our study emphasize the need for further observations and studies to confirm our results and to assess their clinical implications.
Conclusion
Contrary to our hypothesis, metformin-exposed children of mothers with PCOS had higher BMI at 4 years of age compared with placebo-exposed children. The clinical implications of this are not known, and the body composition and metabolic health of these children should therefore be subject to further investigation. Until we have more robust data on the possible beneficial effects of metformin use during pregnancy, it should only be used in RCTs with long-term follow-up of the children.
Abbreviations:
- AMP
adenosine 5′-monophosphate
- BMI
body mass index
- CI
confidence interval
- PCOS
polycystic ovary syndrome
- RCT
randomized controlled trial
Acknowledgments
We thank all participants in the pilot study, the PregMet study, and the present follow-up study for their contributions.
Financial Support: This work was supported by the Research Council of Norway (to E.V.), which funded the present follow-up study (registration number 239987), and NovoNordisk Foundation (to E.V.) and Felles Forskningsutvalg (FFU).
Clinical Trial Information: ClinicalTrials.gov no. NCT00159536 (registered 12 September 2005) and NCT03259919 (registered 24 August 2017).
Author Contributions: E.V. and S.M.C. conceived and designed the original protocol. E.V. and R.Ø. wrote the protocol of the present follow-up study. S.S. collected data. L.G.E.H. managed the database and ran preliminary analysis with input from Ø.S. and M.R., L.G.E.H., Ø.S., P.B.J., and M.R. analyzed the data. L.G.E.H. drafted the manuscript. All authors contributed to the discussion and drafts, have had full access to all of the data in the study, and take responsibility for the integrity of the data and the accuracy of the data analysis. L.G.E.H. and E.V. are guarantors of the paper and affirm that the manuscript is an honest, accurate, and transparent account of the study being reported, that no important aspects of the study have been omitted, and that any discrepancies from the study as planned have been explained.
Disclosure Summary: The authors have nothing to disclose.
References
Author notes
These authors contributed equally to this study.
