


Abstract
Patients with von Hippel–Lindau (vHL) disease caused by a missense VHL mutation have a more severe phenotype compared with other VHL mutation types.
To define pancreatic neuroendocrine tumor (PNET) aggressiveness according to VHL genotype.
A prospective natural history study.
The National Institutes of Health clinical center.
Patients with vHL disease, pancreatic manifestations, and germline missense VHL gene mutations.
In-silico prediction of VHL mutation via five computational prediction models. Patients with >80% prediction for disease-causing mutations in all models [high predicted risk (HPR)] were compared with others [low predicted risk (LPR)].
Rates of metastases, surgical intervention, and disease progression.
Sixty-nine patients were included: 2 developed metastases, 12 needed surgery, and 31 had disease progression during a median follow-up of 60 months (range 13 to 84 months). Thirteen patients were excluded for low prediction reliability. In the remaining 56 patients (45 with PNETs, 11 with pancreatic cysts), the HPR group (n = 13) had a higher rate of disease progression than the LPR group (n = 43) in multivariable analysis (hazard ratio 3.6; 95% confidence interval, 1.1 to 11.9; P = 0.037). The HPR group also had a higher risk of developing metastases (P = 0.015). Among patients with codon 167 hotspot mutations (n = 26), those in the HPR group had a higher risk for disease progression (P = 0.03) than other patients.
Computational models for predicting the impact of missense VHL gene mutations may be used as a prognostic factor in patients with PNETs in the context of vHL disease.
Von Hippel–Lindau (vHL) disease is a familial neoplasia syndrome that occurs at a rate of one in 36,000 live births (1). Clinical manifestations of vHL disease include retinal and central nervous system hemangioblastomas, endolymphatic sac tumors, pancreatic neuroendocrine tumors (PNETs) and cysts, renal cell carcinomas, and pheochromocytomas (1). The disease is caused by a germline mutation in the VHL tumor suppressor gene, located on the short arm of chromosome 3 (3p25 to 3p26), and it has three exons (2, 3). vHL disease is inherited as an autosomal dominant disease with 90% penetrance by the age of 65 years (4, 5). A pathogenic germline mutation in VHL is identified in >95% of patients with vHL disease (1, 4).
The prevalence of PNETs in vHL disease ranges from 9% to 17% (6), with multiple PNETs present in 32% to 53% of patients (7, 8). Sixty percent of PNETs in patients with vHL disease grow during follow-up (7); however, their growth is nonlinear (7). Several risk factors for PNET metastasis in vHL disease have been reported, including greatest tumor diameter >3 cm (9), blood type O (10), tumor doubling time <500 days, and mutations in exon 3 of the VHL gene (9).
The VHL protein binds to an elongin C–elongin B complex in the presence of oxygen and iron (Fe2+). The VHL elongin C–elongin B complex binds HIF1α and causes ubiquitination and degradation of HIF1α (11–13). When the VHL gene is mutated, intracellular HIF1α protein levels accumulate and induce a pseudohypoxic state, activating the transcription of hypoxia-inducible genes (14, 15). The α-helix domain of the VHL protein binds the elongin C–elongin B complex and is encoded by exon 3 of the VHL gene (16). Indeed, genotype-phenotype associations have been reported and are caused by VHL mutations in exons important for the regulatory function of the VHL protein (such as in exon 3), leading to a more severe phenotype (17).
We recently analyzed the greatest tumor diameter and VHL genotype in a prospective study of patients with pancreatic manifestations of vHL disease. We found that only patients with missense VHL gene mutations developed metastatic disease over a median follow-up of 4.5 years. In addition, we found a low risk for needing surgical intervention or for disease progression among those with nonmissense mutations or non–exon 3 mutations (18). However, the positive predictive value (PPV) of a missense VHL gene mutation for tumor growth and metastases eventually necessitating surgical intervention was not high enough (9.2%) to implement in clinical practice. Thus, we aimed to further characterize the prognosis of this high-risk patient subgroup based on their VHL genotype. Because of the close genotype-phenotype association, we posited that the computational predictive models for protein structure might be associated with PNET phenotype and disease course. In the current study, we studied patients with vHL-associated pancreatic lesions and the association between the prediction score of various computerized models and the natural history of PNETs in vHL disease.
Materials and Methods
Patients were enrolled in a prospective clinical protocol to evaluate the natural history of vHL-associated pancreatic lesions (n = 301, NCT00062166). In the current analysis, we included only patients who underwent at least two evaluations by computed tomography (CT) scan between January 2010 and January 2017 (n = 229) and specifically those with a known variant of missense VHL gene mutation (n = 69, Fig. 1). All variants included in the current analysis were defined as damaging by at least two prediction models.
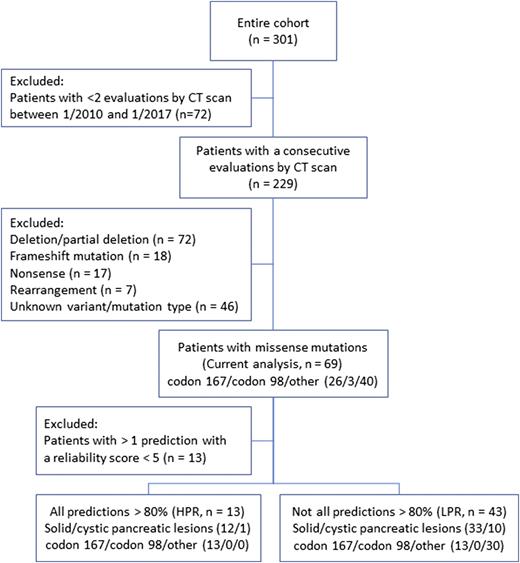
Flowchart describing the patients included in the analysis and in the subgroups, according to the computed risk for altered protein function. HPR, high predicted risk; LPR, low predicted risk.
The following were the eligibility criteria for the clinical protocol: age ≥12 years and a diagnosis of vHL disease based on the presence of a germline VHL mutation or the presence of clinical criteria for the diagnosis of vHL disease (multiple hemangioblastomas in the central nervous system, or a family history of vHL and the presence of a typical vHL manifestation) (14). In addition, patients had to have at least one pancreatic manifestation of vHL disease as documented on any noninvasive imaging study. These manifestations include pancreatic simple or complex cysts and solid lesions. Patients unwilling to undergo serial noninvasive imaging were excluded from the study. Of a total of 229 patients, 175 had solid pancreatic lesions, and 54 had only pancreatic cysts. This study was approved by the Institutional Review Board of the National Cancer Institute, and written informed consent was obtained from all patients enrolled in the study.
Computerized mutation risk prediction
The in-silico prediction of VHL mutation impact was analyzed with five computational prediction models (PolyPhen-2 HumVar and HumDiv, SNPs&GO, PANTHER, and PhD-SNP). We used a prediction score cutoff of ≥0.8 based on an analysis comparing computerized prediction confirmed by studies in vitro that showed a high sensitivity and a low false negative rate with this cutoff for the PolyPhen-2 model (19). Patients were divided into those with prediction >80% for disease-causing mutations in all models [high predicted risk (HPR)] and others [low predicted risk (LPR)]. Patients with >1 prediction with a low reliability index score (<5) were excluded (n = 13, Fig. 1).
Imaging protocol and lesion measurements
As part of the research protocol, all patients underwent pancreatic protocol (2-mm slice thickness) abdominal and pelvis CT scan with intravenous contrast media injected at 3 mL/s, and images were obtained within 10 to 20 seconds after injection for an early and late arterial and venous phase. CT scans are performed annually in patients with solid pancreatic lesions and every 2 years for patients with pancreatic cystic lesions. Each imaging study was assessed by at least two independent reviewers, who cataloged all measurements of solid pancreatic lesions with pathognomonic features of PNETs according to early arterial phase enhancement (6). For measurement discrepancies, a consensus measurement was established. Disease progression was defined as tumor growth of >20% in the greatest diameter between scans.
Criteria for surgical intervention used in patients with solid vHL-associated pancreatic solid lesions
The criteria for surgical resection (enucleation or pancreatectomy with regional lymph node dissection) of pancreatic solid lesions were greatest tumor diameter ≥3 cm when located in the neck, body, or tail of the pancreas; greatest tumor diameter ≥2 cm in the pancreatic head; and suspicion or presence of locoregional lymph node or distant metastases (6).
VHL gene mutation analysis
Patients diagnosed with vHL disease had genetic testing for mutations in the three coding exons and exon-intron boundaries of the VHL gene and for partial or complete deletion or duplication of the VHL gene in Clinical Laboratory Improvement Amendments–approved laboratories using standard methods included Sanger sequencing and Southern blotting (20). The current analysis included only patients with a missense VHL gene mutation.
Based on our previous results, we defined patients with a largest tumor diameter from 1.2 to 3 cm as an intermediate-risk group for developing metastases, needing intervention, or having disease progression. The highest risk within this group was found among patients with missense or exon 3 VHL mutations. Therefore, we performed a subgroup analysis among patients with maximal lesion diameter >1.2 cm and <3 cm and a missense VHL gene mutation (n = 29).
Statistical analysis
Statistical calculations were performed in SPSS 20.0 (SPSS Inc., Chicago, IL). Results are presented as mean ± standard deviation unless otherwise indicated. For group comparisons, the independent Student t test was used to analyze differences in parametric variables, and the χ2 test was used to analyze differences in categorical variables. Nonparametric tests were used as appropriate. The Kaplan-Meier estimator with a log-rank (Mantel-Cox) test was used to estimate the risk for developing metastases, needing a surgical intervention, or having disease progression during follow-up. The estimates were compared between the groups. Cox regression analysis was used to estimate hazard ratios and 95% confidence intervals for disease progression during follow-up, controlling for the number of PNETs, evaluation rate, presence of a hotspot mutation, sex, age, and largest tumor diameter. Receiver operating characteristic curves were analyzed with the pROC package (21) in R statistics (version 3.4.1) with R-Studio (version 1.0.153; R-Studio, Inc., Boston, MA). The two-tailed P value for statistical significance was set at <0.05.
Results
Sixty-nine patients with pancreatic manifestations of vHL disease and missense VHL mutations were analyzed. Four patients developed metastatic disease (4 of 4 needed intervention, 2 of 4 progressed during follow-up), 14 needed surgical intervention (2 of 14 had metastatic disease, 8 of 14 had disease progression), and 31 had disease progression during a median follow-up of 60 months (range 13 to 84 months). The study cohort demographic and clinical characteristics are summarized in Table 1.
Baseline Demographic and Clinical Characteristics of the Study Cohort
| Characteristic | n = 69 |
|---|---|
| Age, y | 50.5 ± 12.6 |
| Female, n (%) | 36 (52.2) |
| Type of pancreatic lesion, n (%) | |
| Solid | 25 (36.2) |
| Cystic | 12 (17.4) |
| Both | 32 (46.4) |
| vHL disease manifestations, n (%) | |
| Clear-cell renal cell carcinoma | 57 (52.6) |
| Central nervous system hemangioblastomas | 41 (59.4) |
| Retinal hemangioblastoma | 28 (40.6) |
| Pheochromocytoma | 23 (33.3) |
| VHL mutation position, n (%) | |
| Exon 1 | 29 (42.0) |
| Exon 2 | 8 (11.6) |
| Exon 3 | 32 (46.4) |
| Prediction results, n (%) | |
| Risk prediction >80% in all modelsa | 56 (81.2) |
| Yes | 13/56 (23.2) |
| No | 43/56 (76.8) |
| Low prediction reliability | 13 (18.8) |
Computational prediction models used included PolyPhen-2 HumVar and HumDiv, PhD-SNP, PANTHER, and SNPs&GO.
In-silico mutation analysis
The protein sequence variants and risk prediction results are detailed in Table 2. Thirteen patients were excluded from the analysis because of low reliability of the prediction score in at least one model. No significant difference was found between patients included and those excluded from the analysis based on prediction reliability, in terms of disease progression (log-rank test, P = 0.4), needing an intervention (P = 0.6), or developing metastatic disease (P = 0.1). In the remaining 56 patients (45 with PNETs and 11 with pancreatic cysts), 13 patients had a high (>80%) predicted risk in all models (HPR group), whereas 43 did not have high-risk consensus in all models (LPR group; Fig. 1). Patients in the LPR and HPR groups had a comparable mean age (50.6 ± 12.3 years vs 50.3 ± 14.0 years, P = 1.0), number of pancreatic lesions (2.7 ± 1.9 vs 3.3 ± 2.0, P = 0.3), and largest lesion diameter (1.5 ± 0.8 cm vs 2.0 ± 2.0 cm, P = 0.4), respectively, whereas patients in the LPR group consisted of fewer women (46.4% vs 76.9%, P = 0.047).
Prediction Scores for the VHL Protein Variants as Calculated by Five Different Computerized Prediction Models
| VHL Protein Variant | Number of Patients | Computational Prediction Models | ||||
|---|---|---|---|---|---|---|
| PhD-SNP | PANTHER | SNPs&GO | HumDiv | HumVar | ||
| S65W (22, 23) | 2 | 0.540 | 0.872 | 0.949 | 1.000 | 0.999 |
| N78S (24) | 4 | 0.735 | 0.389 | 0.948 | 0.999 | 0.968 |
| P86R (25) | 4 | 0.685 | 0.673 | 0.959 | 1.000 | 1.000 |
| P86S (26) | 4 | 0.632 | 0.530 | 0.951 | 1.000 | 1.000 |
| W88R (27) | 1 | 0.816 | 0.694 | 0.982 | 0.985 | 0.937 |
| G93V (28) | 1 | 0.831 | 0.675 | 0.982 | 1.000 | 1.000 |
| Y98H (28) | 2 | 0.603 | 0.562 | 0.954 | 1.000 | 0.999 |
| Y98S (29) | 1 | 0.608 | 0.588 | 0.968 | 1.000 | 0.999 |
| L101G (20) | 2 | 0.400 | 0.688 | 0.944 | 0.997 | 0.953 |
| S111N (30) | 4 | 0.574 | 0.159 | 0.909 | 0.143 | 0.091 |
| G114R (31) | 2 | 0.762 | 0.383 | 0.952 | 1.000 | 1.000 |
| W117C (20) | 2 | 0.867 | 0.789 | 0.987 | 1.000 | 0.997 |
| D121Y (32) | 1 | 0.922 | 0.702 | 0.987 | 1.000 | 0.997 |
| F136S (33) | 3 | 0.780 | 0.217 | 0.969 | 0.930 | 0.673 |
| A149S (34) | 4 | 0.661 | 0.259 | 0.914 | 1.000 | 0.997 |
| L158P (35) | 6 | 0.890 | 0.683 | 0.978 | 1.000 | 1.000 |
| R167L | 2 | 0.861 | 0.443 | 0.972 | 1.000 | 0.998 |
| R167Q (28) | 11 | 0.797 | 0.368 | 0.958 | 1.000 | 0.997 |
| R167W (28) | 13 | 0.834 | 0.814 | 0.973 | 1.000 | 1.000 |
Because mutations in codon 98 of the VHL gene (n = 3), a known VHL gene hotspot, were found to be of low prediction reliability and excluded from the analysis, we performed a separate analysis for the entire cohort. Patients with either codon 98 or codon 167 hotspot mutations (n = 29) had comparable risk for developing metastases (log-rank test, P = 0.3), needing a surgical intervention (P = 0.9), or experiencing disease progression (P = 0.7) during follow-up, as compared with patients with any other mutation position.
We compared the prediction scores for each of the five models used in our analysis by the pancreatic phenotype outcome and found a low association between each model’s independent prediction score and the various clinical outcomes (Table 3; Supplemental Fig. 1). Patients with solid (n = 57, 92.6%) versus cystic pancreatic lesions only (n = 12, 17.4%) had a higher predicted risk for a malfunctioning VHL protein according to the PolyPhen-2 model, based both on the HumVar (P = 0.02) and HumDiv databases (P < 0.001; Fig. 2).
Comparison of Prediction Score of Each Prediction Model by Pancreatic Phenotype in Patients With vHL Disease
| Prediction Model | Lesion Type | Metastatic Disease | Surgical Intervention During Follow-Up | Disease Progression During Follow-Up | ||||
|---|---|---|---|---|---|---|---|---|
| Only Cystic | Solid Lesion | No | Yes | No | Yes | No | Yes | |
| HumDiv | 0.64 ± 0.44a | 0.95 ± 0.19a | 0.95 ± 0.19 | 1.0 ± 0 | 0.98 ± 0.13 | 0.88 ± 0.30 | 0.93 ± 0.23 | 0.97 ± 0.15 |
| HumVar | 0.62 ± 0.45b | 0.94 ± 0.19b | 0.94 ± 0.20 | 1.0 ± 0 | 0.97 ± 0.13 | 0.86 ± 0.30 | 0.92 ± 0.23 | 0.96 ± 0.16 |
| PhD-SNP | 0.66 ± 0.18 | 0.73 ± 0.18 | 0.72 ± 0.19 | 0.74 ± 0.11 | 0.75 ± 0.14 | 0.66 ± 0.26 | 0.69 ± 0.21c | 0.76 ± 0.15c |
| PANTHER | 0.49 ± 0.27 | 0.55 ± 0.23 | 0.54 ± 0.22 | 0.72 ± 0.12 | 0.55 ± 0.21 | 0.54 ± 0.27 | 0.54 ± 0.24 | 0.55 ± 0.22 |
| SNPsGO | 0.95 ± 0.03 | 0.93 ± 0.12 | 0.93 ± 0.12 | 0.96 ± 0.01 | 0.95 ± 0.08 | 0.89 ± 0.19 | 0.92 ± 0.14 | 0.95 ± 0.10 |
P values of Mann-Whitney U test, for the comparisons of each prediction score calculated for patients with versus without the clinical outcome tested.
P < 0.01.
P < 0.05.
P < 0.1.
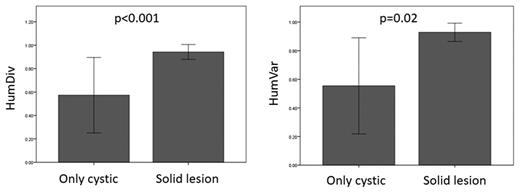
Comparison of the computed risk for altered protein function by the HumDiv and HumVar prediction models by the type of pancreatic involvement of vHL disease. Groups were compared with the Mann-Whitney U test.
In the survival analysis, the HPR group patients had a higher rate of disease progression both in univariate (log-rank test, P = 0.006), and multivariable analysis (hazard risk 3.6; 95% confidence interval, 1.1 to 11.9; P = 0.037) and had a higher risk of developing metastases (P = 0.015; Fig. 3).
The PPVs of a high-risk consensus based on all five computerized models in our cohort were 53.8%, 15.4%, 30.8%, and 61.5% for having solid pancreatic lesion, having metastatic disease, needing an intervention, and experiencing disease progression during follow-up, respectively.
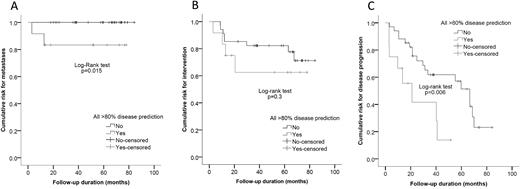
(A) Survival analysis comparing the risk for developing metastatic disease, (B) needing surgical intervention, and (C) experiencing disease progression for patients with and without >80% prediction for disease-causing mutations in all prediction models.
Patients with only codon 167 hotspot mutations
Twenty-six patients (53.6%) had missense mutations in the codon 167 hotspot region of the VHL gene, including all patients in the HPR group (which had the p.Arg167Trp variant) and an additional 13 patients from the LPR group with other protein variants (p.Arg167Leu and p.Arg167Gln; Table 2). Those in the HPR group had a higher risk of disease progression during follow up compared with patients in the LPR group (log-rank test, P = 0.03).
To further assess the effect of the p.Arg167Trp variant and other missense mutations, we compared patients with the p.Arg167Trp variant (n = 13) with all other patients with a known VHL genotype, including those with other missense mutation variants from the current analysis (total of 157 patients). We found that patients with the p.Arg167Trp variant had higher risk for developing metastases (log-rank test, P = 0.003) and for disease progression (P = 0.002), with a trend for higher risk for needing an intervention during follow-up (P = 0.055).
When comparing patients with missense mutations and an LPR in our analysis (n = 43) with patients harboring a nonmissense VHL mutations (n = 114), we found that the risks for developing metastases, experiencing disease progression, and needing an intervention during follow-up were comparable (P = 0.5, P = 0.4, and P = 0.2, respectively).
Patients with maximal lesion diameter ≥1.2 cm and ≤3 cm
In our previous study, we found that patients with a greatest tumor diameter ≥1.2 cm and ≤3 cm and missense VHL mutations had an intermediate risk of developing metastases, needing surgical intervention, or experiencing disease progression, and we found that they would still need close annual imaging surveillance (18). When using the in-silico computerized modeling for the VHL mutation in this subgroup of patients (n = 23), we found that the HPR group had a higher risk for developing metastases (2 in 5 vs 0 in 18, log-rank test P = 0.005) and needing a surgical intervention (4 in 5 vs 7 in 18, P = 0.01), and they showed a trend for disease progression (3 in 5 vs 11 in 18, P = 0.08) as compared with the LPR group. These findings suggest that the in-silico computerized modeling could refine and personalize the surveillance approach in patients with VHL missense mutations in this intermediate group.
Discussion
In the current study, we show the clinical utility of computerized protein function prediction models of germline VHL missense mutations as a prognostic factor in patients with pancreatic manifestations of vHL disease. Patients with a consensus of high risk predictions in five models for a damaging mutation, as defined by predicted risk >80%, had a higher risk for metastatic disease and disease progression. We also found that, even among patients with the codon 167 hotspot VHL gene mutation, the prediction model consensus may serve as a prognostic factor in terms of risk for metastatic disease and for disease progression. Finally, among patients with an intermediate risk for PNETs progression based on lesion diameter (18), those in the HPR group had a higher risk of developing metastases and needing an intervention during follow-up.
We used five computerized risk prediction models to determine the prognostic utility of analyzing missense germline VHL mutations in patients with vHL-associated pancreatic lesions. The PolyPhen-2 (version 2.2.2) model predicts the impact of single-nucleotide polymorphisms on protein function based on the protein sequence and structure by using multiple-sequence alignment with reference proteins. The comparison is based on two databases: HumDiv, which is based on disease-causing variants from the UniProt database versus neutral divergence from mammalian homolog sequences, and HumVar, which includes disease-causing versus common (>1% allele frequency) variants that are considered nondeleterious (36). In addition, we used PANTHER, a risk prediction model based on protein families’ multiple-sequence alignments that predicts protein function based on the protein sequence (37); SNPs&GO, which is unique in that it incorporates gene ontology annotation to the risk stratification model (38); and PhD-SNP, a protein sequence–based phenotype predicting model (39). The only variant with a HPR consensus was p.Arg167Trp, despite the presence of other variants in the same high-risk codon (p.Arg167Leu and p.Arg167Gln), which had lower risk scores in some of the risk prediction models. That result emphasizes the importance of the additional information gathered from the presence versus absence of high risk consensus and the strong genotype-phenotype association in vHL disease in regard to PNETs prognosis.
The p.Arg167Trp variant included in the analysis is probably responsible for the higher risk of patients with missense mutation. This association is evident from the greater risks for developing metastases and disease progression of these patients compared with all other patients with a known VHL genotype, which were not found when we compared patients with any other missense VHL mutation with patients harboring a nonmissense VHL mutation.
In our cohort, patients with versus without hotspot VHL gene mutations (codons 98 and 167) had comparable prognosis in terms of developing metastases, needing a surgical intervention, or having disease progression during follow-up. This finding demonstrates the superiority of computerized model prediction over missense mutation position as a prognostic factor in patients with vHL disease and emphasizes the strength of prediction models that take into account additional parameters to accurately determine the protein function, leading to a stronger association with the patient’s phenotype and prognosis.
The PPV for developing metastases in our cohort was 15.4%, when using the high risk prediction consensus. The low value is explained mainly by the low event rate in patients with PNETs and VHL (9, 18). We previously reported that among patients with intermediate risk according to primary tumor greatest diameter, having a missense or exon 3 VHL mutation was highly associated with a high risk for progression or intervention. Thus, the PPVs calculated in the current analysis add to our previous findings, emphasizing the utility of the risk prediction consensus in this population.
All the variants analyzed in the current study were reported as damaging in at least two prediction tools (Table 2), and all variants but one (p.R167L), which is positioned in the 167 codon hotspot, were reported previously either as a germline or a somatic mutation (Table 2). Because all the patients in the current cohort have clinical manifestations of the disease, these mutations were considered responsible for the phenotype.
The use of a computerized prediction model is intended for analyzing the risk of variants of uncertain significance to be damaging and to encode a malfunctioning protein. Considering the genotype-phenotype association in vHL disease (4, 35), we analyzed the utility of the computerized prediction models to determine whether specific genotypes are associated with VHL phenotype in these patients. Indeed, we observed that even when the mutation is known to cause a disease, the prediction scores may be of further utility to determine each patient’s disease course with respect to PNETs associated with vHL disease.
The use of an in-silico analysis for the prediction of clinical phenotype has been reported in the past for other inherited diseases. Heineman et al. (40) reported an association between the risk predicted from using PolyPhen-2 for RET protooncogene mutations and a clinically based risk score of patients with familial medullary thyroid carcinoma or multiple endocrine neoplasia type 2. An in-silico analysis was also reported in mucopolysaccharidosis type 1, for which several models were shown to be effective at identifying gene variants of phenotypic significance (41). We report here the prognostic utility of in-silico analysis of germline missense VHL mutations in patients with vHL-associated pancreatic lesions. Based on these results and the better risk stratification resolution derived for patients with missense VHL mutations, we recommend having a high index of suspicion for patients with the p.Arg167Trp VHL protein variant, which is associated with a high risk for developing metastatic disease and needing surgical intervention during follow-up.
The current study has several limitations, including a small sample size and a low event rate, which is typical in patients with vHL-associated PNETs (9, 18). However, even with these limitations, the prognostic utility of germline missense VHL mutation in-silico analysis was found to be significant. In addition, two patients with metastatic PNETs were excluded from the analysis because of low prediction reliability.
In conclusion, computerized risk prediction models may help identify high-risk germline missense VHL mutations that can be used to tailor the surveillance of patients with pancreatic manifestations of vHL disease. This data are preliminary and in a limited cohort size and should be validated in an independent cohort and for other manifestations of the disease.
Abbreviations:
- CT
computed tomography
- HPR
high predicted risk
- LPR
low predicted risk
- PNET
pancreatic neuroendocrine tumor
- PPV
positive predictive value
- vHL
von Hippel–Lindau.
Acknowledgments
Financial Support: The study was funded by the grant 1ZIA BCO1127507 from the Intramural Research Program of the Center for Cancer Research, National Cancer Institute (to E.K.).
Disclosure Summary: The authors have nothing to disclose.
References
