


Abstract
Infants born small for gestational age (SGA) have increased risk for obesity and metabolic syndrome, but the underlying mechanisms are not fully elucidated. Adipocyte fatty acid–binding protein (AFABP) is an adipokine that has been implicated in modulation of insulin sensitivity and lipid metabolism. Higher plasma AFABP levels are associated with increased risk of metabolic syndrome and cardiovascular morbidity in adults. Alterations in AFABP levels during fetal growth have not been characterized.
To examine AFABP levels in neonatal cord blood in relation to gestational age and birth weight.
A cross-sectional study of 361 neonates born at a tertiary academic center.
Plasma AFABP levels were measured by enzyme-linked immunosorbent assay. For comparison, venous samples from 26 adults were analyzed.
AFABP levels were higher in neonates compared with adults (P < 0.01). Preterm infants had higher AFABP levels [48.2 (31.2 to 73.3) ng/mL] compared with full-term infants [35.8 (25.1 to 51.5)] ng/mL, P < 0.01). There was a negative correlation between AFABP and gestational age (r = 0.28, P = 0.02). Among full-term infants, AFABP levels in SGA infants were lower [28.6 (24.2 to 37.3) ng/mL], compared with appropriate for gestational age [36.1 (25.5 to 50.4) ng/mL] and large for gestational age infants [45.0 (24.6 to 62.4) ng/mL, P < 0.05].
These associations may reflect the higher metabolic activity during fetal development. AFABP may also be involved in fetal growth and the association between SGA status and obesity and metabolic syndrome in later life.
The prevalence of noncommunicable metabolic diseases such as obesity and metabolic syndrome is of global concern, and the fetal period is known to be critical in the development of these metabolic diseases (1, 2). Intrauterine nutritional deprivation, reflected by intrauterine growth restriction, is known to be associated with obesity and metabolic syndrome in later life (3); however, the underlying mechanisms for this association are not fully elucidated.
Adipocyte fatty acid–binding protein (AFABP, FABP4), a member of the fatty acid–binding protein family, is a small 15-kDa lipophilic protein that binds a variety of hydrophobic ligands, including fatty acids (4). The full extent of the biological function of AFABP still needs to be elucidated, but studies in animal models suggest that it functions as a critical mediator of inflammatory and metabolic processes (5). AFABP is expressed in large quantities in adipocytes, where its expression is induced by fatty acids, insulin-like growth factor 1, and peroxisome proliferator-activated receptor γ agonists. AFABP is also detected in a subset of endothelial cells and macrophages, where it is involved in regulation of angiogenic and inflammatory responses (5–7). Intracellular AFABP contributes to fatty acid uptake and intracellular transfer of fatty acids. Although deletion of the FABP4 gene does not induce any phenotypic alterations at baseline, it results in improved insulin sensitivity in diet-induced obese mice, and treatment with recombinant AFABP leads to insulin resistance (4). AFABP is detected in human plasma, and adipocytes are the primary source of circulating AFABP (8). Secretion of AFABP from adipocytes is induced by fasting and other lipolysis-related signals. In humans, high levels of plasma AFABP are associated with metabolic syndrome, type 2 diabetes mellitus, heart failure, and stroke (9–13). However, the potential association of AFABP with fetal and neonatal growth and risk for later metabolic morbidities is unknown.
We performed a cross-sectional study of newborn infants and examined the association between cord blood AFABP levels, gestational age, and birth weight category across a range of gestational ages from 26 to 41 weeks.
Methods
Study population
We performed a cross-sectional study of 361 neonates born at Brigham and Women’s Hospital from April 2010 to June 2014: umbilical cord blood was collected from both vaginal and Cesarean deliveries when one of the researchers was available, and when there was no need to save cord blood for another purpose such as cord blood banking. The study protocol was reviewed and approved by the Institutional Review Board of Brigham and Women’s Hospital. The study adheres to the declaration of Helsinki.
We excluded newborns with major congenital anomalies such as congenital heart and renal anomalies or maternal chronic inflammatory disease, such as Crohn’s disease, ulcerative colitis, autoimmune diseases, or cancer. Determination of gestational age was based on best obstetrical estimate from the medical record. Neonates were categorized as small for gestational age (SGA; birth weight <10th percentile), appropriate for gestational age (AGA; 10th percentile, ≤birth weight ≤90th percentile), and large for gestational age (LGA; birth weight >90th percentile) groups based on the standard intrauterine growth curve (14).
Among the 361 infants included in analysis, 217 were full-term (≥37 weeks), and 144 were preterm infants (35 to 36 weeks, 59; 32 to 34 weeks, 33; 29 to 31 weeks, 30; 26 to 28 weeks, 22).
Cord blood collection and measurement of plasma AFABP
Umbilical cord samples were collected at the time of delivery. They were centrifuged, and the plasma was divided into 0.5-mL aliquots, which were stored in Eppendorf tubes at −80°C until analysis. Plasma AFABP levels were measured by enzyme-linked immunosorbent assay (Biovendor Laboratory Medicine, Brno, Czech Republic), with intra- and interassay coefficients of variance 2.5% and 3.9%, respectively.
Clinical data of mothers and neonates
We collected clinical information from the electronic medical records. Maternal data included age, race/ethnicity, parity, multiple versus singleton gestation, smoking status, prepregnancy body mass index (BMI), pre-eclampsia, and gestational diabetes. Infant data included sex, gestational age, mode of delivery, birth weight, and 1- and 5-minute Apgar scores. Birth weight z scores were obtained using a reference by Fenton and Kim (14). Diagnosis of maternal pre-eclampsia was made by systolic blood pressure ≥140 mmHg and/or diastolic 90 mmHg after 20 weeks of gestation, and proteinuria ≥0.3 g protein in 24-hour urine or spot urine protein/creatinine ratio ≥0.3 mg/mg (15). Diagnosis of gestational hypertension was made by blood pressure >140/90 after 20 weeks of gestation without proteinuria (16). Diagnosis of gestational diabetes was made by glucose-loading test with 50 g glucose, and confirmed by subsequent diagnostic oral glucose tolerance test with 100 g glucose. Gestational diabetes was diagnosed when two or more of the following criteria were met: the glucose level at fasting was >95 mg/dL, 1-hour glucose >180 mg/dL, 2 hour >155 mg/dL, and 3 hour >140 mg/dL (17).
Statistical analysis
Normality of distribution of AFABP values was tested with the Shapiro–Wilk test. Kruskal–Wallis test was used for continuous variables for comparisons between three or more groups. Post hoc pairwise analyses between two groups were performed by Mann–Whitney U test with Bonferroni correction for continuous variables. χ2 test and Fisher’s exact tests were used for categorical variables. Spearman correlation analyses were performed between continuous variables, including AFABP, gestational age, birth weight z score, maternal age, and BMI. We performed multivariate logistic regression analysis with SGA as an outcome variable including those variables with P < 0.1 in univariate analyses and demographic factors such as infant sex and multiple gestation. We used SPSS 22 (Chicago, IL) for statistical analysis.
Results
Patient characteristics
Among 361 newborn infants, 40 (11%) were SGA, 288 (80%) were AGA, and 33 (9%) were LGA infants. There were 217 full-term infants [median (interquartile range): 39.0 (38.3 to 39.9) weeks] and 144 preterm infants [34.0 (30.4 to 35.9) weeks]. Gestational age and birth weight were significantly lower in SGA compared with AGA and LGA groups (P < 0.001), and there were more infants from multiple gestation pregnancies in the SGA group compared with AGA and LGA groups (P < 0.001). Maternal characteristics such as age, race, and BMI were not significantly different between the groups. There was no significant difference in the maternal complications related to pregnancy, such as gestational diabetes and pre-eclampsia, between groups (Table 1).
Patient Characteristics
| SGA (n = 40) | AGA (n = 288) | LGA (n = 33) | P | |
|---|---|---|---|---|
| Newborn characteristics | ||||
| AFABP (ng/mL) | 31.5 (25.5, 47.5) | 39.1 (31.5, 45.0) | 45.0 (31.2, 62.3) | 0.07 |
| Gestational age (wk)a | 36.6 (35.1, 38.4) | 38.0 (34.9, 39.1) | 39.1 (38.7, 39.7) | <0.001 |
| Birth weight (kg)b | 2.3 (1.9, 2.6) | 3.1 (2.5, 3.5) | 4.3 (4.2, 4.5) | <0.001 |
| Birth weight z scoreb | −1.50 (−1.70, −1.41) | −0.01 (−0.51, 0.47) | 1.64 (1.49, 1.95) | <0.001 |
| Birth weight percentileb | 7 (4, 8) | 50 (31, 68) | 95 (93–97) | <0.001 |
| Cesarean section, n (%) | 34 (85.0%) | 195 (68.0%) | 24 (73.0%) | 0.21 |
| Multiple gestation, n (%) | 24 (60.0%) | 85 (29.0%) | 2 (6.0%) | <0.001 |
| Female sex, n (%) | 22 (55.0%) | 139 (48.3%) | 15 (45.5%) | 1.00 |
| 1-minute Apgar | 8 (7, 8) | 8 (7, 9) | 8 (8, 9) | 0.46 |
| 5-minute Apgar | 9 (8, 9) | 9 (9, 9) | 9 (9, 9) | 0.14 |
| Maternal characteristics | ||||
| Maternal age (y) | 34 (31, 37) | 33 (30, 36) | 35 (32, 37) | 0.14 |
| Maternal racec | (n = 38) | (n = 276) | (n = 31) | |
| White, n (%) | 21 (57.9%) | 172 (62.3%) | 21 (67.7%) | 0.70 |
| Non-white, n (%) | 16 (42.1%) | 104 (37.7%) | 10 (32.3%) | |
| Smoking (yes), n (%)c | 1 (3%) | 5 (2.3%) | 1 (3%) | 0.42 |
| (n = 35) | (n = 262) | (n = 30) | ||
| Primipara, n (%) | 24 (60.0%) | 113 (39.0%) | 5 (15%) | 0.07 |
| Maternal BMI (kg/m2)c | 23.5 (21.1, 27.5) | 24.0 (21.6, 28.5) | 26.8 (22.06, 33.4) | 0.07 |
| (n = 22) | (n = 224) | (n = 27) | ||
| Gestational hypertension/pre-eclampsia, n (%)c | 8 (21.0%) (n = 38) | 32 (11.3%) (n = 283) | 1 (3.1%) (n = 32) | 0.07 |
| Gestational diabetes, n (%)c | 3 (5.4) | 21 (9.5) | 3 (14.3) | 0.42 |
| (n = 56) | (n = 222) | (n = 21) | ||
| PROM >18 hours, n (%) | 3 (7.9%) (n = 38) | 19 (7.0%) (n = 273) | 1 (9.6%) (n = 31) | 0.92 |
Variables are presented with median (interquartile range), or n (%), P < 0.05 in bold, Kruskal–Wallis test (continuous variables), χ2, or Fisher’s exact test (categorical variables). Posthoc pairwise analysis was performed between two groups by Mann-Whitney U tests with Bonferroni correction (P < 0.017 was considered significant).
Abbreviation: PROM, premature rupture of membrane.
Significant difference between SGA and AGA and SGA and LGA groups.
Significant difference between all groups.
Data with missing values, n is presented.
Comparison of plasma AFABP levels between neonates and adults
Neonates had higher levels of circulating AFABP [38.2 (28.4 to 62.4) ng/mL] compared with adults [15.9 (10.7 to 23.3) ng/mL, P < 0.01; Fig. 1]. Compared with full-term infants [35.8 (25.1 to 51.5) ng/mL], preterm infants had higher levels of AFABP [48.2 (31.2 to 73.3) ng/mL; Fig. 1], and those of lower gestational ages had higher levels of AFABP (P = 0.03; Fig. 2). There was a statistically significant negative linear correlation between AFABP levels and gestational age in neonates (Spearman’s Rho coefficient r: −0.28; P < 0.001).
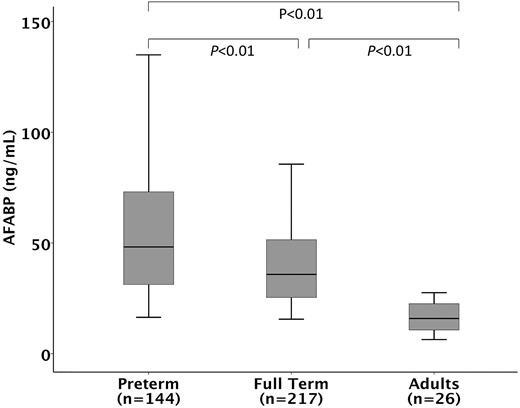
Cord blood AFABP levels in relation to gestational age. Kruskal–Wallis test reveals a significant difference in three groups: full-term neonates, preterm neonates, and adult (overall P < 0.01). Post hoc pairwise analysis with Bonferroni correction revealed significant difference between all three groups (P < 0.01). Bars represent median, boxes represent 25th and 75th percentile (interquartile range), and whiskers represent 95% confidence interval.
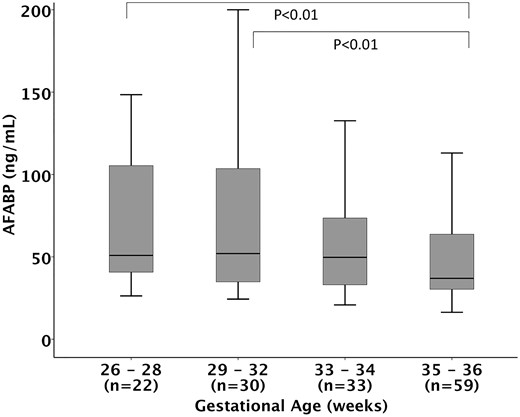
Cord blood AFABP levels in relation to gestational age groups in preterm infants. Kruskal–Wallis test reveals a significant overall difference in four groups (overall P = 0.028). Post hoc pairwise analysis with Bonferroni correction revealed significant difference between 29- to 32-week gestational age group and 35- to 36-week gestational age group (P < 0.01), and between the 33- to 34-week gestational age group and 35- to 36-week gestational age group (P < 0.01). There was no statistically significant difference between other groups. Bars represent median, boxes represent 25th and 75th percentile (interquartile range), and whiskers represent 95% confidence interval.
Comparison of plasma AFABP levels between SGA, AGA, and LGA infants
Median AFABP levels showed a trend to be lower in SGA infants [31.5 (25.2 to 47.5) ng/mL] compared with AGA [39.1 (31.5 to 45.0) ng/mL] and LGA [45.0 (31.2 to 62.3) ng/mL] groups for the entire population (P = 0.07; Table 1).
For the full-term population (n = 217), there was a statistically significant difference in the levels of AFABP between SGA, AGA, and LGA infants (P < 0.05; Fig. 3). The median levels of AFABP in SGA (n = 18), AGA (n = 168), and LGA (n = 31) infants were 28.6 (24.2 to 37.3) ng/mL, 36.1 (25.5 to 50.4) ng/mL, and 45.0 (24.6 to 62.34) ng/mL, respectively. Post hoc pairwise comparison revealed a significant difference between SGA and LGA groups (P = 0.016; Fig. 3), and there was a trend for lower AFABP in SGA infants compared with AGA infants (P = 0.05; Fig. 3).

Cord blood AFABP levels in relation to birth weight categories in full-term infants. Kruskal–Wallis test reveals a significant difference in three groups: SGA, AGA, and LGA (overall P < 0.05). Post hoc pairwise analysis revealed significant difference between SGA and LGA groups after Bonferroni correction (P = 0.016). Bars represent median, boxes represent 25th and 75th percentile (interquartile range), and whiskers represent 95% confidence interval.
Maternal pre-eclampsia and AFABP
Infants of mothers with gestational hypertension or pre-eclampsia had higher AFABP levels compared with those who were born from mothers without gestational hypertension or pre-eclampsia. The AFABP levels in cord blood from babies without maternal gestational hypertension/pre-eclampsia were 37.6 (27.7 to 56.7) ng/mL, and those with maternal gestational hypertension/pre-eclampsia were 55.9 (31.2 to 100.8) ng/mL (P = 0.006). This positive association between gestational hypertension/pre-eclampsia and cord blood AFABP levels remained significant even after controlling for gestational age and birth weight (P = 0.003).
There was no difference in cord blood AFABP levels between the neonates from primiparous women and those from multiparous women (P = 0.993), or singleton neonates versus neonates from multiple gestation (P = 0.685).
Correlation analysis between AFABP and gestational age, birth weight z score, maternal age, and BMI
In correlation analysis, we found a significant negative correlation between cord blood AFABP and gestational age at birth (r = −0.28, P < 0.001), and a positive linear correlation between cord blood AFABP levels and birth weight z score (r = 0.15, P < 0.01; Table 2). There was no significant correlation between AFABP levels and maternal age or BMI.
Correlation Analysis of AFABP, Gestational Age, Birth Weight z Score, Maternal Age, and BMI
| AFABP (ng/mL) | Gestational Age (wk) | Birth Weight z Score | Maternal Age (y) | Maternal BMI (kg/m2) | |
|---|---|---|---|---|---|
| Gestational age (wk) | r = −0.28 | 1 | |||
| P < 0.001 | |||||
| Birth weight z score | r = 0.15 | r = 0.25 | 1 | ||
| P < 0.01 | P < 0.001 | ||||
| Maternal age (y) | r = 0.02 | r = −0.16 | r = 0.07 | 1 | |
| P = 0.78 | P < 0.01 | P = 0.20 | |||
| Maternal BMI (kg/m2) | r = 0.36 | r = 0.10 | r = 0.16 | r = −0.01 | 1 |
| (n = 289) | P = 0.54 | P = 0.09 | P = 0.01 | P = 0.94 |
Multivariate logistic regression analysis for factors associated with SGA in full-term infants
In univariate logistic regression analysis, AFABP levels were associated with SGA status [odds ratio = 0.69 (95% confidence interval, 0.48 to 0.99), P = 0.045]. In multivariate logistic regression analysis (Table 3), we found that lower AFABP levels remained significantly associated with SGA status at birth after controlling for the following covariates: gestational age, infant sex, Cesarean section, multiple gestation, and maternal gestational hypertension/pre-eclampsia [odds ratio = 0.64 (95% confidence interval, 0.42 to 0.97), P = 0.03]. For every 10 ng/ml increment in cord blood AFABP levels, the odds of being SGA decreased by 36%.
Logistic Regression Analysis (Dependent Variable: SGA)
| Variables | β | SE | Adjusted OR (95% CI) | P |
|---|---|---|---|---|
| AFABP (/10 ng/mL) | −0.45 | 0.21 | 0.64 (0.42–0.97) | 0.03 |
| Gestational age (wk) | −0.28 | 0.31 | 0.76 (0.41–1.39) | 0.37 |
| Infant sex (female) | −0.09 | 0.54 | 0.91 (0.32–2.64) | 0.87 |
| Multiple gestation | 0.97 | 0.74 | 2.63 (0.62–11.23) | 0.19 |
| Mode of delivery (Cesarean section) | 0.81 | 0.69 | 2.04 (0.53–7.83) | 0.30 |
| Gestational hypertension/pre-eclampsia | 0.71 | 1.36 | 2.03 (0.14–29.42) | 0.60 |
Abbreviations: CI, confidence interval; OR, odds ratio; SE, standard error.
Additional analysis to evaluate the association of AFABP levels and LGA status did not reveal significant association between AFABP and LGA [adjusted odds ratio 1.03 (0.94 to 1.13), P = 0.48].
Discussion
Our cross-sectional study shows that cord blood AFABP levels are significantly higher in newborn infants compared with adults. Furthermore, circulating AFABP levels are negatively correlated with gestational age overall, and lower levels of AFABP are associated with SGA status in the full-term neonates. To our knowledge, there are no previous reports of AFABP levels in preterm and full-term newborn infants across the spectrum of gestational ages from 26 to 41 weeks, and of the association between SGA and cord blood AFABP.
Full-term SGA infants have a greater likelihood of developing metabolic disease compared with AGA or LGA infants (2). Moreover, higher circulating AFABP levels in adults positively correlate with metabolic disease. However, in this study, we found lower AFABP levels in SGA infants compared with AGA or LGA babies.
In studies in pediatric populations including Caucasian children and adolescents, and Korean male children, circulating levels of AFABP were significantly higher in obese study participants compared with normal (lean) controls (18–21). In a study by Reinehr et al. (18), percentage of fat mass was correlated with AFABP levels. These clinical studies are in accordance with preclinical studies that have identified adipocytes as the primary source of circulating AFABP (8). Collectively, these studies suggest that the most likely cause of low AFABP levels in SGA infants in our study population is reduced fat mass in this group of infants. Thus, the circulating AFABP levels during fetal development may simply reflect adipose tissue mass rather than to be a positive predictor of metabolic diseases. Future longitudinal cohort studies are needed to delineate potential associations between AFABP and metabolic syndrome in this population.
One previous study in a newborn population revealed that levels of AFABP in preterm infants were not statistically significantly different from full-term infants (22), but this study was based on a smaller sample size of 55 preterm infants with mean gestational age of 32.8 weeks and 23 full-term infants. Our finding of higher AFABP levels in preterm infants compared with full-term infants is most likely reflective of large portion of infants with gestational age <30 weeks in our study population (14% of preterm infants). Our study also had AFABP levels measured from 26 healthy adults. These results could potentially reflect high metabolic activity in fetal and newborn period compared with adults.
The same previous study also had a longitudinal component that revealed that cord blood AFABP levels positively correlated with weight gain from birth to hospital discharge in preterm infants. This suggests that AFABP may play a role in weight gain in the fetal period and immediate postnatal period.
Studies in adult populations show that high levels of circulating AFABP are associated with obesity, insulin resistance, metabolic syndrome, coronary artery disease, and cerebrovascular disease (9, 10, 13). In addition, longitudinal prospective adult cohort studies have revealed that plasma AFABP levels are positively correlated with development of type 2 diabetes and metabolic syndrome (10, 23). Several interventional studies have revealed that AFABP levels decrease after weight loss by interventions such as exercise, diet modification, and bariatric surgery (24–26). A prospective longitudinal cohort study in Korean boys aged 9 to 12 years revealed that AFABP levels are higher in obese compared with nonobese children, and higher for those who went on to develop metabolic syndrome in the next 3 years (21). Although this study did not report data on birth weight of the participants, the result suggests that AFABP levels in childhood and early life may have a predictive value for future onset metabolic complications.
Although several studies in pediatric and adult populations revealed that females have higher AFABP levels compared with males, and this is attributed to higher body fat in females (19, 27). In our study, AFABP levels were not significantly different between males and females in newborns (median 38.05 versus 39.04 ng/mL, P = 0.91) or in our adult cohort (median 12.99 versus 16.31 ng/mL, P = 0.47).
A study of AFABP in human milk revealed that AFABP is detectable in the first year of life, and the levels are higher in the beginning of lactation compared with levels at the first and the third postnatal months (28, 29). This study also revealed that the concentration of AFABP in human milk at 1 month was correlated with the body weight of the infant (28). Along with our data that the levels of AFABP are higher in neonates who are born at earlier gestational ages, this finding may suggest that AFABP could play a role in nutritional control and weight gain during the fetal and early postnatal periods.
The etiology of the association between low AFABP levels and SGA status in full-term neonates is yet to be determined, and may simply reflect lower amounts of fat tissue in SGA infants at birth rather than representing a causal relationship. The link between fetal nutritional deprivation, low birth weight, and later onset obesity is well described in both animal and human studies. In sheep studies, peroxisome proliferator-activated receptor γ, a marker of adiposity, is reported to be low in low birth weight animals and subsequently increases to high levels in an accelerated growth period (30). Human longitudinal birth cohort studies show an association between rapid weight gain during infancy and the development of obesity in later life (31, 32).
Animal studies have shown that AFABP (FABP4) knockout (33) and FABP4/5 double-knockout mice (34) have reduced lipolysis and increased lipogenesis. One previous study based on Danish longitudinal cohort showed that AFABP messenger RNA expression in preadipocytes from male adults born with low birth weight (<10th percentile) was significantly lower compared with the messenger RNA levels in those who were born with normal birth weight (35); however, this study did not have data on postnatal weight gain. Whether low AFABP in the circulation in SGA neonates would signal as a trigger for higher weight gain and deposition of fat tissue needs to be determined by further longitudinal assays of AFABP in the immediate postnatal period.
Our results show that infants born to mothers with gestational hypertension or pre-eclampsia have higher levels of AFABP compared with neonates born to mothers who were not affected by these conditions. Although there are no previous reports on the association of cord blood AFABP and maternal pre-eclampsia, this result is in agreement with two other previous studies in which maternal serum levels of AFABP are higher in women with pre-eclampsia (36, 37). Because previous studies have shown that maternal circulating AFABP levels do not directly correlate with AFABP levels in fetal circulation, and that cord blood reflects AFABP mostly from fetal tissue (38), this finding is unlikely to be related to placental transfer of AFABP. Further studies will be needed to determine whether elevated AFABP levels in infants born to mothers with gestational hypertension or pre-eclampsia represent a risk factor for development of metabolic syndrome or cardiovascular morbidities later in life.
A recent report showed that pregnant women with gestational diabetes had higher circulating levels of AFABP in the second and third trimester (39). In another study, infants of diabetic mothers had lower cord blood AFABP levels (38). In our study population, there was no difference between the cord blood levels of AFABP in infants born to mothers with gestational diabetes and those born to nondiabetic mothers. The prevalence of gestational diabetes mellitus in our cohort was not different among the three birth weight categories; we therefore concluded that maternal gestational diabetes mellitus status is not a significant factor affecting the association between SGA status and AFABP levels in our study population. However, given the relatively small numbers of infants of diabetic mothers in our study participants, this needs to be evaluated in larger case control studies.
There are several limitations to our study. Our study participants include a relatively high-risk population based in a tertiary medical center, which may limit the generalizability of our findings. We did not measure maternal plasma AFABP levels; thus, the maternal contribution to cord blood AFABP is not taken into consideration in our study. As a small molecular mass protein, AFABP could potentially cross the placenta, and thus, maternal conditions could affect the cord blood levels of AFABP. Although a previous study has not shown a correlation between maternal and cord blood AFABP levels (32), maternal AFABP levels were not measured in our study and thus could still be a confounding variable, which will need to be addressed in future studies. The majority of other maternal hormones that could affect metabolism of the fetus, such as insulin, glucagon, and growth hormone, do not cross the placenta; however, the individual nutrients such as lipids, glucose, and amino acids can cross the placenta either by diffusion or by active transport (40). Thus, the unknown effects of maternal nutritional status on AFABP cannot be evaluated in our study. Another important limitation of our study is that we do not have follow-up weight or height data in our cohort; thus, we cannot determine whether AFABP levels relate to weight gain during infancy and childhood.
Whether there is a causal relationship between AFABP and SGA status cannot be determined by this study, and further longitudinal cohort studies with data on future onset of obesity and metabolic complications are warranted to establish a potential causal relationship between AFABP levels and later cardiovascular and metabolic morbidities.
In summary, we found that cord blood AFABP levels are significantly higher in newborn infants compared with adults, and are negatively correlated with gestational age at birth. These findings suggest that plasma AFABP levels may be elevated as a result of increased metabolic rate in the fetus and newborn. In full-term infants, there was a significant difference in the levels of cord blood AFABP among SGA, AGA, and LGA infants, with SGA infants having significantly lower levels of AFABP independent of gestational age at birth, infant sex, multiple gestation, mode of delivery, and gestational hypertension/pre-eclampsia. This finding may represent the contribution of decreased fat tissue to plasma AFABP levels in SGA infants. In view of the significant alterations in AFABP levels in our newborn cohort, further longitudinal analysis is warranted to investigate whether AFABP levels in newborn infants are associated with the development of later metabolic morbidities.
Abbreviations:
- AFABP
adipocyte fatty acid–binding protein
- AGA
appropriate for gestational age
- BMI
body mass index
- LGA
large for gestational age
- SGA
small for gestational age.
Acknowledgments
We thank Marcia Filip, Yvonne Sheldon, Elena Arons, and Deirdre Greene for assistance with cord blood collection and processing, and Vanessa Gaines for data entry.
This work was supported by a Gerber Foundation Novice Research Award (to K.E.J.); a Biomedical Research Institute at Brigham and Women’s Hospital Stork Fund Award, and the William F. Milton Fund (to H.C.); Clinical Translational Science Award UL1RR025758 to Harvard University and Brigham and Women’s Hospital from the National Center for Research Resources; and Award K24DK081913 from the National Institutes of Health (to C.S.M.).
Author contributions: K.E.J. designed study, performed experiments and analysis, and drafted the manuscript. H.C. oversaw umbilical cord blood sample collection and processing and clinical data entry, contributed to study design, and edited the manuscript. S.U.C. contributed to the interpretation of data and the discussion. Z.M. contributed in cord blood sample collection and in data entry. C.S.M. conceptualized the study and supervised all steps, including laboratory measurement and analysis of data, and reviewed the final manuscript.
Disclosure Summary: The authors have nothing to disclose.
References
Author notes
Address all correspondence and requests for reprints to: Christos S. Mantzoros, MD, DSc, PhDhc, Professor of Internal Medicine/Endocrinology and Metabolism, Harvard Medical School, Feldberg 875, 330 Brookline Avenue, Beth Israel Deaconess Medical Center, Boston, Massachusetts 02215. E-mail: [email protected].
