


Abstract
Intrauterine growth patterns are influenced by maternal thyroid function during gestation and by fetal sex. It is unknown, however, whether the relationships between maternal thyrotropin (TSH) and free thyroxine (fT4) levels in early pregnancy and fetal growth outcomes are modified by fetal sex.
Data were obtained from a community-based cohort study of pregnant women living in Amsterdam (Amsterdam Born Children and Their Development study). TSH and fT4 levels were determined during the first prenatal screening at median 13 weeks (interquartile range, 12 to 14). Women with live-born singletons and no overt thyroid dysfunction were included (N = 3988). Associations between these maternal hormones and birth weight, small for gestational age (SGA), and large for gestational age (LGA) were analyzed separately for each sex.
After adjustments, 1 pmol/L increase in maternal fT4 levels was associated with a reduction in birth weight of 33.7 g (P < 0.001) in male newborns and 16.1 g (P < 0.05) in female newborns. Increased maternal fT4 was not associated with increased odds for SGA, but was associated with a decreased odds for LGA in boys [per 1 pmol/L; odds ratio (OR), 0.79; 95% confidence interval (CI), 0.69 to 0.90]. Maternal subclinical hypothyroidism in early pregnancy (TSH > 2.5 mU/L, 7.3%) was associated with increased odds for LGA in male newborns (OR, 1.95; 95% CI, 1.22 to 3.11).
Maternal fT4 in early pregnancy was observed to be inversely associated with birth weight, with a stronger relationship in males. Male infants also had increased odds for LGA in mothers with subclinical hypothyroidism. Sexual dimorphism appears to be present in the relationship between maternal thyroid metabolism and fetal intrauterine growth, with stronger associations in male infants.
Birth weight and intrauterine growth restriction (IUGR) are markers for fetal growth and development in utero, which can have lifelong effects on offspring health (1). Therefore, identification of factors that influence birth weight and IUGR are clinically relevant. One maternal factor that may impact these outcomes is thyroid function. Thyroid disorders are particularly common in women of reproductive age and, as such, are often encountered during pregnancy (2–4). Additionally, changes in thyroid hormone metabolism is a normal consequence of pregnancy due to increases in thyroid-binding globulins, as well as the thyrotropic effects of human chorionic gonadotropin and alterations in the expression of enzymes involved in thyroid metabolism (5, 6).
Both overt hyperthyroidism and hypothyroidism have been related to adverse pregnancy outcomes such as perinatal death and premature birth (2, 3, 5, 7). However, it is debated in the literature that subclinical abnormalities in thyroid hormones, particularly thyrotropin (TSH) and free thyroxine (fT4), may also contribute to disadvantaged pregnancy outcomes, including alterations in fetal growth (7–16). Women with subclinical hypothyroidism (SCH), represented by elevations in TSH with euthyroid fT4, are more likely to give birth to infants suffering IUGR and low birth weight (8). Additionally, women with normal TSH levels, but with fT4 levels <2.5th to 5th percentile (hypothyroxinemia) or >95th to 97.5th percentile (hyperthyroxinemia) also have babies with altered growth. In these cases, women with hypothyroxinemia have babies with higher birth weight and have an increased risk of macrosomia, whereas those with hyperthyroxemia have babies with lower birth weight (4, 13, 14). Finally, within women whose TSH and fT4 are both considered within a normal range, fT4 is inversely associated with birth weight and has been related to an increased risk of small for gestational age (SGA) infants (3, 8, 11). There remain, however, some inconsistencies in the literature (8, 17–19), thus warranting further investigation into this topic.
In addition to maternal thyroid function, fetal sex also impacts intrauterine growth. Male fetuses grow faster than female fetuses and are more likely to be macrosomic, whereas females are more likely to suffer IUGR (20, 21). However, the rapid growth of male fetuses means that exposure of their embryonic cells to maternal hormone abnormalities is greater than females, and thus disturbances in maternal thyroid metabolism may affect male fetuses to a greater extent (20). Additionally, the female placenta appears to be more resilient to insults than the male placenta, suggesting that maternal biological imbalances that affect fetal growth may affect male fetuses differentially (20). Currently, no literature exists regarding whether sex modifies the relationship between maternal thyroid profile and offspring birth weight and IUGR. Therefore, this study investigated whether maternal thyroid hormone status, within euthyrotic ranges, was associated with birth weight and intrauterine growth patterns and whether this association was modified by fetal sex.
Methods
Subjects
Data were obtained from the Amsterdam Born Children and Their Development (ABCD) Study, a prospective cohort study of pregnant women (22). All pregnant women living in the city of Amsterdam were invited to participate at their first prenatal screening between January 2003 and March 2004. Of 12,377 pregnant women invited, 8266 women agreed to participate (response rate, 67%). These women received a pregnancy questionnaire at their home address 2 weeks after their first antenatal visit. The questionnaire contained questions about demographics, health, medication, and lifestyle factors. Additionally, 4389 women provided informed consent for blood collection during their first visit. This collection was completed, on average, during the median 13th week of gestation [interquartile range (IQR), 12 to 14]. TSH and fT4 measurements were available for 4204 participants. From this starting cohort we excluded 64 women in whom blood sampling occurred after the 27th week of pregnancy (third trimester). Of the remaining, we excluded 60 women who gave birth to twins and 57 cases of perinatal death. We also excluded 32 women who used thyroid-modifying medication (16). Of the 3996 women who remained in the study, we excluded eight from which fetal sex was unknown, leaving 3988 women for analysis (Fig. 1). The study protocol was approved by the Medical Ethical Committees of all Amsterdam hospitals and the Registration Committee of Amsterdam, and all participants provided written, informed consent.
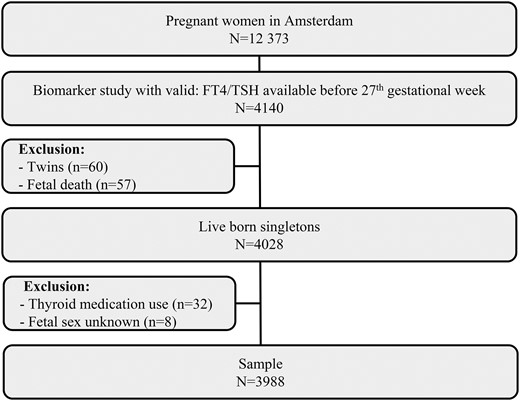
Schematic presentation of the study with all exclusion criteria.
Baseline characteristics
Information on demographic, medical history, medication, and lifestyle characteristics were obtained from the pregnancy questionnaire. Smoking status during pregnancy, parity, age, maternal height, education level, ethnicity, and prepregnancy body mass index (pBMI) were determined from this self-reported information. Smoking was dichotomized into yes or no and parity into primiparous and multiparous. Ethnicity was based on the country of birth of the pregnant women and categorized into: Dutch, Surinamese, Turkish, Moroccan, and other. Educational attainment was based on the years of education after primary school, and pBMI was based on the length and weight of the mother before pregnancy. Missing values on maternal height (3.4%) and weight (9.5%) were imputed by means of a random imputation method using linear regression (23). Alcohol use during pregnancy was not included in the analysis due to the very low levels of alcohol use among the pregnant women in our study population.
Hypertension (none, preexistent, or gestational hypertension) and diabetes mellitus (none, preexistent, or gestational diabetes) were based on self-reported information from the questionnaire and supplemented with information from the national perinatal registry, where data were gathered by a trained health care provider (24). This registry was linked to the ABCD Study by probabilistic record linkage (25, 26). Validation has shown close to perfect results for these variables (25).
Assays
Serum TSH, fT4, and antibodies against thyroid peroxidase (TPO-Abs) were assayed. TSH (reference range, 0.34 to 5.60 mU/L) and fT4 concentration (reference range, 7.5 to 21.1 pmol/L) were measured using an Access Immunoanalyzer (Beckman Coulter Inc., Fullerton, CA). The interassay variation for TSH was 5.0% and 3.1 to 5.0% for fT4. TPO-Abs were determined by enzyme-linked immunosorbent assay ELIZEN TG Ab (E-CK-96; ZenTech, Luik, Belgium). A TPO-Ab concentration of >80 kU/L was considered positive. The interassay variation was 13.4%.
Outcomes
The primary outcome was neonatal birth weight (in grams) of live-born, full-term neonates (gestational duration ≥ 37 weeks). Information on birth weight, gestational age, and fetal sex were obtained from the Youth Health Care Registration of Amsterdam’s Municipal Health Services. The gestational duration (in weeks and days) was based on ultrasound or, when not available (<10% of ABCD cohort), on the first day of the last menstrual period, which was calculated by the obstetric care provider.
Additional outcomes of interest were delivery of either an SGA or large for gestational age (LGA) infant. SGA was defined as a birth weight for gestational age <10th percentile and LGA as birth weight for gestational age >90th percentile on the basis of sex and parity-specific standards from a Dutch population (27).
Statistical analysis
The blood samples were not taken at the same gestational age for all women. Because thyroid function physiologically changes during the course of gestation (28), we standardized the values for fT4 and TSH to the median gestational age (91 days) at blood sampling. In our population, the fT4 values slightly linearly increased with 0.029 pmol/L per gestational day, and TSH decreased with 0.004 mU/L per gestational day. fT4 and TSH levels were analyzed both as continuous variables and also divided into quintiles for comparison with the previous literature and to determine possible nonlinear relationships. Women were also categorized as having SCH (TSH > 2.5 mU/L) or a healthy thyroid state (19). A descriptive analysis of mean fT4 and TSH levels for all maternal and infant covariates was performed by using analysis of variance.
Multiple regression models were built to explore the relationship between either TSH or fT4 levels and neonatal birth weight. The first model (model 1) included pregnancy duration and the quadratic form of pregnancy duration to account for the nonlinear relationship between pregnancy duration and birth weight. In the second model (model 2) we adjusted for physiological covariates (maternal age, maternal height, parity), environmental covariates (education level, smoking during pregnancy, pBMI), and medical history covariates (diabetes mellitus, hypertension, positive TPO-Abs). Logistic regression analyses were performed with the same hierarchical models to estimate the relationship between either fT4 or TSH level as the determinant and either SGA or LGA as the outcome. Analyses were conducted separately for boys and girls to investigate sex differences. Additionally, unstratified analyses were completed to allow testing for interaction with sex. Interaction was tested by comparing a model that included an interaction term for sex with a model that only included sex as a covariate. These models were compared using the likelihood ratio test. If the model with an interaction term differed significantly from the model without interaction, the Akaike Information Criterion values of both models were compared to see which model fit the relationship better.
Finally, nonlinearity was formally investigated using restricted cubic spline modeling. Models were investigated for significant deviations from linearity using analysis of variance, and the best fitting model was determined using the likelihood ratio test and Akaike Information Criterion values. No significant deviations from linearity were observed in the unstratified analysis.
All statistical analyses were performed using SPSS version 15.0 and the statistical package R 2.13.1. P values of <0.05 were considered statistically significant.
Results
The mean maternal age of the study sample was 31.0 years [standard deviation (SD), 4.8], and 58% of the women were nulliparous. Median TSH and fT4 levels were 1.15 mU/L (IQR, 0.75 to 1.68) and 9.58 pmol/L (IQR, 8.81 to 10.38), respectively. Of our study sample, 5.7% of women were TPO-Ab+. Delivery took place at a mean of 39.4 weeks, and mean birth weight was 3454 g (SD, 565.0).
Lower standardized maternal fT4 levels were observed in women who smoked during pregnancy, were positive for TPO-Abs, had higher pBMIs, suffered from gestational hypertension or diabetes, or had lower education levels (Table 1). Lower TSH levels were present in women <25 and >35 years of age, as well as in women who were multiparous, had lower levels of education, and were from Surinamese, Moroccan, or other ethnic backgrounds. Women who tested positive for TPO-Abs had significantly higher TSH levels (Table 1).
Mean Maternal fT4 and TSH Levels During Early Pregnancy as a Function of Maternal Demographic Characteristics (N = 3988)
| n (%) | fT4 (pmol/L) | TSH (mU/L) | |||
|---|---|---|---|---|---|
| Mean | SD | Mean | SD | ||
| Maternal age, y | |||||
| <25 | 446 (11.2) | 9.87b | 1.35 | 1.20b | 0.85 |
| 25–34.9 (reference) | 2907 (72.9) | 9.67 | 1.28 | 1.36 | 1.02 |
| >35 | 635 (15.9) | 9.61 | 1.61 | 1.27a | 0.84 |
| pBMI, kg/m2 | |||||
| <18.5 | 776 (19.5) | 9.84a | 1.34 | 1.32 | 0.95 |
| 18.5–24.9 (reference) | 2382 (59.7) | 9.72 | 1.33 | 1.35 | 1.01 |
| 25–29.9 | 627 (15.7) | 9.45c | 1.37 | 1.26a | 0.87 |
| ≥30 | 203 (5.1) | 9.34c | 1.33 | 1.28 | 0.82 |
| Education, y | |||||
| <5 | 683 (17.1) | 9.63a | 1.44 | 1.23b | 1.00 |
| 5–9 | 1534 (38.5) | 9.63a | 1.40 | 1.31 | 0.96 |
| ≥10 (reference) | 1742 (44.0) | 9.75 | 1.26 | 1.37 | 0.98 |
| Ethnicity | |||||
| Dutch (reference) | 2768 (69.4) | 9.65 | 1.29 | 1.37 | 1.01 |
| Surinamese | 180 (4.5) | 9.55 | 1.22 | 1.09c | 0.91 |
| Turkish | 123 (3.1) | 9.74 | 1.47 | 1.24 | 0.91 |
| Moroccan | 203 (5.1) | 9.78 | 1.64 | 1.11c | 0.86 |
| Other | 714 (17.9) | 9.78a | 1.48 | 1.27b | 0.86 |
| Smoking during pregnancy | |||||
| No | 3620 (90.8) | 9.72 | 1.35 | 1.33 | 0.99 |
| Yes | 368 (9.2) | 9.30c | 1.24 | 1.24 | 0.82 |
| Parity | |||||
| 0 | 2295 (57.5) | 9.68 | 1.32 | 1.37 | 0.96 |
| ≥1 | 1693 (42.5) | 9.68 | 1.39 | 1.27b | 0.99 |
| Infant sex | |||||
| Male | 1947 (48.8) | 9.69 | 1.40 | 1.34 | 0.92 |
| Female | 2041 (51.2) | 9.67 | 1.29 | 1.31 | 1.03 |
| Pregnancy duration, weeks | |||||
| 24–37 | 202 (5.1) | 9.54 | 1.27 | 1.28 | 0.75 |
| 37–40 (reference) | 2732 (68.5) | 9.68 | 1.35 | 1.32 | 0.95 |
| 41–43 | 1054 (26.4) | 9.72 | 1.26 | 1.35 | 1.07 |
| Anti-TPO positivity | |||||
| No | 3760 (94.3) | 9.71 | 1.33 | 1.25 | 0.80 |
| Yes | 228 (5.7) | 9.23c | 1.48 | 2.53c | 2.13 |
| Hypertension | |||||
| None (reference) | 3519 (88.3) | 9.70 | 1.33 | 1.32 | 0.98 |
| Pregnancy induced | 332 (8.3) | 9.52a | 1.25 | 1.38 | 0.99 |
| Preexistent | 137 (3.4) | 9.57 | 1.91 | 1.28 | 0.81 |
| Diabetes | |||||
| None (reference) | 3956 (99.2) | 9.68 | 1.35 | 1.32 | 0.98 |
| Pregnancy induced | 17 (0.4) | 8.71b | 1.26 | 1.34 | 0.59 |
| Preexistent | 15 (0.4) | 9.79 | 0.54 | 1.60 | 0.92 |
P < 0.05.
P < 0.01.
P < 0.001.
Birth weight
We observed a negative linear relationship between maternal fT4 values and birth weight (Supplemental Fig. 1). In model 1 (corrected for gestational age and duration of pregnancy), the birth weight decreased by 35.8 g [95% confidence interval (CI), 50.2 to −21.4] in boys and by 17.6 g (95% CI, −32.3 to −2.9) in girls for every unit increase of fT4 levels. After complete adjustment, this relationship remained significant [boys regression coefficient (β), −33.7, 95% CI, −47.3 to −20.0; girls β, −16.1, 95% CI, −30.2 to −2.0; Table 2]. In the unstratified analysis, there was a trend toward interaction with sex (P = 0.10). In the analysis of fT4 in quintiles, women with the highest fT4 levels (quintile 5) gave birth to boys with significantly lower birth weight than did mothers in the lowest quintile (quintile 1) (mean estimated difference, −118.3; 95% CI, −179.1 to −57.5). This association was not found in girls (Table 2). Maternal TSH levels were not associated with an increase in birth weight in either sex (Table 2).
Univariate and Multivariate Associations Between Maternal fT4 and TSH and Infant Birth Weight, Stratified by Fetal Sex
| Boys | Girls | |||||
|---|---|---|---|---|---|---|
| Mean (SD) | β (95% CI) | Mean (SD) | β (95% CI) | |||
| Model 1 | Model 2 | Model 1 | Model 2 | |||
| Free T4 continuous, pmol/L | 9.69 (1.40) | −35.8 (−50.2 to −21.4)b | −33.7 (−47.3 to −20.0)b | 9.67 (1.29) | −17.6 (−32.3 to −2.9)a | −16.1 (-30.2 to -2.0)a |
| Free T4 quintiles | ||||||
| Q1 | 8.06 (0.46) | Reference | Reference | 8.04 (0.47) | Reference | Reference |
| Q2 | 8.96 (0.19) | −32.2 (−96.3 to 31.9) | −34.9 (−95.1 to 25.3) | 8.97 (0.19) | 6.4 (−53.8 to 66.6) | 12.6 (−44.6 to 69.8) |
| Q3 | 9.57 (0.16) | −10.8 (−75.3 to 53.7) | −22.5 (−83.2 to 38.3) | 9.57 (0.17) | −8.1 (−67.7 to 51.4) | −4.4 (−66.9 to 47.1) |
| Q4 | 10.20 (0.21) | −74.6 (−139.6 to −9.5)a | −54.4 (−115.9 to 7.0) | 10.22 (0.21) | −49.2 (−108.6 to 10.2) | −40.7 (−104.6 to 9.1) |
| Q5 | 11.63 (1.48) | −122.6 (−186.6 to −58.6)b | −118.3 (−179.1 to −57.5)b | 11.55 (1.06) | −49.7 (−109.7 to 10.3) | −39.1 (−97.0 to 18.6) |
| TSH continuous, mU/L | 1.34 (0.92) | 23.0 (0.9 to 45.1)a | 15.1 (−6.7 to 37.0) | 1.31 (1.03) | 12.0 (-6.6 to 30.5) | 3.7 (−14.9 to 22.2) |
| TSH quintiles | ||||||
| Q1 | 0.40 (0.18) | Reference | Reference | 0.39 (0.19) | Reference | Reference |
| Q2 | 0.83 (0.10) | −34.4 (−100.3 to 31.5) | −32.1 (−93.8 to 29.5) | 0.82 (0.10) | −9.3 (−68.8 to 50.1) | −13.9 (−70.4 to 42.6) |
| Q3 | 1.15 (0.10) | −5.4 (−72.1 to 61.4) | −21.8 (−84.2 to 40.6) | 1.15 (0.10) | 38.8 (−20.1 to 97.8) | 16.0 (−40.0 to 72.1) |
| Q4 | 1.56 (0.14) | 19.6 (−47.1 to 86.4) | −7.0 (−69.6 to 55.6) | 1.55 (0.14) | 9.08 (−50.1 to 68.3) | −0.7 (−57.3 to 56.0) |
| Q5 | 2.61 (0.90) | 32.7 (−33.2 to 98.6) | 6.6 (−56.1 to 69.3) | 2.77 (1.42) | 54.6 (−5.1 to 114.2) | 33.1 (−25.0 to 91.2) |
Model 1 was adjusted for gestational age at blood sampling and duration of pregnancy (linear and quadratic term). Model 2 was adjusted for model 1 plus maternal height, parity, ethnicity, educational level, smoking, pBMI, diabetes, hypertension, and anti-TPO positivity.
P < 0.05.
P < 0.001.
SGA and LGA
Neither maternal fT4 nor TSH levels were associated with delivery of an SGA infant in either sex (Table 3). However, a 1 U increase in fT4 was associated with decreased odds for delivery of a LGA infant in boys, which remained unaltered after adjustment (OR, 0.79; 95% CI, 0.69 to 0.90) (Table 4). There was a trend toward interaction with sex in the relationship between fT4 and LGA (P = 0.12). Women with the highest fT4 levels (quartile 5) had a significantly lower odds of having an LGA male baby, compared with the lowest quintile (OR, 0.38; 95% CI, 0.22 to 0.63). A similar relationship was not observed in girls. In the unadjusted models, there were increased odds for LGA in boys exposed to higher maternal TSH levels and a trend for increased odds of LGA in girls exposed to higher maternal TSH levels. Correction for confounding rendered these associations nonsignificant (Table 4).
Univariate and Multivariate Associations Between Maternal fT4 and TSH and Odds of SGA Infant, Stratified by Fetal Sex
| Boys | Girls | |||||
|---|---|---|---|---|---|---|
| % SGA | OR (95% CI) | % SGA | OR (95% CI) | |||
| Model 1 | Model 2 | Model 1 | Model 2 | |||
| Free T4 continuous, pmol/L | 9.6 | 1.12 (1.00–1.22) | 1.12 (0.99–1.22) | 9.2 | 1.09 (0.97–1.22) | 1.12 (0.99–1.26) |
| Free T4 quintiles | ||||||
| Q1 | 8.4 | Reference | Reference | 8.3 | Reference | Reference |
| Q2 | 10.9 | 1.33 (0.82–2.15) | 1.44 (0.88–2.38) | 7.1 | 0.84 (0.50–1.42) | 0.93 (0.55–1.59) |
| Q3 | 8.0 | 0.95 (0.57–1.60) | 1.01 (0.59–1.73) | 9.0 | 1.05 (0.65–1.72) | 1.26 (0.76–2.10) |
| Q4 | 10.2 | 1.23 (0.75–2.02) | 1.23 (0.73–2.06) | 9.6 | 1.16 (0.72–1.87) | 1.37 (0.83–2.26) |
| Q5 | 10.3 | 1.26 (0.78–2.05) | 1.37 (0.82–2.27) | 11.5 | 1.43 (0.89–2.27) | 1.63 (0.99–2.67) |
| TSH continuous, mU/L | 9.6 | 0.92 (0.77–1.11) | 1.04 (0.86–1.26) | 9.2 | 0.95 (0.81–1.12) | 1.03 (0.88–1.21) |
| TSH quintiles | ||||||
| Q1 | 8.8 | Reference | Reference | 8.9 | Reference | Reference |
| Q2 | 10.5 | 1.21 (0.74–1.97) | 1.22 (0.74–2.03) | 10.3 | 1.17 (0.74–1.87) | 1.34 (0.83–2.17) |
| Q3 | 9.6 | 1.08 (0.65–1.79) | 1.26 (0.75–2.12) | 8.2 | 0.91 (0.56–1.48) | 1.11 (0.67–1.83) |
| Q4 | 10.3 | 1.19 (0.72–1.96) | 1.43 (0.86–2.40) | 9.6 | 1.05 (0.66–1.68) | 1.31 (0.80–2.15) |
| Q5 | 8.6 | 0.96 (0.58–1.60) | 1.24 (0.73–2.11) | 9.1 | 1.03 (0.64–1.65) | 1.39 (0.84–2.31) |
Model 1 was adjusted for gestational age at blood sampling. Model 2 was adjusted for model 1 plus maternal height, ethnicity, educational level, smoking, pBMI, diabetes, hypertension, and anti-TPO positivity. No significant differences were found.
Univariate and Multivariate Associations Between Maternal fT4 and TSH and Odds of LGA Infant, Stratified by Fetal Sex
| Boys | Girls | |||||
|---|---|---|---|---|---|---|
| % LGA | OR (95% CI) | % LGA | OR (95% CI) | |||
| Model 1 | Model 2 | Model 1 | Model 2 | |||
| Free T4 continuous, pmol/L | 10.6 | 0.81 (0.71–0.91)b | 0.79 (0.69–0.90)b | 8.4 | 0.93 (0.82–1.05) | 0.95 (0.84–1.09) |
| Free T4 quintiles | ||||||
| Q1 | 14.4 | Reference | Reference | 7.8 | Reference | Reference |
| Q2 | 11.9 | 0.80 (0.53–1.21) | 0.72 (0.46–1.12) | 10.6 | 1.41 (0.87–2.28) | 1.50 (0.91–2.47) |
| Q3 | 11.1 | 0.73 (0.47–1.11) | 0.66 (0.42–1.04) | 8.7 | 1.13 (0.68–1.85) | 1.20 (0.72; 2.01) |
| Q4 | 9.1 | 0.59 (0.38–0.93)a | 0.59 (0.36–0.94)a | 7.4 | 0.94 (0.56–1.57) | 0.99 (0.58; 1.70) |
| Q5 | 6.5 | 0.42 (0.26–0.68)b | 0.38 (0.22–0.63)b | 7.5 | 0.95 (0.57–1.60) | 1.09 (0.63–1.86) |
| TSH continuous, mU/L | 10.6 | 1.13 (0.98–1.37)a | 1.09 (0.93–1.27) | 8.4 | 1.07 (0.93–1.22) | 1.01 (0.86–1.18) |
| TSH quintiles | ||||||
| Q1 | 8.8 | Reference | Reference | 5.9 | Reference | Reference |
| Q2 | 8.5 | 0.96 (0.58–1.60) | 0.98 (0.58–1.67) | 8.7 | 1.52 (0.90–2.58) | 1.49 (0.87–2.55) |
| Q3 | 12.7 | 1.48 (0.92–2.40) | 1.38 (0.84–2.28) | 7.7 | 1.32 (0.77–2.26) | 1.20 (0.69–2.07) |
| Q4 | 11.1 | 1.26 (0.77–2.06) | 1.15 (0.69–1.93) | 9.3 | 1.63 (0.97–2.74) | 1.46 (0.85–2.48) |
| Q5 | 11.7 | 1.36 (0.84–2.21) | 1.16 (0.70–1.92) | 10.9 | 1.94 (1.17–3.24)a | 1.65 (0.97–2.81) |
Model 1 was adjusted for gestational age at blood sampling. Model 2 was adjusted for model 1 plus maternal height, ethnicity, educational level, smoking, pBMI, diabetes, hypertension, and anti-TPO positivity.
P < 0.05.
P < 0.001.
SCH was present in 293 (7.3%) of the women. Results showed that male infants whose mothers had SCH had increased odds for LGA and had significantly higher birth weights, compared with infants from mothers without SCH (Table 5). Similar relationships were not observed in female infants. A trend toward interaction with sex was observed in the relationship between maternal SCH and infant birth weight (P = 0.15), whereas interaction was not observed in the relationship with LGA (P = 0.33).
Analysis of Birth Outcomes in Infants Exposed to Maternal subclinical Hypothyroidism (TSH > 2.5 mU/L; n = 293), Stratified by Fetal Sex
| Boys | Girls | |||||
|---|---|---|---|---|---|---|
| Model 1 | Model 2 | Model 1 | Model 2 | |||
| TSH > 2.5 mU/L | Birth weight, g | β (95% CI) | β (95% CI) | Birth weight, g | β (95% CI) | β (95% CI) |
| No | Reference | Reference | Reference | Reference | ||
| Yes | 90.8 (10.7–170.9)a | 85.1 (7.6–162.7)a | 13.5 (−58.0 to 85.0) | 2.0 (−68.8 to 72.8) | ||
| TSH > 2.5 mU/L | SGA (%) | OR (95% CI) | OR (95% CI) | SGA (%) | OR (95% CI) | OR (95% CI) |
| No | 9.7 | Reference | Reference | 9.4 | Reference | Reference |
| Yes | 8.1 | 0.83 (0.44–1.57) | 1.03 (0.53–2.02) | 6.5 | 0.67 (0.35–1.30) | 0.73 (0.37–1.45) |
| LGA (%) | LGA (%) | |||||
| No | 10.1 | Reference | Reference | 8.3 | Reference | Reference |
| Yes | 17.8 | 1.95 (1.22–3.11)b | 1.95 (1.16–3.27)a | 10.3 | 1.28 (0.74–2.20) | 1.14 (0.63–2.06) |
Model 1 was adjusted for gestational age at blood sampling. Model 2 was adjusted for model 1 plus maternal height, ethnicity, educational level, smoking, pBMI, diabetes, hypertension, and anti-TPO positivity.
P < 0.05.
P < 0.01.
Discussion
In this study, we observed a significant inverse relationship between maternal fT4 in the first term of pregnancy and offspring’s birth weight regardless of sex, with a stronger relationship in male newborns. Additionally for male infants, maternal SCH in the first term of pregnancy was found to increase the odds for LGA and was positively associated with increased birth weight, whereas increasing maternal fT4 was associated with lower odds of LGA in male infants.
In line with our observations, various studies have shown a comparable association between abnormal thyroid status and alterations in fetal growth patterns (2, 5, 7–15). Women without a clinically overt hypothyroidism, but who have either SCH or hypothyroxinemia, appear to give birth to babies with altered birth size and birth weight. One study showed that babies born to mothers with hypothyroxinemia appear to be at increased risk for SGA (15), and two other studies showed these babies had higher birth weights than did babies with euthyroid mothers and were more likely to be macrosomic (>4000 g) (13, 14). Screening and intervention of SCH in a randomized study in China revealed reduced risk of fetal macrosomia compared with standard care (4). Finally, Casey et al. (17) observed no relationship between hypothyroxinemia and birth weight–related outcomes.
The impact of maternal SCH and hypothyroxinemia (low fT4) on fetal growth and birth weight is not consistent. Some studies have not observed any relationships between SCH and birth weight–related outcomes (14, 18), whereas Chen et al. (9) observed increased risks for IUGR and low birth weight infants born to women with SCH. Su et al. (15) observed that infants exposed to maternal SCH had smaller heads and shorter birth lengths. We did observe an inverse relationship for hypothyroxinemia and birth weight, but in maternal SCH, we only observed an increased risk for LGA male infants, with no relationship in female infants. In our study, it appears that male fetuses suffer more from exposure to fT4 elevations. The mechanism behind this is not easy to explain with the current knowledge. Male fetuses are known to grow faster than females (20); perhaps the more rapidly dividing male cells are exposed to more maternal fT4 early in development, with later influence on final size attainment. Our observations should be considered as hypothesis generating, and future (randomized intervention) studies will be needed to evaluate whether our observed fetal sex-related differences will display serious clinical impact.
What is more consistent from the current literature is that elevations in fT4 in otherwise euthyroid women contribute to smaller birth weight. Haddow et al. (10) showed that euthyroid women with fT4 in the highest quintile gave birth to children with a lower birth weight, but without a negative effect on birth outcome. The Generation R study showed that higher maternal fT4 in euthyroid pregnancies was also associated with lower birth weight and an increased risk of SGA newborns (3, 11). Another recent study provided insight into the direct toxic effects of excessive thyroid hormone during pregnancy. In mothers who had genetic thyroid hormone resistance due to a mutation in the thyroid receptor, high levels of thyroid hormones were observed during pregnancy. The infants born to these women who did not have the thyroid receptor mutations had significantly lower birth weights, whereas infants with the receptor mutation had normal birth weight (29). These results suggest a direct effect of thyroid hormones on intrauterine development, and this is in line with the recent public attention by the World Health Organization for supplemented use of iodine in pregnancy and lactation (30). Indeed, a prior study by Rydbeck et al. (31) reported a sex-specific growth pattern when maternal urinary iodine concentration was <1 mg/L. However, this significant association with maternal urinary iodine concentration for fetal growth was only found in male fetuses, as we did in our study. These authors could not explain this sex-specific growth difference. In recent European studies, a maternal iodine insufficient state is frequently observed during both pregnancy and lactation, negatively affecting the maternal thyroid state by decreasing T4 release and subsequently increasing TSH levels as iodine deficiency worsens (32). The availability of sufficient iodine is therefore an important factor, and this could be one of the explanations in our cohort. However, we did not measure maternal urinary iodine concentration; however, in a similar Dutch cohort the prevalence of iodine deficiency is reported as being 12.3% of their total population (33).
This study was limited by some of the measurements used. In all literature regarding maternal thyroid metabolism during pregnancy, there is concern about the validity of assays used for the analysis of fT4 and TSH. Unfortunately, the large sample size analyzed in this study did not permit us to use more laborious and extensive techniques. However, a recent analysis showed strong similarities between the most commonly used analytical methods and reference levels in early pregnancy (34). Another limitation of this study is that there was no opportunity to investigate associations with free triiodothyronine, the principal bioactive thyroid hormone, because this was not measured in the ABCD study cohort. Therefore, we cannot investigate whether there were any T3–T4 conversion effects. In future studies, we will aim to also analyze the relationships between free triiodothyronine and fetal growth.
This study benefited from a large sample size, allowing for stratified analysis of outcomes by sex. This study also investigated a multiethnic population, allowing for generalizability to a wider population.
Conclusion
Early maternal fT4 levels in euthyroid women are inversely associated with birth weight, for both female and male newborns. The relationship is stronger in male infants. Maternal subclinical hypothyroidism appears to increase the odds for LGA in male newborns, although additional research is necessary to confirm these findings. Our observations suggest dimorphism between sex in fetal intrauterine growth may be partially dependent on maternal thyroid metabolism in early pregnancy.
Abbreviations:
- Ab
antibody
- ABCD Study
Amsterdam Born Children and Their Development Study
- CI
confidence interval
- fT4
free thyroxine
- IQR
interquartile range
- IUGR
intrauterine growth restriction
- LGA
large for gestational age
- OR
odds ratio
- pBMI
prepregnancy body mass index
- SCH
subclinical hypothyroidism
- SD
standard deviation
- SGA
small for gestational age
- TPO
thyroid peroxidase
- TPO-Ab
antibody against thyroid peroxidase
- TSH
thyrotropin
- β
regression coefficient
Acknowledgments
We thank the women who participated in the ABCD Study. We also thank all the midwifery practices and hospitals in Amsterdam, The Netherlands, for their assistance with data collection and extraction.
This work was supported by Netherlands Organization for Health Research and Development Grant (TOP) 40-00812-98-11010, but it had no role in the research conducted.
Disclosure Summary: The authors have nothing to disclose.
References
World Health Organization. Iodine supplementation in pregnant and lactating women. Avaliable at: http://www.who.int/elena/titles/iodine_pregnancy/en/. Accessed 31 August 2016.
Author notes
Address all correspondence and requests for reprints to: Tanja G.M. Vrijkotte, PhD, Department of Public Health, Academic Medical Center/University of Amsterdam, PO Box 22660, 1100 DD Amsterdam, The Netherlands. E-mail: [email protected]
