


Abstract
Elevated levels of the phosphate-regulating hormone, fibroblast growth factor-23 (FGF-23) are associated with skeletal and cardiovascular disease. Levels of FGF-23 are elevated in neonates, but the mechanisms are poorly understood. Iron deficiency is a recently described stimulus for FGF-23 production.
To test the hypothesis that lower fetal iron status, as measured by lower cord blood ferritin, is independently associated with elevated FGF-23 levels in neonates.
This is a cross-sectional study of 64 full-term, healthy neonates.
This study took place in a university-based, tertiary care center.
Plasma levels of second generation C-terminal FGF-23 (cFGF-23) and intact FGF-23 (iFGF-23).
Levels of cFGF-23 ranged from 108 to 7508 reference units (RU)/ml (median, 824 RU/ml), and iFGF-23 from undetectable (<8.5) to 135.4 pg/ml (median, <8.5 pg/mL). Ferritin ranged from 58 to 719 ng/ml (mean, 203 ng/ml). Lower cord blood ferritin levels were associated with higher cFGF-23 (r = −0.320; P = .014), but not iFGF-23 levels (r = −0.222; P = .082). In multivariate analyses adjusted for glycemic indices, maternal race, and parity, lower ferritin levels remained independently associated with higher cFGF-23 levels (B = −0.261, P = .01). In the full models, higher cord blood glucose and C-peptide levels were also independently associated with higher cFGF-23 levels.
cFGF-23, but not iFGF-23 levels, are elevated in cord blood of healthy term neonates and independently associated with lower serum ferritin and higher glycemic indices.
Fibroblast growth factor-23 (FGF-23) is an endocrine hormone that is made in osteocytes and regulates phosphate homeostasis (1). High dietary phosphate intake increases levels of FGF-23, which stimulates urinary phosphate excretion by decreasing the abundance and activity of Na-Pi cotransporters in the apical membrane of the renal proximal tubule (2). FGF-23 also decreases gut absorption of phosphate indirectly by lowering levels of calcitriol, the active form of vitamin D that is made in the kidney (3, 4). Despite clear understanding of FGF-23 effects on the kidney, regulation of its secretion from bone is incompletely understood (5).
There are at least two distinct steps in FGF-23 regulation within osteocytes: FGF-23 transcription and cleavage of newly synthesized FGF-23 protein (6). Iron deficiency is a novel stimulus of FGF-23 transcription (6). In healthy mature osteocytes, increased FGF-23 production in response to iron deficiency is coupled to commensurate increases in intracellular cleavage of FGF-23 protein. This maintains normal levels of biologically active FGF-23 that can be detected by intact FGF-23 assays (iFGF-23) (7, 8), but leaves behind evidence of increased FGF-23 production and cleavage in the form of high circulating concentrations of FGF-23 fragments that can be detected with C-terminal FGF-23 assays (cFGF-23).
In autosomal dominant hypophosphatemic rickets (ADHR), mutant FGF-23 is resistant to cleavage, which precludes increased FGF-23 cleavage in settings of increased synthesis. Consequently, iron deficiency causes hypophosphatemia in ADHR by increasing levels of biologically active FGF-23, detectable by increases in both cFGF-23 and iFGF-23 (9, 10). Iron deficiency also increased cFGF-23 and iFGF-23 levels and caused hypophosphatemia in wild-type neonatal mice, suggesting similar effects of iron deficiency on FGF-23 regulation in neonates as in ADHR (9). The neonatal period is uniquely suited to study FGF-23 homeostasis because of the rapid perinatal skeletal accretion in the setting of the abrupt cessation of transplacental mineral transport and the relative physiological hyperphosphatemia of infancy. We tested the hypothesis that lower iron status, marked by lower serum ferritin, is a novel regulator of FGF-23 production in neonates that results in higher FGF-23 levels in term infants.
Subjects and Methods
Participants
We studied healthy, full-term (≥37 weeks' gestation) neonates without congenital anomalies who were born after uncomplicated pregnancies at Prentice Women's Hospital of Northwestern Memorial Hospital (11). Maternal prepregnancy body mass index was either normal (18–25 kg/m2) or obese (>30 kg/m2). Only healthy mothers were eligible for inclusion; women with chronic kidney disease, gestational diabetes, or other chronic medical conditions were excluded. We collected maternal, infant, and labor data from the medical records, collected umbilical cord blood samples at the time of delivery, and stored aliquots of plasma and serum at −70 C until assays were performed. The study was approved by the Northwestern University Institutional Review Board, and all participating women provided written informed consent.
Primary outcomes and FGF-23 assays
The primary outcomes were cFGF-23 and iFGF-23 levels, which we measured from plasma in duplicate in the University of Miami FGF23 Core Lab using commercially available second-generation ELISA kits (Immutopics). The intact assay detects intact FGF-23 exclusively because the two epitopes flank the protein's cleavage site. The C-terminal assay detects intact FGF-23 and its C-terminal fragments because both epitopes reside in the C terminus (12, 13). cFGF-23 and iFGF-23 assays provide complementary yet distinct information about FGF-23 dynamics. Measuring iFGF-23 informs the level of biologically active hormone, whereas cFGF-23 detects both the full-length active hormone and one of its cleavage products. When measured simultaneously, one can infer the amount of C-terminal fragments derived from excess FGF-23 production and degradation (6). For cFGF-23, the lower limit of detection was 16 reference units (RU)/ml, and the inter- and intra-assay coefficients of variation were 3.8 and 4.9%, respectively, in our laboratory. For iFGF-23, the lower limit of detection was 8.5 pg/ml, and the inter- and intra-assay coefficients of variation were 4.5 and 7.6%, respectively. Although the manufacturer claims a lower sensitivity of 1.5 pg/ml based on determinations in a single assay, in our hands the lower limit of detection that could be reproducibly measured with acceptable precision was 8.5 pg/ml as determined across multiple assay runs. Samples with values higher than the measuring range of the assay were diluted (1:20) using sample diluent as recommended by the kit manufacturer.
Exposures
The primary exposure was cord blood serum ferritin, which is an established indicator of iron status in newborns (14, 15). We also measured serum iron and total iron binding capacity and calculated iron saturation as additional measures of iron stores. Because of evidence that hypoxemia may also play a role in FGF-23 regulation (9), we analyzed lower first Apgar score, primiparous or multiparous birth as a proxy of length of labor, and labor complications associated with fetal distress as binary (yes vs no) surrogate measures of hypoxemia. Labor complications included vaginal deliveries that required the use of forceps, presence of thick meconium, and cesarean sections that resulted from failure to progress through routine vaginal delivery.
Covariates
Because mineral accretion occurs at the fastest rate late in pregnancy, we analyzed effects of estimated gestational age at birth and birth weight on FGF-23 levels. Other covariates included maternal race and age, and blood glucose and C-peptide, given the association between glycemic indices and ferritin levels (16–18). We measured C-peptide instead of insulin because insulin measurements in cord blood may be unreliable (19). Although chronic kidney disease is known to increase FGF-23 levels, all infants in this study had normal kidneys by prenatal ultrasound.
Statistical analysis
We conducted standard descriptive analyses of the main exposures, outcomes and covariates. Continuous variables that were non-normally distributed were natural log-transformed so that they followed a normal distribution. Pearson and Spearman's correlation coefficients were used as measures of association for univariate analyses; t tests were used to compare the groups with and without labor complications and the babies born to primiparous vs multiparous women. We used multiple linear regression models to analyze the associations between cord blood cFGF-23 and iFGF-23 levels as the dependent variables and serum ferritin as the primary independent variable, adjusted for maternal and neonatal covariates. All factors that had P values less than .1 on univariate analysis were included as candidates in the multivariable models, along with glucose and C-peptide, which were forced into the models because of their known effects on ferritin levels. We analyzed the effects of each independent variable individually and in a stepwise fashion to generate the most parsimonious models for both cFGF-23 and iFGF-23. Levels of iFGF-23 below the limit of detection of 8.5 pg/ml were assigned a value of 5 pg/ml for the purposes of the analyses. Because the majority (61%) of the neonatal iFGF-23 levels were less than 8.5 pg/ml, we also dichotomized iFGF-23 levels into two groups for further analysis: those that were undetectable (<8.5 pg/mL) and those that were detectable. We used logistic regression and the same model building strategy and covariates as described for the linear modeling to perform adjusted analyses of dichotomized iFGF-23. All analyses were conducted using IBM SPSS 22 software (SPSS Inc.).
Results
Cord blood samples from 64 neonates were available for analysis. Infant and maternal characteristics are described in Table 1. Fifty-eight percent of the infants were female. Maternal self-identified racial groups were 48% white and 20% black. The mean ferritin level of the group was 203 ng/ml (range, 58–719 ng/mL). cFGF-23 levels ranged from 108 to 7508 RU/ml (median, 824 RU/ml). Intact FGF-23 levels ranged from less than 8.5 to 135.4 pg/ml (median, <8.5 pg/ml). cFGF-23 levels correlated directly with iFGF-23 levels (0.354, P = .005).
Infant and Maternal Characteristics (n = 64)
| Minimum | Median | Maximum | Mean ± sd | Reference Rangea | |
|---|---|---|---|---|---|
| Maternal factors | |||||
| Maternal age (years) | 19.5 | 33.6 | 40.9 | 31.9 ± 5.5 | |
| Maternal BMI (kg/m2) | 18.8 | 23.3 | 46.2 | 26.9 ± 7.2 | |
| Infant factors | |||||
| Birth weight (kg) | 2.55 | 3.40 | 5.03 | 3.55 ± 0.55 | |
| Gestational age (weeks) | 36.7 | 39.9 | 42.0 | 39.7 ± 1.1 | |
| Ferritin (ng/ml) | 57.8 | 184.6 | 719.1 | 203.0 ± 111.9 | 13–150 |
| Iron (μg/dl) | 57 | 145 | 302 | 150.2 ± 54.5 | 35–145 |
| TIBC (μg/dl) | 85.7 | 243.0 | 943.0 | 277.6 ± 140.8 | 110–350 |
| Iron saturation (%) | 20.7 | 55.5 | 94.3 | 59.2 ± 21.6 | 20–50 |
| cFGF-23 (RU/ml) | 108 | 824 | 7508 | 1678 ± 1857 | |
| iFGF-23 (pg/ml) | <8.5 | <8.5 | 135.4 | 16.7 ± 24.2b | |
Abbreviations: BMI, body mass index; TIBC, total iron binding capacity.
Reference ranges for healthy nonpregnant premenopausal women.
iFGF-23 below lower limit of detection of <8.5 pg/ml were assigned value of 5 pg/ml.
Lower cord blood ferritin levels and labor complications were each associated with higher cFGF-23, but not intact FGF-23 levels in univariate comparisons (Figures 1 and 2). Both intact and cFGF-23 levels were higher in primiparous deliveries (Figure 3). Serum iron and iron saturation were not related to cFGF-23 or iFGF-23 (data not shown).
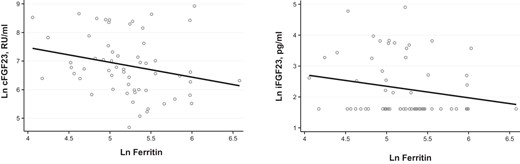
Relationship of ferritin to FGF-23 levels.
Lower ferritin is associated with higher cFGF-23 (R = −0.320, P = .014) but not iFGF-23 (R= −0.222, P = .082) levels. Ln, natural log.
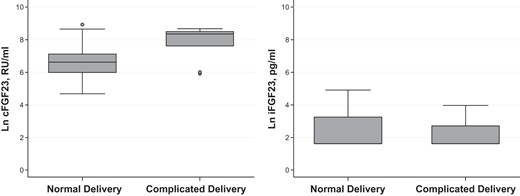
FGF-23 levels according to delivery status.
Complicated delivery is associated with higher cFGF-23 levels (P = .005) but not iFGF-23 (P = .083) levels. Data are represented by boxplots. Circles denote outliers. Ln, natural log.
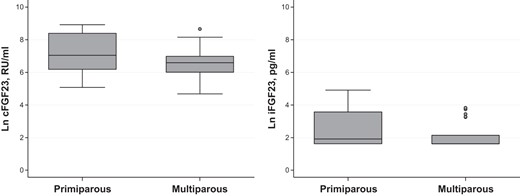
Parity and FGF-23 levels.
FGF-23 is higher in primiparous vs multiparous deliveries. (cFGF-23: P = .048; iFGF-23; P = .052). Data are represented by boxplots. Circles denote outliers. Ln, natural log.
Factors that related to cFGF-23 and iFGF-23 in univariate and multivariate analyses are shown in Tables 2 and 3, respectively. In the full multivariate model, lower ferritin remained independently associated with higher cFGF-23 levels. Additionally, higher cord blood glucose and higher cord blood C-peptide levels were also independently associated with higher cFGF-23 in the fully adjusted model. In contrast, ferritin was not associated with iFGF-23 in the multivariate linear regression analysis (Table 3) or the multivariate logistic regression model of detectable vs undetectable iFGF-23 (data not shown).
Correlates of cFGF-23 Levels
| Variable | Univariate Analysis | Multivariate Analysis | ||
|---|---|---|---|---|
| β | P Value | β | P Value | |
| Neonatal factors | ||||
| Gestational age (weeks) | 0.215 | .095 | 0.120 | .239 |
| Birth weight (kg) | 0.141 | .278 | ||
| Sex | −0.156 | .229 | ||
| Length (cm) | 0.155 | .243 | ||
| Cord blood glucose (mg/dl) | 0.430 | .001 | 0.347 | .005 |
| Cord blood C-peptide (ng/ml) | 0.407 | .002 | 0.363 | .002 |
| Ln ferritin | −0.242 | .064 | −0.261 | .011 |
| Lower first Apgar score | 0.094 | .489 | ||
| Maternal factors | ||||
| Multiparity | −0.248 | .054 | −0.165 | .150 |
| Delivery method (vaginal vs cesarean) | 0.066 | .611 | ||
| Maternal age (y) | 0.315 | .014 | 0.040 | .719 |
| Black race | −0.250 | .074 | −0.036 | .743 |
| Labor complication | 0.358 | .005 | 0.172 | .168 |
Analysis with linear regression, dependent variable Ln cFGF-23. Multivariate analysis including all factors with P < .10.
Abbreviation: Ln, natural log.
Correlates of iFGF-23 Levels
| Variable | Univariate Analysis | Multivariate Analysis | ||
|---|---|---|---|---|
| β | P Value | β | P Value | |
| Neonatal factors | ||||
| Gestational age (weeks) | 0.201 | .111 | ||
| Birth weight (kg) | 0.118 | .353 | ||
| Sex | −0.072 | .573 | ||
| Length (cm) | 0.083 | .515 | ||
| Cord blood glucose (ng/ml) | −0.138 | .283 | ||
| Cord blood C-peptide (ng/ml) | 0.290 | .023 | 0.267 | .047 |
| Ln ferritin | −0.195 | .129 | −0.175 | .180 |
| Lower first Apgar score | −0.151 | .254 | ||
| Maternal factors | ||||
| Multiparity | −0.240 | .056 | −0.270 | .053 |
| Delivery method (vaginal vs cesarean) | 0.196 | .120 | ||
| Maternal age (y) | 0.189 | .139 | ||
| Black race | −0.246 | .070 | −0.134 | .339 |
| Labor complication | −0.024 | .848 | ||
Analysis with linear regression, dependent variable LN iFGF-23. Multivariate analysis including all factors with P < .10.
Discussion
Because of the negative cardiovascular and skeletal outcomes associated with elevated FGF-23 levels, defining novel and potentially modifiable factors that regulate FGF-23 is an area of intense investigation. Previous studies identified overt iron deficiency as a novel stimulus for FGF-23 production in ADHR and in adult women with menorrhagia (9, 10). In this first report to simultaneously measure iron status and both cFGF-23 and iFGF-23 levels in healthy human cord blood, lower serum ferritin levels were independently associated with higher plasma cFGF-23 but not iFGF-23 levels. These findings are consistent with prior results from adult human studies of overt iron deficiency and FGF-23 levels in non-ADHR populations (7, 8). Our results also broadly confirm the results of prior studies that separately reported relatively low iFGF-23 and high cFGF-23 levels (for unclear reasons, we report substantially higher cFGF-23 levels than previous reports) in umbilical cord blood samples, but extend them by demonstrating novel associations with ferritin levels (20–22).
A limitation of our study is that we exclusively studied healthy term neonates born to mothers who received optimal prenatal care, uniformly took prenatal vitamins, and thus were mostly iron replete. As a result, the cord blood iron stores we measured were within normal limits for full-term neonates, and even higher than in previous studies (23, 24). Relative iron sufficiency may explain why we found no significant associations between total serum iron and iron saturation with FGF-23 levels. Thus, the significant inverse relationship between ferritin and cFGF-23 may be more striking in pregnant women with limited access to prenatal care and lower iron stores. Another limitation is that we did not formally assess maternal vitamin D levels, which could theoretically affect FGF-23 homeostasis in the neonates. However, all women in the study underwent standard prenatal care at Northwestern University and were taking standard prenatal vitamins that included vitamin D.
One mechanism linking iron deficiency to increased FGF-23 transcription is stabilization of hypoxia inducible factor-1α, which is also stabilized by hypoxia (25). Because we studied term neonates born after mostly uncomplicated pregnancies and deliveries, the extent of hypoxemia resulting from labor complications in our cohort was likely minimal. Nonetheless, in univariate analyses, cFGF-23 levels were significantly higher in the settings of primiparity or labor complications, which are associated with fetal hypoxemia. Although we did not have detailed data on duration of labor, both situations entail longer labor times and may be proxy measurements of fetal hypoxia. Variations in FGF-23 among these otherwise apparently healthy term neonates may be due to subclinical fetal distress, low-grade placental insufficiency, or chronic compensated intrauterine processes that can be common even in healthy pregnancies (26). Additional research of more diverse populations including larger numbers of complicated pregnancies, in particular those resulting in preterm birth and with accompanying placental studies, umbilical cord blood gases, and fetal heart rate tracings is warranted to further evaluate the role of fetal hypoxemia in FGF-23 regulation.
The magnitude of the cFGF-23 elevation that we observed in healthy neonates to a median of greater than 800 RU/ml is comparable to the levels observed in patients with advanced chronic kidney disease (27, 28). Elevation of other hormone levels in the neonatal period suggests perinatal hormonal resistance (11). Resistance to FGF-23 could occur because of down-regulation of tubular expression of α-Klotho, which is the coreceptor that heterodimerizes with FGF receptors to form the high-affinity binding site for FGF-23 in the kidney (29). Genetic models of α-Klotho deficiency result in hyperphosphatemia, marked FGF-23 elevation, and accelerated aging (30). Advanced chronic kidney disease is also associated with α-Klotho deficiency, elevated FGF-23 levels, and hyperphosphatemia (31). It is interesting to speculate that relative α-Klotho deficiency occurs normally during the perinatal and early postnatal period when phosphate and calcium retention are needed for rapid development of the skeleton and other organs. In this setting, accelerated aging and resistance to FGF-23–mediated phosphate excretion and suppression of calcitriol production might be advantageous to the neonate. Whether α-Klotho deficiency underlies the higher serum phosphate levels that normally occur during the first year of life and the contemporaneous increases in FGF-23 levels that we observed requires further study.
Unlike studies of otherwise healthy adults with iron deficiency, we observed significant direct correlation between cFGF-23 and iFGF-23 levels in neonates. These results parallel the findings in iron deficient ADHR patients whose excessive production of cleavage-resistant FGF-23 results in increases in both cFGF-23 and iFGF-23 levels and hypophosphatemia (10). Neonatal wild-type mice born to iron-deficient mothers also demonstrated a similar profile with elevated cFGF-23 and iFGF-23 levels and renal phosphate wasting with hypophosphatemia (9). Collectively, the similarities between the neonatal period and ADHR suggest that perhaps FGF-23 cleavage is down-regulated or impaired in neonates. We did not have adequate sample volumes to measure serum phosphate or urinary phosphate excretion, which would have enabled us to test the end-organ renal effects of altered FGF-23 levels.
Consistent with our prior report of an association of higher fasting glucose and insulin with higher cFGF-23 levels in older children (32), we also found that higher levels of glycemic indices were independently associated with higher cFGF-23 levels in healthy neonates. Further studies are needed to explore potential mechanisms underlying the link between glycemia and cFGF-23 levels and to investigate the impact of gestational diabetes on FGF-23 regulation.
If confirmed, our results may be ultimately most clinically relevant to management of premature infants. The greatest amount of mineral accretion occurs after the 25th week of gestation (33, 34). As a result, premature infants fail to mineralize their bone completely. Further complicating their failure to accrete, premature neonates are often iron-deficient (35), which we predict would markedly increase FGF-23 transcription. If preterm neonates are indeed unable to couple their excess FGF-23 production to a commensurate increase in FGF-23 cleavage, resulting elevations of iFGF-23 could promote phosphate wasting, as was observed in iron-deficient newborn mice. Phosphate wasting in the setting of prematurity could severely exacerbate premature neonates' failure to accrete, and contribute to their metabolic bone disease and predisposition to fracture (36). In support of this hypothesis, premature infants with metabolic bone disease develop lower serum phosphate levels during the first 8 weeks of life than those without bone disease, but the mechanisms are unknown (36). Further studies are needed to determine whether iron deficiency-associated increases in iFGF-23 contribute to lower serum phosphate and bone disease in preterm neonates. If so, iron repletion could be a novel therapeutic approach to improve bone health in preterm babies.
Acknowledgments
This work was supported by grants R01DK076116 and K24DK093723 from National Institutes of Health (to M.W.) that supported the writing of the paper.
Disclosure Summary: The authors have nothing to disclose.
Abbreviations
- ADHR
autosomal dominant hypophosphatemic rickets
- cFGF
C-terminal fibroblast growth factor
- iFGF
intact fibroblast growth factor
- FGF
fibroblast growth factor
- RU
relative unit.
