


Abstract
We aimed to determine (a) longitudinal changes of inflammatory and oxidative stress markers and (b) the association between markers of inflammation and perioperative complications in coronary artery bypass surgery (CABG) patients treated with intensive vs conservative blood glucose (BG) control.
Patients with diabetes (n = 152) and without diabetes with hyperglycemia (n = 150) were randomized to intensive (n = 151; BG: 100–140 mg/dL) or to conservative (n = 151; BG: 141–180 mg/dL) glycemic targets. Plasma cortisol, high-sensitivity C-reactive protein (hsCRP), tumor necrosis factor-α, interleukin-6 (IL-6), thiobarbituric acid-reactive substances, and 2′-7′-dichlorofluorescein were measured prior to and at days 3, 5, and 30 after surgery.
Intensive glycemic control resulted in lower mean BG (132 ± 14 mg/dL vs 154 ± 17 mg/dL, P < 0.001) in the intensive care unit. Plasma cortisol and inflammatory markers increased significantly from baseline after the third and fifth day of surgery (P < 0.001), and returned to baseline levels at 1 month of follow-up. Patients with perioperative complications had higher levels of cortisol, hsCRP, IL-6, and oxidative stress markers compared with those without complications. There were no significant differences in inflammatory and oxidative stress markers between patients, with or without diabetes or complications, treated with intensive or conventional glucose targets.
We report no significant differences in circulating markers of acute inflammatory and oxidative stress response in cardiac surgery patients, with or without diabetes, treated with intensive (100–140 mg/dL) or conservative (141–180 mg/dL) insulin regimens.
Extensive observational and prospective randomized clinical trials in cardiac surgery patients, with and without diabetes, indicate a strong association between hyperglycemia and poor clinical outcomes (1, 2). Hyperglycemia is reported in 60%–90% of patients with diabetes, and in more than half of patients without diabetes, undergoing coronary artery bypass graft (CABG) surgery (3–5). The development of hyperglycemia following surgery increases rates of complications, infection, and mortality, as well as hospital length of stay, when compared with patients who maintain normoglycemia (6–8). Several underlying mechanisms have been implicated in the detrimental effects of hyperglycemia during the perioperative period, including impaired neutrophil granulocyte function, impaired wound healing, high circulating free fatty acids, increased platelet aggregation and prothrombotic state, endothelial dysfunction, and immune dysregulation (9–11).
A strong body of evidence indicates that hyperglycemia is associated with an increased proinflammatory and oxidative state. High levels of proinflammatory markers, such as tumor necrosis factor-α (TNF-α), interleukin (IL)-6, IL-1, and C-reactive protein (1, 12, 13) observed after cardiac surgery have been attributed to surgical trauma, cardiopulmonary bypass, as well as pulmonary and myocardial reperfusion (14–16). In cross-sectional studies, the extent of the inflammatory response has been associated with a higher risk of complications after cardiac surgery (17, 18). However, no prospective studies have investigated longitudinal changes in inflammatory and oxidative stress markers during the perioperative period in patients treated to intensive [target blood glucose (BG) 100–140 mg/dL] vs conservative (141–180 mg/dL) glycemic targets following CABG surgery. Accordingly, we aim to report levels of cortisol, oxidative stress markers, and circulating cytokines at baseline and postoperatively in insulin-treated patients recruited to the GLUCO-CABG trial, a prospective randomized study comparing the effect of intensive and conservative glucose control in CABG surgery patients with and without diabetes (5).
Materials and Methods
The design and methods of the GLUCO-CABG trial have been described previously (5). In brief, this was a 3-center, open-label clinical trial that enrolled CABG surgery patients with perioperative hyperglycemia, defined as BG >140 mg/dL. Patients were randomly allocated to intensive or conservative insulin therapy after CABG surgery. Patients with and without diabetes assigned to the intensive control group (n = 151) received continuous insulin infusion (CII) adjusted to maintain a glucose target between 100 and 140 mg/dL in the intensive care unit. Those assigned to the conservative control group (n = 151) received CII adjusted to maintain a glucose level between 141 and 180 mg/dL in the intensive care unit. After discontinuation of CII, subjects were transitioned to a single-treatment protocol aimed to maintain a glucose target <140 mg/dL before meals, both during the hospital stay and 90 days after discharge. We reported no difference in a composite of complications, including sternal wound infection (deep and superficial), bacteremia, respiratory failure, pneumonia, acute kidney injury, major cardiovascular events (acute myocardial infarction, congestive heart failure, and cardiac arrhythmias), or death between patients treated with intensive compared with conservative glucose control (42% vs 52%, P = 0.08). However, we found heterogeneity in treatment effect according to diabetes status, with no difference in complications among diabetic patients treated with intensive or conservative insulin regimens (49% vs 48%, P = 0.87), but a significantly lower rate of complications in nondiabetic patients treated with intensive compared with conservative insulin therapy (34% vs 55%, P = 0.008).
One of the prespecified secondary outcomes in this trial was to examine the impact of intensive glucose control on plasma concentrations of cortisol and inflammatory markers during the perioperative period. Markers measured included plasma cortisol, high-sensitivity C-reactive protein (hsCRP), TNF-α, IL-6, as well as oxidative stress markers: thiobarbituric acid-reactive substances (TBARS) and 2′-7′-dichlorofluorescein (DCF). Blood samples were collected preoperatively (on the day of surgery or 1 day prior to surgery) and at days 3, 5, and 30 postoperatively.
All assays were performed in the Endocrinology/Lipoprotein Laboratories at the University of Tennessee Health Science Center (Memphis, TN), as previously described (13, 19, 20). Briefly, levels of cardiovascular risk factors (hsCRP), metabolic hormones (cortisol), and proinflammatory cytokines (TNF-α and IL-6) were measured in plasma using a solid-phase, 2-site sequential chemiluminescent immunometric assay on an Immulite analyzer (Siemens Health Care Diagnostics Products, Malvern, PA). The coefficients of variation of the assays were all <5%. The instrument calibrations for the assays were performed as recommended by the manufacturers and were within the specifications. Assays for markers of oxidative stress (reactive oxygen species) and lipid peroxidation were determined by DCF assay and malondialdehyde assay, respectively (13, 19, 20). Normal fasting values in lean control nondiabetic subjects established in this laboratory for the cytokine assays are as follows: TNF-α <5.0 pg/ml; IL-6 <5.0 pg/ml; TBARS, 0.8 ± 0.1 μmol/L; DCF, 2.3 ± 0.4 μmol/L; and C-reactive protein, 1 ± 0.2 mg/L. Normal fasting values for the other assays measured in this laboratory are as previously published (13). Two levels of assay controls were determined with each assay for each analyte, and all control values were within the established ranges. The Endocrinology/Lipoprotein Laboratory at the University of Tennessee Health Science Center is state of Tennessee and Centers for Medicare & Medicaid Services licensed and participates in the College of American Pathology Quality Assessment Program for monitoring the accuracy and precision of these assays.
The study was conducted at 3 academic medical centers, including Emory University Hospital, Emory University Hospital Midtown, and Grady Memorial Hospital in Atlanta, GA. Exclusion criteria included patients with impaired renal function (serum creatinine ≥3.0 mg/dL or glomerular filtration rate <30 ml/min/1.73 m2), patients with hepatic failure, history of hyperglycemic crises, those at imminent risk of death, pregnancy, and patients or next of kin unable to provide consent. The institutional review board at Emory University approved the study protocol and consent.
Statistical analysis
The GLUCO-CABG trial was a 2-arm randomized multicenter, open-label, controlled, intention-to-treat trial. The primary objective of this study was to determine longitudinal changes in inflammatory response and oxidative stress between patients with and without diabetes and with and without perioperative complications during intensive and conservative insulin treatment. We used nonparametric Wilcoxon (or Kruskal–Wallis) tests to compare continuous variables between groups. We compared discrete variables based on χ2 test or Fisher’s exact test. We performed repeated measures analysis of variance to assess longitudinal changes of inflammatory markers between groups. Continuous variables are reported as mean ± standard deviation, unless specified otherwise. Discrete variables are reported as count and percent. For all analyses, a 2-sided α <0.05 was considered significant. All analyses were performed using SAS software version 9.2 (SAS Institute, Cary, NC).
Results
Inflammatory and oxidative stress markers were collected in all 302 patients in the GLUCO-CABG trial: 151 in the intensive group and 151 in the conservative group. The clinical characteristics of patients included in the current study are shown in Table 1. The groups were well balanced with no significant differences in the mean age, racial distribution, body mass index, smoking history, American Heart Association procedure-specific cardiac risk category, duration of diabetes, or hospital length of stay between treatment groups. There were no differences between intensive and conservative treatment groups in the mean glucose on admission, during randomization, or during surgical intervention (Table 1). After discontinuation of CII, 98% of patients with diabetes and 49% of patients without diabetes were transitioned to subcutaneous insulin regimen. In addition, there were no differences in mean daily glucose posttransition during the hospital stay between intensive and conservative groups (143.4 ± 27.6 mg/dL vs 141.3 ± 29.1 mg/dL, P = 0.44).
Clinical Characteristics of the GLUCO-CABG Study Population
| Intensive | Conservative | P Value | |
|---|---|---|---|
| Number | 151 | 151 | |
| Sex, n (%) | 0.44 | ||
| Female | 45 (30%) | 39 (26%) | |
| Male | 106 (70%) | 112 (74%) | |
| Race, n (%) | 1 | ||
| White | 110 (73%) | 111 (74%) | |
| African American | 35 (23%) | 34 (23%) | |
| Other | 6 (4%) | 6 (4%) | |
| Age, y | 64.2 ± 9.2 | 63.6 ± 10.1 | 0.84 |
| BMI, kg/m2 | 31.2 ± 7.2 | 30.3 ± 7.2 | 0.4 |
| Medical history | |||
| Hypertension, n (%) | 142 (94%) | 135 (91%) | 0.38 |
| Prior myocardial infarction, n (%) | 13 (9%) | 14 (9%) | 0.84 |
| COPD, n (%) | 18 (12%) | 19 (13%) | 0.86 |
| Smoking status, n (%) | |||
| Current smoker | 33 (23%) | 46 (33%) | 0.07 |
| Previous smoker | 57 (42%) | 63 (51%) | 0.13 |
| History of diabetes, n (%) | 77 (51%) | 75 (50%) | |
| Duration of DM, y | 10.9 ± 8.8 | 10.8 ± 10.1 | 0.72 |
| Total hospital LOS, d | 9.5 ± 5.8 | 11.4 ± 11.0 | 0.13 |
| ICU LOS post-CABG, d | 3.6 ± 5.0 | 4.8 ± 10.0 | 0.09 |
| Surgery type, n (%) | 0.86 | ||
| Elective | 25 (17%) | 24 (16%) | |
| Emergent | 2 (1%) | 1 (1%) | |
| Urgent | 124 (82%) | 126 (83%) | |
| APACHE II score | 21.7 ± 3.6 | 22.4 ± 3.3 | 0.12 |
| Length of surgery, h | 5.2 ± 1.7 | 5.4 ± 1.4 | 0.24 |
| HbA1c, % | 6.9 ± 1.9 | 6.7 ± 1.8 | 0.61 |
Abbreviations: APACHE II, Acute Physiology and Chronic Health Evaluation II; BMI, body mass index; COPD, chronic obstructive pulmonary disease; DM, diabetes mellitus; ICU, intensive care unit; LOS, length of stay.
Levels of inflammatory and oxidative stress markers increased from baseline, peaking at about day 3, and returning to baseline 30 days after surgery. In the cross-sectional analysis, there were no differences in inflammatory and oxidative stress markers between the intensive and conservative groups (Fig. 1). Levels of cortisol, hsCRP, and IL-6 increased significantly at days 3 and 5 after surgery, with return to baseline at day 30 after surgery (Fig. 1).
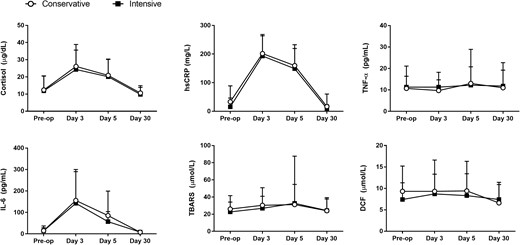
Changes in inflammatory and oxidative stress markers between conservative and intensive insulin therapy. There were no statistically significant differences in inflammatory and oxidative stress markers between patients treated to intensive or conservative glucose targets. Data reported as mean and standard deviation.
There were fewer patients with 1 or more perioperative complications in the intensive insulin compared with patients in the conservative treatment group, but differences did not reach statistical significance (44% vs 56%, P = 0.10). Consistent with prior studies, patients experiencing complications had significantly higher plasma levels of cortisol, hsCRP, IL-6, and oxidative stress markers during the postoperative period when compared with patients without complications (all, P < 0.02), as shown in Figure 2.
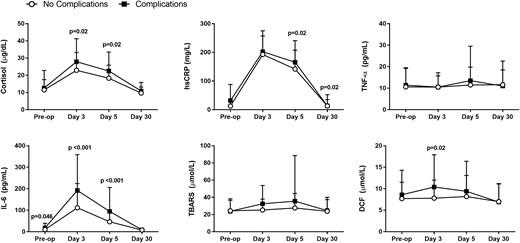
Inflammatory and oxidative stress markers in patients with postoperative complications vs no complications. Patients with postoperative complications had significantly higher levels of cortisol, hsCRP, IL-6, and DCF following surgical intervention. Data reported as mean and standard deviation.
Changes in inflammatory markers stratified by history of diabetes and presence of perioperative complications revealed significant elevations in cortisol and IL-6 in patients with complications, regardless of the presence or absence of pre-existing diabetes (Fig. 3). In addition, we observed that oxidative stress markers (TBARS, DCF) in nondiabetic patients with complications were significantly higher (P ≤ 0.003 and P < 0.005, respectively) compared with those without complications, a change that was not observed in the diabetic cohort (Fig. 3).
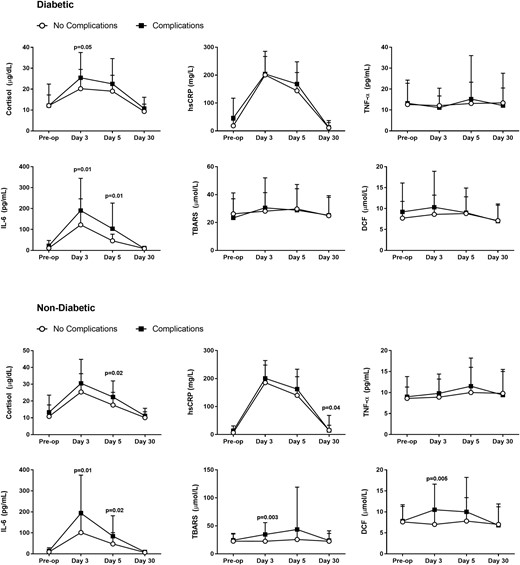
Inflammatory and oxidative stress markers by diabetes status and presence of complications. Cortisol and inflammatory markers increased significantly from baseline after surgery and returned to baseline levels at 1 month of follow-up in patients with diabetes (top panel) and without preexisting diabetes (bottom panel). Data reported as mean and standard deviation.
Discussion
This study aimed to determine longitudinal changes in inflammatory response and differences between patients with and without diabetes and perioperative complications treated with intensive and conservative glucose targets. We observed significant elevations in acute inflammatory response markers after the third and fifth day of surgery, which returned to baseline levels after 1 mo of follow-up. Patients with surgical complications had higher levels of inflammatory and oxidative stress markers; however, we observed no significant differences in the inflammatory response in subjects with or without diabetes treated with intensive (target BG: 100–140 mg/dL) or conservative (BG: 141–180 mg/dL) insulin regimens.
Several mechanisms could explain the transient elevation of inflammatory and oxidative stress markers following CABG surgery. On one hand, the acute systemic inflammatory response can be the result of surgical trauma, cardiopulmonary bypass, and organ reperfusion injury (12–15, 21, 22). Cardiopulmonary bypass has been shown to impact the cellular and noncellular elements of blood, resulting in the activation of different proinflammatory cascades (23, 24), generation of reactive oxygen species, and oxidative stress after cardiac surgery (25). The extent of the inflammatory and oxidative response has been linked to a higher risk of complications after surgery (15, 17, 18). In contrast, the development of hyperglycemia has also been shown to induce monocytes to produce proinflammatory cytokines, chemokines, and increased levels of serum acute-phase proteins such as TNF-α, IL-6, and IL-1β (13, 26). This increased inflammatory and oxidative stress state can lead to insulin resistance and vascular dysfunction (13, 27) and has been proposed to play a role in the poor outcomes in diabetic patients with acute cardiovascular events, stroke, and in those undergoing cardiac surgery (2).
Our study is unique in multiple areas. This longitudinal study analyzes changes in inflammatory and oxidative stress markers during the perioperative period in hyperglycemic patients with and without diabetes treated with intensive and conservative insulin regimens after CABG surgery. Our study confirms previous studies that reported higher increments from baseline in cortisol and inflammatory markers shortly after surgery, with higher levels in patients suffering perioperative complications compared with those without complications. Similar concentrations of cortisol and inflammatory markers were present independent of glucose control or a previous history of diabetes, suggesting that changes in the inflammatory response were related to the surgical insult more than the presence of hyperglycemia. However, elevations in oxidative stress markers were observed in nondiabetic patients, changes that were not observed in diabetic patients with complications.
We acknowledge the following limitations, including the relatively small number of participants and the fact that all patients received insulin therapy when glucose levels were >140 mg/dL, not allowing for the determination of the effect of persistent untreated hyperglycemia on inflammatory and oxidative stress. In addition, the small difference in mean glucose concentration between intensive and conservative groups may have prevented observation of significant changes in inflammatory markers. Our study was not powered to look separately at inflammatory marker levels or complication risk in nondiabetic patients randomized to intensive vs conservative glycemic control. Further studies are needed to investigate the role of inflammatory markers and perioperative glycemic control in nondiabetic patients.
In summary, the results of this study indicate that CABG surgery is associated with a significant elevation in inflammatory and oxidative stress markers, which is independent of insulin regimens targeting intensive (BG: 100 and 140 mg/dL) or conservative (BG: 141 and 180 mg/dL) glucose values. Higher levels of inflammatory and oxidative stress markers, which were independent of glucose concentration and intensity of treatment, were observed in patients with perioperative complications compared with patients without hospital complications.
Abbreviations:
- BG
blood glucose
- CABG
coronary artery bypass graft
- CII
continuous insulin infusion
- DCF
2′-7′-dichlorofluorescein
- hsCRP
high-sensitivity C-reactive protein
- IL
interleukin
- TNF-α
tumor necrosis factor-α
Acknowledgments
Partial data from this trial were presented at the 74th Scientific American Diabetes Association meeting, June 2014, San Francisco, CA.
This investigator-initiated work was supported by a clinical research grant from the American Diabetes Association (7-03-CR-35), Grant UL1 RR025008 from the Clinical and Translational Science Award program, National Institutes of Health, National Center for Research Resources, and an unrestricted grant to Emory University from Sanofi Aventis (Bridgewater, NJ). The sponsors of the study were not involved in the study design, data collection, analysis or interpretation of the results, or preparation of the manuscript.
Author contributions: G.E.U. is the guarantor of this work and, as such, had full access to all the data in the study and takes responsibility for the integrity of the data and the accuracy of the data analysis. G.E.U. wrote the initial research proposal. D.R.-U., G.D., and G.E.U. wrote the manuscript. F.J.P., S.C., S.J., P.V., V.H.T., S.H., R.A.G., M.H., and M.F. reviewed and edited the research proposal and manuscript and contributed to the discussion. L.P. conducted the statistical analysis.
Disclosure Summary: G.E.U. has received unrestricted research support for inpatient studies (to Emory University) from Merck, Novo Nordisk, Astra Zeneca, Boehringer Ingelheim, and Sanofi, and has received consulting fees and/or honoraria for membership in advisory boards from Sanofi. F.J.P. and P.V. have received consulting fees from Merck. R.A.G. has received honoraria for consulting work from Medtronic. The remaining authors have nothing to disclose.
References
Author notes
These authors contributed equally to this study.
Address all correspondence and requests for reprints to: Guillermo E. Umpierrez, MD, Emory University School of Medicine, Director, Diabetes and Endocrinology Section, Grady Health System, 49 Jesse Hill Jr. Drive, Atlanta, Georgia 30303. E-mail: [email protected].
