


Abstract
Adiponectin plays key roles in regulating appetite and food intake.
To investigate interactions between the genetic risk score (GRS) for adiponectin levels and weight-loss diets varying in macronutrient intake on long-term changes in appetite and adiponectin levels.
A GRS was calculated based on 5 adiponectin-associated variants in 692 overweight adults from the 2-year Preventing Overweight Using Novel Dietary Strategies trial.
Repeated measurements of plasma adiponectin levels and appetite-related traits, including cravings, fullness, prospective consumption, and hunger.
Dietary fat showed nominally significant interactions with the adiponectin GRS on changes in appetite score and prospective consumption from baseline to 6 months (P for interaction = 0.014 and 0.017, respectively) after adjusting for age, sex, ethnicity, baseline body mass index, and baseline respective outcome values. The GRS for lower adiponectin levels was associated with a greater decrease in appetite (P < 0.001) and prospective consumption (P = 0.008) among participants consuming a high-fat diet, whereas no significant associations were observed in the low-fat group. Additionally, a significant interaction was observed between the GRS and dietary fat on 6-month changes in adiponectin levels (P for interaction = 0.021). The lower GRS was associated with a greater increase in adiponectin in the low-fat group (P = 0.02), but it was not associated with adiponectin changes in the high-fat group (P = 0.31).
Our findings suggest that individuals with varying genetic architecture of circulating adiponectin may respond divergently in appetite and adiponectin levels to weight-loss diets varying in fat intake.
Adiponectin is a well-described adipokine that possesses regulatory effects on glucose and lipid metabolism, insulin sensitivity, and inflammation (1–3). Beyond its effects in the peripheral tissues, adiponectin has also been reported to target the central nervous system and modulate appetite and energy homeostasis (4, 5). By increasing adenosine 5′-monophosphate–activated protein kinase in the hypothalamus, adiponectin may stimulate food intake in the fasting state in short-term experiments (6), as opposed to reducing food intake in the long term (7).
Consistent with its potential central effects on appetite regulation, altered circulating adiponectin levels have been observed in human eating disorders (8, 9). In particular, adiponectin levels were elevated in patients with anorexia nervosa, whereas decreased adiponectin was related to binge eating (9). A very recent study in a German Sorbs population reported associations of both genetic variants of the adiponectin gene and circulating adiponectin levels with eating behaviors, including cognitive restraint of eating, disinhibition, and hunger (10), providing further support for the close link between circulating adiponectin levels, appetite regulation, and ingestive behaviors. Large-scale genome-wide association studies (GWASs) have identified common variants that influence adiponectin levels, providing valuable tools to examine the relationship between adiponectin and appetite at the genetic level (11, 12). We hypothesized that individuals with varying genetic architecture of adiponectin levels may show divergent changes in appetite and adiponectin levels in response to weight-loss diets varying in macronutrient intake.
In the present study, we calculated a genetic risk score (GRS) for circulating adiponectin levels based on GWAS-identified single nucleotide polymorphisms (SNPs). We investigated the associations between the GRS and changes in appetite and adiponectin levels in response to a 2-year dietary intervention in the Preventing Overweight Using Novel Dietary Strategies (POUNDS Lost) trial and examined whether the adiponectin genetic variations might modify the effects of a weight-loss diet on the long-term changes in appetite and adiponectin levels during the course of the intervention.
Materials and Methods
Study design and participants
The POUNDS Lost trial was conducted from 2004 to 2007 at 2 sites: Harvard T.H. Chan School of Public Health and Brigham and Women’s Hospital (Boston, MA) and Pennington Biomedical Research Center of the Louisiana State University system (Baton Rouge, LA). The study design, methods, and primary results have been described in detail previously (13), and the flowchart of study population is shown in Supplemental Fig. 1. Briefly, a total of 811 overweight and obese participants were randomly assigned to 1 of 4 energy-reduced diets with varying compositions of fat, protein, and carbohydrate to compare their effects on body weight, and they were followed during 2 years. The target compositions of fat, protein, and carbohydrate as percentages of energy in the 4 diets were 40%, 25%, and 35%; 40%, 15%, and 45%; 20%, 25%, and 55%; and 20%, 15%, and 65%. Therefore, 2 diets were low fat (20%) and 2 were high fat (40%), and 2 were average protein (15%) and 2 were high protein (25%), constituting a 2-by-2 factorial design. The 4 diets also allowed for a dose-response test of carbohydrate intake ranging from 35% to 65% of energy. Each participant’s caloric prescription represented a deficit of 750 kcal per day from baseline, as calculated from the person’s measured resting energy expenditure and activity level. We excluded participants who had diabetes mellitus or unstable cardiovascular disease, used medications that affect body weight, or showed insufficient motivation as assessed by an interview and questionnaire. The study was approved by the human subjects committee at each institution and by a data and safety monitoring board appointed by the National Heart, Lung, and Blood Institute. All participants gave written informed consent.
Measurements of appetite
Appetite was measured at baseline and 6, 12, and 24 months by using a motivation-to-eat visual analog scale, which included 4 standardized scales: (1) How often did you experience cravings over the past week? (“never” to “always”); (2) How hungry have you felt over the past week? (“not hungry at all” to “as hungry as I’ve ever felt”); (3) How full have you felt over the past week? (“not full at all” to “very full”); and (4) How much do you think you could have eaten over the past week? (“nothing at all” to “a large amount”) (14, 15). Each visual analog scale consisted of a 100-mm line anchored at the beginning and end by opposing statements. Participants marked an X on the line to indicate their feelings at that given moment. Scores were determined by measuring the distance (in millimeters) from the left starting point of the line to the intersection of the X. Participants remained seated throughout the experimental session. An average appetite score was calculated at each time of measurement according to appetite score = [craving + (100 − fullness) + prospective consumption + hunger]/4, which reflected the 4 questions on the motivation-to-eat questionnaires (14, 15).
Genotyping and GRS calculation
DNA was extracted from the buffy coat fraction of centrifuged blood using the QIAmp blood kit (Qiagen, Chatsworth, CA). Study samples were genotyped and analyzed using an Illumina Infinium OmniExpress-24 kit (Illumina, San Diego, CA). After quality control, the genotyped dataset had 692 samples and 660,673 SNPs. We used the Michigan Imputation Server (https://imputationserver.sph.umich.edu/index.html) to impute SNPs on chromosomes 1–22 in 583 whites and 109 blacks, with 1000G Phase 3 v5 as the reference panel. Lead SNPs that were identified as associated with circulating adiponectin levels from 2 recent large-scale GWASs (11, 12) were considered for inclusion in the GRS (Supplemental Table 1). We excluded SNPs associated with waist-to-hip ratio, lipids, or insulin to avoid analyzing pleiotropic effects, because the genetic variants may affect appetite through effects on these traits in addition to adiponectin. This left rs3001032, rs12922394, rs6810075, rs1597466, and rs998584 to be included in the GRS (the first 3 SNPs were genotyped and the other 2 were imputed), and we weighted each SNP according to its relative effect size (β coefficient). We rescaled the weighted score to reflect the number of risk alleles with use of the following equation: weighted GRS = (β1 × SNP1 + β2 × SNP2 + ... + βn × SNPn) × (total number of SNPs/sum of the β coefficients). Thus, each point of the GRS corresponded to 1 risk allele.
Measurements of anthropometrics, diet, and biomarkers
Body weight and waist circumference were measured in the morning before breakfast on 2 days at baseline and 6, 12, and 24 months. Height was measured at baseline. Body mass index (BMI) was calculated as the weight in kilograms divided by the square of the height in meters. To evaluate the adherence to assigned diets, dietary intake was assessed in a random sample of 50% of the participants, by a review of the 5-day diet record at baseline and by 24-hour recall during a telephone interview on 3 nonconsecutive days at 6 months and 2 years. Biomarkers of nutrient intake were used to validate the self-reported adherence to macronutrient targets as follows: high-density lipoprotein cholesterol for carbohydrate, urinary nitrogen excretion for protein, and respiratory quotient for fat (13). Fasting blood samples were obtained on 1 day at baseline, 6 months, and 2 years. Plasma adiponectin levels were measured at the clinical laboratory at the Boston Children’s Hospital using an enzyme-linked immunosorbent assay from ALPCO Diagnostics (Salem, NH) as previously described (16).
Statistical analysis
The primary outcomes for this study were changes in appetite score, including the 4 component scales and adiponectin levels over the intervention. The general linear model (PROC GLM) for continuous variables and χ2 test (PROC FREQ) for categorical variables were applied for the comparison according to tertiles of the GRS at baseline. We compared changes in outcomes, biomarkers of adherence, and nutrient intakes across tertiles of the GRS at 6 months and 2 years by using general linear models. To test for gene–diet interactions, data were pooled for the factorial comparison by comparing low fat (20%) with high fat (40%), or average protein (15%) with high protein (25%). We examined GRS, diet, and GRS–diet interactions as independent predictors of changes in appetite and adiponectin, with adjustment for age, sex, ethnicity, baseline BMI, and baseline value for the respective outcome trait. Linear mixed models (PROC MIXED) using variance components structure were applied to test the genotype effect on the trajectory of changes in outcomes according to diet by including genotype–time interactions. In sensitivity analysis, we restricted the analysis to the white population to examine the robustness of potential interactions. Additive genetic models were used in the analyses. All P values were nominal and 2-sided, and a P of <0.05 was considered nominally significant. We further used a Bonferroni correction to adjust for multiple tests for potential interactions. Because 6 outcome traits were evaluated in our study, a P of <0.008 (0.05/6) was considered statistically significant after adjustment of multiple comparisons. Statistical analyses were performed with SAS version 9.4 (SAS Institute, Cary, NC).
Results
Baseline characteristics of participants according to tertiles of the GRS for higher adiponectin levels are shown in Table 1. The distribution of the GRS was not significantly different by sex or ethnicity. Body weight, BMI, and waist circumference at baseline did not differ across tertiles of the GRS. Dietary intakes of macronutrients and biomarkers of adherence were not related to the GRS, except that a higher GRS was significantly related to a reduced total energy intake (P < 0.001). The GRS was not significantly associated with cross-sectional measures of appetite, including cravings, fullness, prospective consumption, hunger, as well as the derived appetite score, or weight loss at 6 months and 2 years. As expected, the GRS was significantly associated with plasma adiponectin levels at baseline (Supplemental Fig. 2). With adjustment for age, sex, and ethnicity, each 1-point increment of the GRS was related to a 0.03 higher natural log-transformed adiponectin level (P = 0.04).
Baseline Characteristics of Participants According to Tertiles of the GRS for Higher Circulating Adiponectin Levels in the POUNDS Lost Trial
| Characteristic | Tertile of the GRS | |||
|---|---|---|---|---|
| T1 (n = 243) | T2 (n = 206) | T3 (n = 243) | Pa | |
| GRS | 5.9 ± 0.8 | 7.4 ± 0.3 | 8.7 ± 0.5 | |
| Age, y | 50.8 ± 8.8 | 51.6 ± 9.4 | 52.0 ± 9.0 | 0.19 |
| Female, % | 62.6 | 65.5 | 56.0 | 0.10 |
| White, % | 80.3 | 87.9 | 85.2 | 0.08 |
| Weight, kg | 94.2 ± 15.0 | 92.6 ± 15.9 | 93.6 ± 15.8 | 0.24 |
| BMI, kg/m2 | 33.0 ± 3.8 | 32.5 ± 4.0 | 32.7 ± 3.8 | 0.38 |
| Waist circumference, cm | 104.3 ± 12.5 | 102.7 ± 13.9 | 104.3 ± 12.9 | 0.30 |
| Diet group, % | 0.72 | |||
| High fat, high protein | 22.2 | 26.2 | 25.9 | |
| High fat, average protein | 23.9 | 27.2 | 25.9 | |
| Low fat, high protein | 28.4 | 22.8 | 22.6 | |
| Low fat, average protein | 25.5 | 23.8 | 25.5 | |
| Dietary intake per day | ||||
| Energy, kcal | 2034 ± 609 | 1934 ± 567 | 1883 ± 489 | <0.001 |
| Carbohydrate, % | 45.1 ± 7.7 | 45.0 ± 7.2 | 43.9 ± 7.9 | 0.36 |
| Fat, % | 37.4 ± 6.2 | 35.9 ± 5.7 | 37.5 ± 6.0 | 0.98 |
| Protein, % | 17.8 ± 3.2 | 18.7 ± 3.5 | 18.1 ± 3.4 | 0.64 |
| Biomarkers of adherence | ||||
| Respiratory quotient | 0.84 ± 0.04 | 0.84 ± 0.04 | 0.84 ± 0.04 | 0.78 |
| Urinary nitrogen, g | 12.1 ± 4.3 | 12.0 ± 4.2 | 12.4 ± 4.8 | 0.96 |
| Adiponectin median, IQR | 8.0, 6.0 | 9.0, 7.0 | 9.0, 9.0 | 0.01 |
| Appetite variables | ||||
| Appetite score | 49.1 ± 9.0 | 48.2 ± 9.4 | 49.3 ± 8.9 | 0.85 |
| Cravings | 51.5 ± 27.0 | 48.0 ± 25.8 | 53.8 ± 25.2 | 0.41 |
| Fullness | 63.6 ± 19.9 | 61.6 ± 20.0 | 64.9 ± 19.2 | 0.47 |
| Prospective consumption | 66.1 ± 17.2 | 65.8 ± 18.0 | 64.5 ± 16.8 | 0.34 |
| Hunger | 42.4 ± 19.8 | 40.7 ± 20.5 | 43.8 ± 19.4 | 0.41 |
| Weight loss at 6 mo, kg | 6.9 ± 5.8 | 6.5 ± 5.6 | 7.0 ± 5.8 | 0.78 |
| Weight loss at 2 y, kg | 3.9 ± 7.5 | 4.0 ± 7.3 | 4.8 ± 8.0 | 0.45 |
Values are means ± standard deviation for continuous variables and percentage for categorical variables unless otherwise indicated.
Abbreviation: IQR, interquartile range.
aP values were calculated by a χ2 test for categorical variables and an F test after adjusting for age, sex, and ethnicity for continuous variables.
Dietary intake was assessed to evaluate adherence to the assigned diet intervention in a random sample of 50% of participants (Table 2). A significant association was observed between a higher GRS and lower fat intake at borderline (P = 0.05). There were no significant differences in mean values of dietary intake of total energy, carbohydrate, or protein and biomarkers of adherence across tertiles of the GRS during the 2-year intervention (P > 0.05).
Nutrient Intake and Biomarkers of Adherence According to Tertiles of GRS for Higher Circulating Adiponectin Levels During the Intervention
| At 6 Months | At 2 Years | |||||||
|---|---|---|---|---|---|---|---|---|
| T1 | T2 | T3 | Pa | T1 | T2 | T3 | Pa | |
| Dietary intake per dayb | ||||||||
| Energy, kcal | 1619 ± 514 | 1637 ± 501 | 1594 ± 532 | 0.15 | 1533 ± 425 | 1621 ± 585 | 1439 ± 455 | 0.07 |
| Carbohydrate, % | 50.3 ± 10.2 | 50.3 ± 10.4 | 50.7 ± 10.4 | 0.34 | 49.1 ± 11.2 | 49.4 ± 9.4 | 49.3 ± 10.5 | 0.81 |
| Fat, % | 31.0 ± 8.5 | 30.4 ± 8.6 | 29.6 ± 7.7 | 0.05 | 31.2 ± 9.2 | 29.4 ± 8.6 | 31.4 ± 7.8 | 0.92 |
| Protein, % | 19.8 ± 4.4 | 19.9 ± 4.6 | 20.5 ± 4.7 | 0.25 | 20.0 ± 5.1 | 20.4 ± 3.7 | 20.3 ± 4.8 | 0.83 |
| Biomarkers of adherence | ||||||||
| Urinary nitrogen, gc | 11.7 ± 4.3 | 11.4 ± 4.7 | 11.5 ± 4.8 | 0.54 | 12.2 ± 4.5 | 11.5 ± 4.0 | 11.8 ± 4.9 | 0.29 |
| Respiratory quotientd | 0.84 ± 0.04 | 0.84 ± 0.04 | 0.84 ± 0.04 | 0.67 | 0.83 ± 0.04 | 0.83 ± 0.04 | 0.83 ± 0.04 | 0.67 |
Data are means ± standard deviation.
aP value was calculated by an F test after adjusting for age, sex, ethnicity, and high-/low-fat diet group.
b Sample size at 6 months: T1, n = 115; T2, n = 84; T3, n = 118. Sample size at 2 years: T1, n = 64; T2, n = 43; T3, n = 56.
c Sample size at 6 months: T1, n = 183; T2, n = 150; T3, n = 179. Sample size at 2 years: T1, n = 135; T2, n = 104; T3, n = 117.
d Sample size at 6 months: T1, n = 199; T2, n = 161; T3, n = 203. Sample size at 2 years: T1, n = 164; T2, n = 134; T3, n = 142.
In the present analysis, we tested interactions between the GRS and the intervention diets (2-by-2 factorial comparisons: low fat compared with high fat; average protein compared with high protein). Nominally, we found that dietary fat significantly modified genetic effects of adiponectin on changes in appetite score from baseline to 6 months (P for interaction = 0.014) after adjusting for age, sex, ethnicity, baseline BMI, and baseline value for respective outcome (Fig. 1). Of the individual components of appetite score, the strongest interaction was seen on prospective consumption (P for interaction = 0.017). The lower GRS was associated with a greater decrease in appetite (P < 0.001) and prospective consumption (P = 0.008) among participants consuming a high-fat diet, whereas no significant associations were observed in the low-fat diet group. Results did not appreciably change with further adjustment for baseline adiponectin levels or weight loss. Dietary fat intake also significantly modified the association between the GRS and changes in adiponectin levels from baseline to 6 months (P for interaction = 0.021). The lower GRS was associated with a greater increase in adiponectin in the low-fat diet group (P = 0.02), but it was not associated with changes in adiponectin in the high-fat group (P = 0.31). There was no significant interaction between the GRS and dietary fat on changes in cravings, fullness, or hunger (P for interaction > 0.05; data not shown). However, these GRS and diet interactions were not statistically significant after correction for multiple testing (P < 0.008 based on a Bonferroni correction for 6 tests). Findings were similar in whites only. In contrast, the GRS did not significantly interact with protein intake on changes in appetite and adiponectin. Additionally, with adjustment for age, sex, race, and baseline BMI, we did not observe strong correlations between weight loss and changes in appetite (r = 0.09) or prospective consumption (r = 0.13) at 6 months.
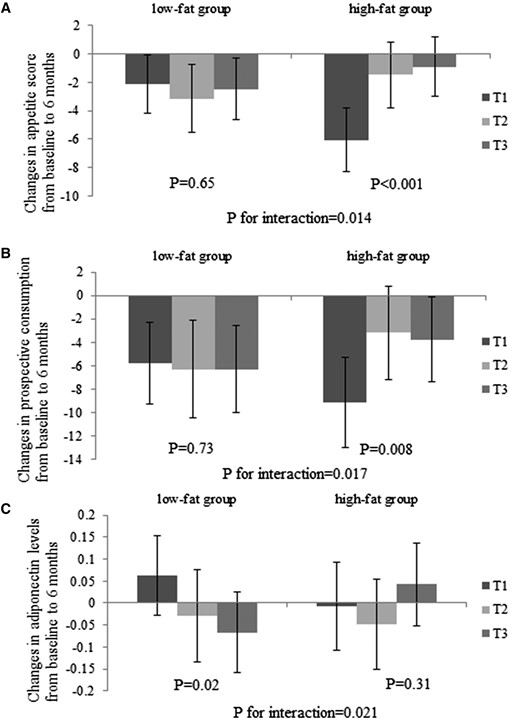
Effects of GRS for higher circulating adiponectin levels and high-/low-fat diets on changes in appetite score (A), prospective consumption (B), and plasma adiponectin levels (C) at 6 months. Values are means ± standard error after adjustment for age, sex, ethnicity, baseline BMI, and baseline value of the respective outcome trait. For changes in appetite, high-fat group sample sizes were T1, n = 92; T2, n = 88; and T3, n = 107; and low-fat group sample sizes were T1, n = 110; T2, n = 81; and T3, n = 97. For changes in adiponectin levels, high-fat group sample sizes were T1, n = 85; T2, n = 81; and T3, n = 100; and low-fat group sample sizes were T1, n = 108; T2, n = 81; and T3, n = 102.
We found that among the 5 SNPs included in the calculation of the GRS, ADIPOQ rs6810075 showed the strongest interaction with fat intake on changes in appetite score (P for interaction = 0.026) and adiponectin levels (P for interaction = 0.058; Fig. 2) between baseline and 6-month follow-up. The adiponectin-reducing C allele was associated with a greater reduction in appetite among individuals consuming a high-fat diet (P = 0.002), whereas no significant association was observed in the low-fat diet group (P = 0.92).
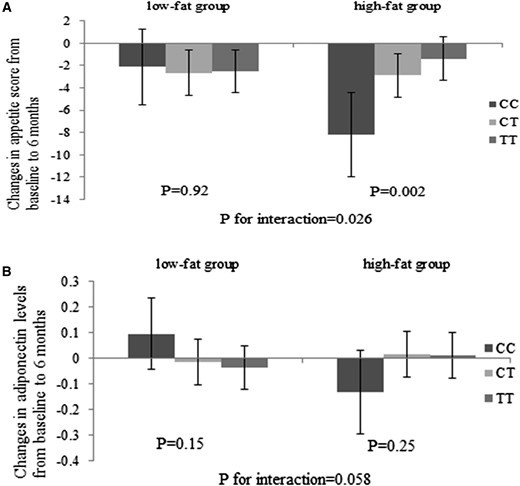
Effects of ADIPOQ rs6810075 genotype and high-/low-fat diets on changes in appetite (A) and plasma adiponectin levels (B) at 6 months. Values are means ± standard error after adjustment for age, sex, ethnicity, baseline BMI, and baseline value of the respective outcome trait. For changes in appetite, high-fat group sample sizes were CC, n = 28; CT, n = 129; and TT, n = 130; and low-fat group sample sizes were CC, n = 35; CT, n = 121; and TT, n = 132. For changes in adiponectin levels, high-fat group sample sizes were CC, n = 28; CT, n = 115; and TT, n = 123; and low-fat group sample sizes were CC, n = 39; CT, n = 120; and TT, n = 132.
We then used linear mixed models to evaluate whether the genetic effect on appetite score, prospective consumption, and adiponectin levels differ by time during the 2-year intervention in low- and high-fat diet groups (Fig. 3). In the high-fat diet group, we found significant interactions between the GRS and intervention time on changes in appetite score and prospective consumption (P for interaction of <0.001 and 0.002, respectively). Compared with participants with a higher GRS, those with a lower GRS had greater reductions in appetite score and prospective consumption from baseline to 6 months, which, however, increased substantially from 6 months to 2 years. In the low-fat diet group, a significant genotype by time interaction was observed on changes in adiponectin (P for interaction = 0.02). Participants with a lower GRS had a greater increase in adiponectin levels from baseline to 6 months, whereas those with a higher GRS showed greater increase in adiponectin after 6 months.
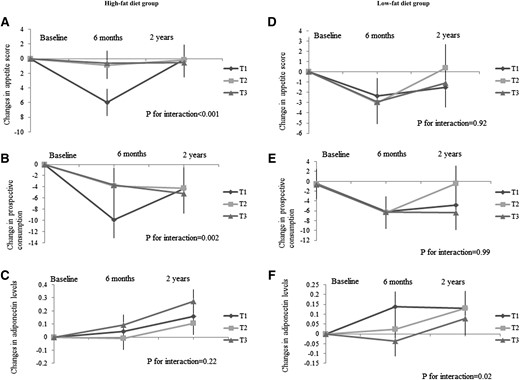
Effects of the GRS for higher circulating adiponectin levels on the trajectory of changes in appetite score (A and D), prospective consumption (B and E), and plasma adiponectin levels (C and F) during 2 years in the high-fat/low-fat diet group. Values are means ± standard error after adjustment for age, sex, ethnicity, baseline BMI, and baseline value of the respective outcome trait. Linear mixed models (PROC MIXED) were used to test the genetic effect on the trajectory of changes in appetite and adiponectin levels, with P for interaction testing the interaction between GRS and intervention time. For changes in appetite, high-fat group sample sizes were 6 months: T1, n = 92; T2, n = 88; and T3, n = 107; and 2 years: T1, n = 72; T2, n = 69; and T3, n = 76; low-fat group sample sizes were 6 months: T1, n = 110; T2, n = 81; and T3, n = 97; and 2 years: T1, n = 87; T2, n = 62; and T3, n = 67. For changes in adiponectin levels, high-fat group sample sizes were 6 months: T1, n = 85; T2, n = 81; and T3, n = 100; and 2 years: T1, n = 70; T2, n = 73; and T3, n = 69; low-fat group sample sizes were 6 months: T1, n = 108; T2, n = 81; and T3, n = 102; and 2 years: T1, n = 97; T2, n = 75; and T3, n = 80.
Discussion
In the 2-year randomized weight-loss intervention, we found nominally significant interactions between genetic variations of circulating adiponectin and dietary fat intake in relationship to changes in appetite and adiponectin levels. By choosing a hypocaloric and high-fat weight-loss diet, individuals with genetic predisposition to lower adiponectin levels exhibited a greater reduction of appetite, particularly during the weight loss phase. In the low-fat diet group, the GRS for lower adiponectin was associated with a greater increase in adiponectin levels.
In addition to the antiatherogenic, anti-inflammatory, and insulin-sensitizing effects, adiponectin may play a pivotal role in the regulation of appetite and energy homeostasis in the central nervous system (4, 5). Adiponectin was shown to be present in the brain (17), and peripherally administered adiponectin entered the cerebrospinal fluid from the circulation (6, 18). Moreover, adiponectin receptors AdipoR1 and AdipoR2 were found to be abundantly expressed in the hypothalamus, the key region for appetite regulation (17). Studies investigating the effects of adiponectin on appetite in rodents have yielded mixed results, with either increased (6) or reduced (7) food intake or a lack of an effect on food intake (18). In humans, adiponectin levels were shown to be altered in patients with eating disorders such as anorexia nervosa and binge eating disorder (8, 9). A recent study reported an association between adiponectin gene variants that are linked to increased circulating adiponectin level and increased disinhibition and hunger (10). Taken together, these data support an important role of adiponectin in the central regulation of appetite and eating behavior.
Dietary macronutrient compositions may affect appetite. Several previous dietary intervention studies have reported greater decreases in hunger with a high-fat diet compared with a low-fat diet (19, 20). It has been suggested that protein intake might also affect satiety (21). Our results showed that genetic variations associated with lower circulating adiponectin levels were related to better responses in appetite to a high-fat diet or, equivalently, a low-carbohydrate diet. However, dietary protein did not show significant modification. These findings were consistent with prior evidence that adiponectin-deficient mice showed decreased food intake, exhibiting resistance to obesity induced by a high-fat diet (6). The biological mechanisms underlying the interactions between adiponectin genetic variation and dietary fat intake remained unclear. Adiponectin is mainly derived from adipose tissue, the metabolism and secretory functions of which are significantly influenced by fat intake (22). In our study, genetic variations associated with lower circulating adiponectin levels were related to a greater increase in adiponectin levels in response to a low-fat diet. Consistently, we previously reported that men, whose adiponectin levels were lower compared with women, showed a greater increase in adiponectin in response to low-fat diets (23). These data indicate that individuals with varying genetic architecture of circulating adiponectin may respond divergently to fat intake, and the genetic effects on appetite may be partly through the alteration of adiponectin levels.
We also demonstrated the “reversion” patterns of changes in appetite and adiponectin levels in the weight regain phase. These changes were in line with the diminished adherence to macronutrient goals and steady weight regain 6 months after initiation of the diet, as seen in the POUNDS Lost trial and other weight-loss dietary interventions (13, 24). Future studies are needed to better understand the roles that changes in the psychological scales play in the determination of adherence to diet and weight-loss effects.
In the present study, we investigated the interactions between adiponectin genetic variations and popular weight-loss diets on appetite in a large and long-term dietary intervention trial. Our findings provide novel insights into the role of genetic variations of adiponectin levels in the regulation of food intake and energy balance. However, potential limitations should be considered when interpreting our findings. First, the power to detect a long-term genotype effect in response to real differences in macronutrient intake was reduced because the adherence to various diets declined after 6 months. Second, although we included both whites and blacks, replication in diverse populations would be needed to verify our findings. Third, we acknowledged that middle-molecular-weight and low-molecular-weight adiponectin, which were unfortunately not available in our study samples, might play a pivotal role in appetite regulation (6). A more thorough assessment of specific forms of adiponectin is needed to further our understanding of their roles in the regulation of appetite in the context of dietary interventions. Fourth, our results became not significant when a Bonferroni correction was applied to control for multiple testing. However, it has been acknowledged that a Bonferroni correction is too conservative in particular when test statistics are highly correlated, which is the case in our present study. Finally, circulating adiponectin levels are also influenced by other loci, and therefore the use of the calculated GRS in the present study might not fully reflect information in genetic determinants of adiponectin levels.
In conclusion, we showed that genetic variations of circulating adiponectin modified changes in appetite in response to weight-loss diets in a 2-year randomized trial. With a low-calorie, high-fat diet, individuals with genetic predisposition to lower adiponectin levels may benefit more in a decrease of appetite, in particular a greater reduction of prospective consumption during the weight loss phase. A better understanding of the genetic determinants of appetite related to adiponectin will provide supportive evidence for potential personalized dietary intervention to achieve maximum effects.
Abbreviations:
- BMI
body mass index
- GRS
genetic risk score
- GWAS
genome-wide association study
- POUNDS Lost
Preventing Overweight Using Novel Dietary Strategies
- SNP
single nucleotide polymorphism
Acknowledgments
We are particularly grateful to all participants in the POUNDS Lost trial for their dedication and contribution to the research.
This work was supported by National Heart, Lung, and Blood Institute Grants HL071981, HL034594, and HL126024; National Institute of Diabetes and Digestive and Kidney Diseases Grants DK091718, DK100383, DK078616; Boston Obesity Nutrition Research Center Grant DK46200; and by United States–Israel Binational Science Foundation Grant 2011036. L.Q. was a recipient of American Heart Association Scientist Development Award 0730094N. The funders had no role in the design or conduct of the study; collection, management, analysis, or interpretation of the data; or preparation, review, or approval of the manuscript.
Author contributions: W.M. conceived and designed the study, performed statistical analysis, interpreted the data, drafted the manuscript, critically revised the manuscript for important intellectual content, and approved the final manuscript for submission. T.H., Y.H., T.W., and D.S. gave statistical advice, interpreted the data, critically revised the manuscript for important intellectual content, and approved the final manuscript for submission. J.T., D.A.W., G.A.B., and F.M.S. critically revised the manuscript for important intellectual content and approved the final manuscript for submission. L.Q. conceived and designed the study, gave statistical advice, interpreted the data, drafted the manuscript, critically revised the manuscript for important intellectual content, and approved the final manuscript for submission. L.Q. takes full responsibility for the work.
Clinical trial registry: ClinicalTrials.gov no. NCT00072995 (registered 13 November 2003).
Disclosure Summary: The authors have nothing to disclose.
References
Author notes
Address all correspondence and requests for reprints to: Lu Qi, MD, PhD, Department of Epidemiology, School of Public Health and Tropical Medicine, Tulane University, New Orleans, Louisiana 70112. E-mail address: [email protected].
