


Abstract
The Women’s Health Initiative (WHI) hormone therapy (HT) trials showed protection against hip and total fractures, but a later observational report suggested loss of benefit and a rebound increased risk after cessation of HT.
The purpose of this study was to examine fractures after discontinuation of HT.
Two placebo-controlled randomized trials served as the study setting.
Study patients included WHI participants (N = 15,187) who continued active HT or placebo through the intervention period and who did not take HT in the postintervention period.
Trial interventions included conjugated equine estrogen (CEE) plus medroxyprogesterone acetate (MPA) in naturally menopausal women and CEE alone in women with prior hysterectomy.
Total fractures and hip fractures through 5 years after discontinuation of HT were recorded.
Hip fractures were infrequent (∼2.5 per 1000 person-years); this finding was similar between trials and in former HT and placebo groups. There was no difference in total fractures in the CEE + MPA trial for former HT vs former placebo users (28.9 per 1000 person-years and 29.9 per 1000 person-years, respectively; hazard ratio [HR], 0.97; 95% confidence interval [CI], 0.87 to 1.09; P = 0.63); however, in the CEE-alone trial, total fractures were higher in former placebo users (36.9 per 1000 person-years) compared with the former active group (31.1 per 1000 person-years), a finding that was suggestive of a residual benefit of CEE against total fractures (HR, 0.85; 95% CI, 0.73 to 0.98; P = 0.03).
We found no evidence for increased fracture risk, either sustained or transient, for former HT users compared with former placebo users after stopping HT. There was residual benefit for total fractures in former HT users from the CEE-alone study.
Although hormone therapy (HT) in postmenopausal women can reduce the risk of fractures, there is some uncertainty about the risk of fractures after HT is stopped. There were 2 HT trials as part the Women’s Health Initiative (WHI). In 1 trial, women with an intact uterus were randomly assigned to receive conjugated equine estrogen (CEE) at a dose of 0.625 mg plus 2.5 mg medroxyprogesterone acetate (MPA) per day (n = 8506) or placebo (n = 8102); this was the CEE + MPA trial (1, 2). In the other trial, women with a prior hysterectomy received CEE at a dose of 0.625 mg per day (n = 5310) or placebo (n = 5429); this was the CEE-alone trial (3, 4). In both of these trials, women in the active arms showed relevant and similar reductions in total fractures collectively (CEE + MPA hazard ratio [HR], 0.76; 95% confidence interval [CI], 0.69 to 0.85; CEE-alone HR, 0.70; 95% CI, 0.6 to 0.79) and in hip fractures specifically (CEE + MPA HR, 0.66; 95% CI, 0.45 to 0.96; CEE-alone HR, 0.65; 95% CI, 0.45 to 0.94). The CEE + MPA trial was stopped 2.4 years early because of an overall unfavorable balance of risks to benefits; the CEE-alone trial was stopped nearly 1 year early because of an increased risk of stroke and little likelihood of altering the balance of risk to benefit by the planned trial termination date (CEE + MPA median intervention period of 5.6 years; CEE-alone median intervention period of 7.1 years).
As a consequence of the publicity surrounding the early termination of these trials, many postmenopausal women reduced or discontinued their HT use (5). A large observational study (n = 140,584) suggested that, compared with never-users, the risk for hip fracture over a 12-month observation period was significantly increased in women who discontinued HT within the previous 5 years (6). Results from long-term follow-up of WHI participants (median postintervention follow-up of 8.2 years for the CEE arm and 6.6 years for the CEE + MPA arm) suggested that the benefits of HT for fracture reduction were reduced soon after stopping, but fracture rates for hip fractures were not higher for women who stopped active treatment compared with former placebo users in either trial (7–9).
The purpose of the current study was to compare, in participants assigned to HT or placebo and who continued to receive the study drug until the intervention phase was stopped, rates of total fractures and hip fractures early after stopping and up to 5 years after stopping therapy in the 2 WHI HT trials. Subjects included 15,187 women who completed the intervention period and did not take HT in the postintervention period.
Methods
Details of the WHI trials and baseline characteristics have been reported previously (1, 2). The protocol and consent forms were approved by institutional review boards at participating institutions, and all women provided written informed consent. Women were eligible for inclusion in this study if they were still enrolled at the end of the intervention period, had not stopped their study drug during the intervention period, and did not take HT in the postintervention period. After termination of the intervention phase of the clinical trials, health outcomes continued to be monitored through semiannual contacts in the same manner that monitoring was performed during the intervention phase.
Risk factors for osteoporosis
Risk factors for fractures were assessed in a standardized manner by questionnaire, interview, and clinical examination, as previously described. Body mass index (BMI) was calculated as weight in kilograms (measured on a balance beam scale) divided by height in meters squared (measured on a fixed stadiometer). Information regarding age, current smoking, ethnicity, years since menopause, alcohol intake, physical activity, prior fractures, frequency of falls, prior use of HT, and use of bone-active medications was obtained by questionnaire. Average daily calcium intake was the sum of dietary calcium intake (as assessed using a modification of the Block food frequency questionnaire) plus calcium intake via the use of calcium supplements during the previous 2 weeks (obtained through an interviewer-administered medication survey).
Outcomes
Reports of hip and total fractures (excluding chest/sternum, ribs, skull/face, fingers, toes, and cervical vertebrae) were ascertained by semiannual questionnaire and confirmed locally by radiographic report. All reported hip fractures were confirmed by central adjudication; adjudicators were blinded to treatment assignment. The procedure for fracture ascertainment during the extension period was the same as that used during the clinical trial except that there was no adjudication of nonhip fractures.
Statistical analyses
Primary analyses used time-to-event methods. As in previous reports, HRs and nominal 95% CIs were calculated from Cox proportional hazards models, first without adjustments, and then with adjustments for age, prior fracture history, and randomization status in the Dietary Modification trial one of several substudies of WHI (10).
The effect on modification of fracture risk after study medication discontinuation by potential risk factors was assessed by Cox proportional hazards analyses. Three analyses were performed: (a) without any covariates or strata; (b) with adjustments for age and ethnicity, and stratification by 10-year age group; (c) with adjustments for age, ethnicity, years since menopause, BMI, duration of previous HT, smoking, alcohol, physical activity, prior fractures, falls in the previous year, calcium intake, vitamin D intake, bone-active medication use, and fractures before HT discontinuation, stratified by 10-year age group at screening. Formal tests for interaction were determined for each risk factor. For categorical variables, interaction was determined across strata.
We also performed a sensitivity analysis of data from women who had been adherent to their study medication (having taken ≥80% of study medication) to estimate the influence of reduced adherence on fracture outcomes.
Results
Baseline characteristics of women who were included in these analyses of the postintervention follow-up phase (Table 1), including risk factors for low bone mass and fractures, were similar to the characteristics of women overall at initial random assignment. Participant characteristics between the 2 trials were similar with respect to age, percent with prior fracture, and smoking. Compared with participants in the CEE + MPA trial, women in the CEE-alone trial reported a greater number of years since menopause (∼19 years for the CEE-alone trial vs ∼13 years for the CEE + MPA trial), higher prevalence of prior HT use (∼50% for CEE-alone trial vs ∼25% for CEE + MPA trial), and longer HT use before entry into the trials (∼3 years for both CEE-alone former placebo and former active groups; ∼1 year for both CEE + MPA former placebo and former active groups). Alcohol use was more prevalent in CEE + MPA participants (∼38%) compared with CEE-alone participants (∼30%). In the CEE + MPA trial, ∼84% of participants were white, whereas in the CEE-alone trial, ∼75% were white. By the end of the intervention period of the CEE + MPA trial, 57.3% of HT and 57.7% of placebo participants had not been compliant with study medication (having taken <80% of study medication); in the CEE-alone trial, 59% of the HT and 53% of the placebo participants were noncompliant.
Characteristics of Participants at the Start of the Intervention Period
| CEE + MPA Former Placebo (n = 5159) | CEE + MPA Former Active HT (n = 4975) | CEE-Alone Former Placebo (n = 2532) | CEE-Alone Former Active HT (n = 2521) | |||||
|---|---|---|---|---|---|---|---|---|
| Mean (SD) | Mean (SD) | Mean (SD) | Mean (SD) | |||||
| Age at screening (y) | 63.3 (7.0) | 62.6 (7.0) | 63.5 (7.2) | 62.9 (7.0) | ||||
| Years since menopause | 13.3 (8.1) | 12.7 (8.2) | 19.0 (9.6) | 18.4 (9.5) | ||||
| Years of prior HT use | 0.9 (2.8) | 1.1 (3.0) | 3.2 (5.9) | 3.7 (6.5) | ||||
| n | % | n | % | n | % | n | % | |
| Current/past HT use at baseline | 1256 | 24.36 | 1347 | 27.09 | 1244 | 49.15 | 1283 | 50.91 |
| White | 4399 | 85.27 | 4223 | 84.88 | 1937 | 76.50 | 1938 | 76.87 |
| Current/past smoker at baseline | 2459 | 48.24 | 2407 | 48.85 | 1193 | 47.59 | 1166 | 46.70 |
| Alcohol intake: ≥1 drink/wk | 2004 | 39.14 | 1850 | 37.49 | 742 | 29.50 | 749 | 30.04 |
| Prior fracture | 1878 | 38.60 | 1708 | 37.75 | 922 | 40.02 | 909 | 39.37 |
Clinical osteoporosis fracture outcomes
The number of hip fractures was small (∼2.5 per 1000 patient-years) and not different over 5 years after stopping HT/placebo between the 2 trials or between past active and past placebo users (Fig. 1; Table 2). The visual appearance of the Kaplan-Meier curves suggests a lingering benefit through 1 year for former HT users in the CEE + MPA trial and through 2 years for former HT users in the CEE-alone trial, but the differences between groups were not statistically significant at either 1 year or 2 years (data not shown). At no time, in either of the 2 trials, did there seem to be an increased risk of hip fractures for former HT users compared with former placebo participants. The magnitude of the associations were similar after adjustment for age, ethnicity, years since menopause, BMI, duration of previous HT, smoking, alcohol intake level, physical activity level, prior fracture, number of falls in the past year, calcium intake, vitamin D intake, use of bone-active medications, and stratification by 10-year age group at screening, and with no apparent interactions.
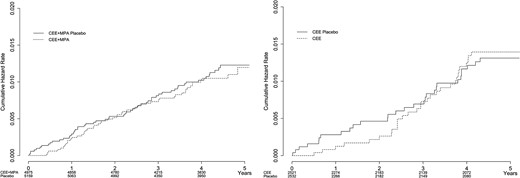
Kaplan-Meier curves for hip fractures.
Numbers and Annualized Rates (%) for Hip Fractures
| Placebo | Treatment | HR | Lower CL | Upper CL | P | |||||||
|---|---|---|---|---|---|---|---|---|---|---|---|---|
| n | Hip Fractures | Follow-Up (mo) | % | n | Hip Fractures | Follow-Up (mo) | % | |||||
| CEE + MPA | 5159 | 56 | 50.1 | 0.26 | 4975 | 50 | 49.95 | 0.24 | 0.93 | 0.63 | 1.36 | 0.70 |
| CEE alone | 2532 | 29 | 51.4 | 0.27 | 2521 | 30 | 51.50 | 0.28 | 1.04 | 0.62 | 1.73 | 0.89 |
Abbreviation: CL, confidence limit.
With regard to total fractures (Fig. 2; Table 3), in the CEE + MPA trial there was no difference between former HT users and former placebo users over 5 years; at no time did the risk for all fractures increase above the risk in former placebo users. However, in the CEE-alone trial, overall fracture rates were consistently lower in the former HT users compared with former placebo users across the entire 5-year postintervention period. There were no apparent changes in these findings after adjusting for age, ethnicity, years since menopause, BMI, duration of previous HT, smoking, alcohol intake, physical activity level, prior fracture, number of falls in the past year, calcium intake, vitamin D intake, use of bone-active medications, and stratification by 10-year age group at screening.
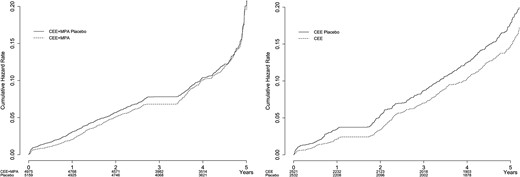
Kaplan-Meier curves for total fractures.
Numbers and Annualized Rates (%) for Total Fractures
| Placebo | Treatment | HR | Lower CL | Upper CL | P value | |||||||
|---|---|---|---|---|---|---|---|---|---|---|---|---|
| n | Total Fractures | Follow-Up (mo) | % | n | Total Fractures | Follow-Up (mo) | % | |||||
| CEE + MPA | 5159 | 612 | 47.6 | 2.99 | 4975 | 572 | 47.78 | 2.89 | 0.97 | 0.87 | 1.09 | 0.63 |
| CEE alone | 2532 | 378 | 48.5 | 3.69 | 2521 | 321 | 49.15 | 3.11 | 0.85 | 0.73 | 0.98 | 0.03 |
Abbreviation: CL, confidence limit.
Because of the difference in years since menopause between CEE + MPA and CEE-alone participants, we examined fracture rates for tertiles of years since menopause for the CEE + MPA and combined cohorts and found no significant differences between former HT and former placebo users. The sensitivity analysis restricting evaluation to women who had been adherent to their study medication (having taken ≥ 80% of medication) produced findings that were similar for the overall population, but in the persistent subgroup, the difference for total fractures was not significant for CEE-alone active users compared with the CEE-alone former placebo group, possibly because of the smaller number of events and participants.
Discussion
Overall, our results are consistent with previous reports that show a loss of protection against hip fracture soon after discontinuation of HT, but are reassuring in that there appears to be no rebound increase in risk for either hip fractures or total fractures for women who stop HT. The diminishing benefit on fracture reduction after HT discontinuation was remarkably consistent irrespective of age, ethnicity, years since menopause, BMI, duration of previous HT, smoking, alcohol intake, physical activity level, prior fractures, falls in the previous year, calcium intake, vitamin D intake, or use of bone-active medications. These data do not further elucidate whether this loss of protection against fracture reflects increased bone turnover, accentuated bone loss, or other yet unidentified factors.
An unexpected finding was the apparent persistence of a reduction in total fractures through 5 years after stopping HT in the CEE-alone trial. Compared with CEE + MPA participants, fracture rates were higher in the CEE-alone trial for both former placebo users and former HT users. An obvious difference between participants in the 2 trials was longer years since menopause in the CEE-alone trial, but analysis of the CEE + MPA and overall cohorts did not show a significant effect of years since menopause on fracture rates.
There have been previous reports on fracture risk in the postintervention period of the WHI that used intention-to-treat analyses and included women who resumed HT on their own (approximately 4% of the total number of trial participants). Heiss et al. (7) showed no increased risk or residual benefit for prior HT use on hip fractures or total fractures over a median follow-up of 2.4 years in the postintervention period for the CEE + MPA arm. LaCroix et al. (8) showed no increased risk or residual benefit for prior HT use on hip fractures over a median follow-up of 4.8 years in the postintervention period for the CEE-alone arm, but did not report total fractures. An extensive long-term follow-up by Manson et al. (9) extended postintervention follow-up to 8.2 years for the CEE + MPA trial and 6.6 years for the CEE-alone trial; the investigators found no increased risk or residual benefit of prior HT for hip fractures but did not report total fractures.
Over 45% of women in the WHI HT trial discontinued the study drug during the course of the intervention period, but many remained in the study. To adequately assess the effect of stopping HT, for this analysis, we included only women who continued to receive the study drug until the end of the intervention and excluded those who received HT in the postintervention period (∼4%). Also, in prior analyses, only the first fracture counted; if a woman had her first fracture during the intervention period but experienced a subsequent fracture in the postintervention period, she would be counted in our analysis but would not have been counted in the previously published analyses (7–9).
Our study has several strengths. It is an observational follow-up study of randomized cohorts, which reduces observational bias and eliminates ascertainment bias (i.e., women underwent similar surveillance whether they were former HT or placebo users). Given that bone mineral density (BMD) testing was performed in only a subset of women at 3 centers, we could not control for BMD in these analyses.
Information on use of bone-active agents in the postintervention period was collected annually for 5 years in the CEE-alone trial and for only 3 years in the CEE + MPA trial; however, duration of use was not recorded. In both trials, slightly more former placebo users than former active users reported taking bone-active medication (in the CEE-alone trial, ∼16% to 19% of former placebo users compared with ∼13% to 15% of former active users, year-by-year for years 1 through 5; in the CEE + MPA trial, ∼22% to 23% of former placebo users compared with 20% to 21% of former active users year-by-year for years 1 through 3). If there was any effect from the use of bone-active agents, fracture rates would be expected to be reduced in the former placebo groups, biasing results against a neutral finding.
Although we did not have information on BMD or bone turnover markers in our study, others have shown that rapid loss of BMD and increases in bone turnover markers to or above the pretreatment baseline occur 12 to 24 months after stopping estrogen (11, 12). Similar findings have been observed after discontinuation of denosumab (13). There is some information to suggest that there is no increase in total fractures after cessation of denosumab (14); however, recent anecdotal reports raise the question of an increased risk of vertebral fractures (15–17). In the WHI, we only have information about clinical (not radiographic) vertebral fractures. There were few reported clinical vertebral fractures in the postintervention period (in the CEE + MPA trial, 45 fractures [0.22%] in the former placebo group and 49 [0.25%] in the former active group; in the CEE-alone trial, 33 fractures [0.32%] in the former placebo group and 39 [0.28%] in the former active group). There were no significant between-group differences in the 2 trials (in the CEE + MPA trial: HR, 1.13; 95% CI, 0.72 to 1.78; in the CEE-alone trial: HR, 0.78; 95% CI, 0.42 to 1.44).
In summary, we have shown that discontinuation of HT results in a rapid disappearance of benefit for hip fracture reduction after medication discontinuation but no rebound increase in fracture risk, and possibly residual benefit against total fractures for women stopping CEE alone. These findings should help to inform clinicians and women about the effects of discontinuation of HT on fracture risk.
Abbreviations:
- BMD
bone mineral density
- BMI
body mass index
- CEE
conjugated equine estrogen
- CI
confidence interval
- HR
hazard ratio
- HT
hormone therapy
- MPA
medroxyprogesterone
- WHI
Women’s Health Initiative
Acknowledgments
The authors thank Chunyuan Wu and Mary Pettinger for data analyses.
Disclosure Summary: N.B.W. has served as a consultant to Amgen, AbbVie, and Radius and receives honoraria for speaking from Amgen and Shire. A.Z.L. serves on scientific advisory boards for Amgen and Sermonix and as a consultant to Pfizer. L.S.P. has served on scientific advisory boards for Boehringer Ingelheim, Janssen, and the Profil Institute for Clinical Research and receives or has received research support from Merck, Amylin, Eli Lilly, Novo Nordisk, Sanofi, PhaseBio, Roche, AbbVie, Vascular Pharmaceuticals, Janssen, GlaxoSmithKline, and the Cystic Fibrosis Foundation. L.S.P. is supported in part by FDA award RO1FD003527, VA awards HSR&D IIR 07-138 and I01-CX001025, NIH awards R21DK099716, DK066204, U01 DK091958, U01 DK098246, P30DK111024, a Cystic Fibrosis Foundation award PHILLI12A0 and by the Veterans Health Administration (VA). This work is not intended to reflect the official opinion of the VA or the U.S. government. The remaining authors have nothing to disclose.
References
Author notes
Address all correspondence and requests for reprints to: Nelson B. Watts, MD, Mercy Health Osteoporosis and Bone Health Services, 4760 E Galbraith Road, Suite 212, Cincinnati, Ohio 45236. E-mail: [email protected].
