


Abstract
Type 1 and type 2 diabetes mellitus are associated with an increased risk of fracture.
The objective of the study was to compare the bone structure and density between type 1 and type 2 diabetes patients and to investigate fracture associations.
This was a cross-sectional study.
Physician-diagnosed type 1 and type 2 diabetes patients were included from the outpatient clinics at two university hospitals participated in the study.
Bone density and structure were assessed by dual-energy x-ray absorptiometry and high-resolution peripheral quantitative computed tomography. Blood samples were collected for bone turnover markers. Prevalent vertebral fractures were assessed by vertebral fracture assessment and x-ray, and incident fractures were collected from The Danish National Hospital Discharge Register.
Bone mineral density (BMD) was higher in type 2 than type 1 diabetes patients at the hip, femur, and spine; however, only the hip differed in multivariate-adjusted models. Bone tissue stiffness at the tibia was increased in type 2 diabetes patients also in adjusted models. Sclerostin levels were inversely associated with fracture in type 1 diabetes patients. The patients with the highest tertile of sclerostin had an 81% decreased risk of a fracture compared with the lowest tertile.
Type 1 and type 2 diabetes patients differ in BMD of the hip and tissue stiffness at the tibia. Sclerostin may be a marker independent of BMD to predict fractures in type 1 diabetes patients and thus potentially of clinical importance. Studies with longer follow-up are needed.
Diabetes mellitus is associated with an increased risk of fracture (1, 2). Bone mineral density (BMD) and other risk markers underestimate the fracture risk in diabetes patients (1, 3). Hypoglycemic events and self-reported falls do not explain the increased fracture risk in diabetes patients (4–6). Therefore, current fracture predictors do not explain the increased fracture risk in patients with diabetes, nor do they explain why the difference in hip fracture risk with a 7-fold increase in patients with type 1 and 1.4-fold increase in type 2 diabetes (1). Only a few studies have investigated bone differences between type 1 diabetes patients and type 2 diabetes patients. Studies have reported lower hip and femoral neck BMD in type 1 diabetes patients compared with type 2 diabetes patients (7, 8) and lower hip and spine BMD in women with type 1 diabetes (9). However, other studies reported no differences in radius, spine, or femoral neck BMD (8, 10–12). High-resolution peripheral quantitative computed tomography (HRpQCT) discriminated type 2 diabetes patients with and without a fracture by cortical porosity and intracortical pore volume (13). Volumetric BMD (vBMD) assessed by HRpQCT did not differ between type 2 diabetes patients and controls (14, 15), whereas vBMD was lower in patients with type 1 diabetes compared to controls (16).
The aim of this study was to investigate whether differences in bone density and structure may explain differences in fracture rates by comparing patients with type 1 and type 2 diabetes. Furthermore, predictors of fracture in patients with diabetes were examined.
Results on bone turnover markers have previously been reported (17).
Materials and Methods
The Strengthening the Reporting of Observational Studies in Epidemiology guideline for reporting cross-sectional studies was followed (18). The trial was registered at https://clinicaltrials.gov/ct2/show/NCT01870557) and was approved by the Danish Data Protection Agency and the Ethics Committee of the Central Denmark Region. The study was conducted according to the Helsinki Declaration. All participants gave informed consent prior to the study.
Design, setting, and participants
A cross-sectional design was used and associations between fractures and bone markers were analyzed in a case control design. Cases were diabetes patients with a vertebral fracture or incident fracture, and controls were diabetes patients without a vertebral fracture or incident fracture. The cases and controls were not matched. Patients were recruited at the outpatient clinics from the two study centers: Aarhus University Hospital (n = 121) and Aalborg University Hospital (n = 76).
Inclusion criteria were age 50 years or older, elevated glycated hemoglobin A1c (HbA1c) level of at least 6.6% (49 mmol/mol) within the last year (one individual presented no HbA1C within the last year but an elevated value within the last 2 y), and estimated glomerular filtration rate of 50 mL/min or greater. All participants received antidiabetic treatment (insulin, incretin, and oral antidiabetic therapy) with no drug type alterations within the last 6 months. Exclusion criteria were kidney disease, uncontrolled thyroid disease, New York Heart Association class IV heart failure, and diseases or conditions affecting bone. Treatment with antiepileptics, glucocorticoids, lithium, bone antiresorptive treatment, estrogen treatment, and bone anabolic treatment was an exclusion criterion. One individual received bisphosphonate treatment 1 month before examination. Female participants were all postmenopausal except for two who had regular menstrual cycles.
Variables and data sources
Patients were interviewed by a medical doctor for diabetes related complications, medication use, and lifestyle factors. Height and weight were measured and body mass index (BMI) calculated. Diabetes duration at the year of examination was registered. Smoking was categorized as current smokers and non smokers. Alcohol use was expressed as units of alcohol per week. Microvascular complications were ascertained by self reporting and validated by diagnosis codes from the Danish National Hospital Discharge Register. Blood sample collection and analysis is described elsewhere (17).
Trained staff performed dual-energy x-ray absorptiometry (DXA) on all but one subject who experienced extreme dizziness. Two Hologic Discovery scanners were used at Aarhus University Hospital and two Lunar Prodigy scanners were used at Aalborg University Hospital.
Coefficient of variation (CV) and differences in measurement were evaluated by a repeat scanned Hologic Discovery phantom. The intrascanner precision CVs were 1% for both Hologic Discovery and Lunar Prodigy scanners. The Hologic Discovery scanner with most individuals scanned was selected as reference. The Lunar Prodigy scanners measured BMD significantly higher than the reference (14% and 15%, respectively), and the other Hologic Discovery scanner measured 2% higher, which was statistically significant. BMD was recalculated based on the conversion factors. T-scores were calculated based on extrapolation of the results reported by Kelly (19).
An HRpQCT scan was performed at one of the two study sites. Patients at Aarhus University Hospital were examined by the HRpQCT scan (Xtreme CT; Scanco Medical) at the radius and tibia. A standard operating procedure was followed. Patients were scanned on the right limb unless there was a history of fracture. The tibia could not be scanned in two patients and the radius in four patients due to too large limbs or poor quality of the images. For each scan a two-dimensional scout view was performed to define the measurement region using a threshold of 9.5 mm and 22.5 mm for the radius and tibia, respectively. At each site 110 images were obtained. All images were graded based on manufacturers suggestions from 1 to 5 (1 = best, 5 = worst), and images graded 4 or 5 required a rescan. Scans were analyzed with software provided by Scanco. Standard evaluation analysis, finite element analysis, and cortical evaluation were performed. To ensure repeatability, all scans and evaluations were performed by J.S.-L. The precision CVs were 0.7% and 1% for the tibia and radius, respectively.
At Aarhus University Hospital, vertebral fractures were assessed by vertebral fracture assessment (VFA), measurement by the Hologic Discovery DXA scan (n = 121), and if a fracture was suspected an x-ray was performed for confirmation. At Aalborg University Hospital, vertebral fractures were assessed by x-ray of the thoracic and lumbar spine (n = 75) (20). All x-rays were analyzed by a radiologist.
Diagnoses were extracted from the Danish National Hospital Discharge Register in the time period January 1, 1977, to March 10, 2015. The registry was founded in 1977 and covers all inpatient contacts from 1977 to 1994 and from 1995 also all outpatient visits to hospitals, outpatient clinics, and emergency rooms. Fracture diagnoses were obtained in the period 1977–2015. Fractures were grouped in three categories: previous fractures, previous major osteoporotic fractures, and incident fractures subsequent to the examination. Data on incident fractures were collected from the Danish National Hospital Discharge Register from the period between the study visit and until the March 10, 2015. On average patients were followed up for 417 days, but ranged from 91 to 722 days. Major osteoporotic fractures were defined as fracture at the hip, spine, shoulder, and forearm. The Charlson comorbidity index score was obtained as described by Christensen et al (21). Diabetes and diabetes complications were excluded from the Charlson comorbidity index score. Hypoglycemic events and falls were also investigated. Supplemental Table 1 describes the used International Classification of Diseases codes.
Primary and secondary end point
The primary end point was hip BMD. Secondary end points included vertebral fracture and incident fracture, BMD at the spine and forearm, cortical porosity, vBMD, tissue stiffness, and trabecular and cortical parameters derived from the HRpQCT scan. Vertebral fracture and incident fracture were analyzed as a composite endpoint. The composite end point was used to increase power of the analysis and also because it is a clinical important outcome that influence the quality of life of the patients. A disadvantage is that it is combination of a prospective collected end point (the incident fracture) and a retrospective collected end point (vertebral fracture).
Study size
A power calculation was performed prior to the study on previous hip BMD measurements (1, 14). To observe differences in hip BMD, 51 patients were needed in each group. Mean observed difference was set to 0.63 (based on the Z-score), SD to 1%, 2α to 5%, and β to 10%.
Statistics
STATA 8 (Stata Corp) was used to perform the statistics. The primary end point and secondary end points were evaluated by unpaired t test and simple and multiple linear regressions. The composite end point of vertebral and incident fracture was analyzed as case control data by simple and multiple logistic regression.
To assess differences between type 1 and type 2 diabetes patients, an unpaired t test was performed. The linear regression stratified by diabetes type was performed to evaluate associations. Unpaired t tests stratified by diabetes type were performed to examine differences in binary variables. Multiple linear regression models were performed and were all adjusted by age, BMI, gender, diabetes type, and diabetes duration and significant variables in the linear regressions. Assumptions were checked: assumption of normal distribution, assumption of linearity between dependent and independent variable, assumption of reliability, and assumption of homoscedasticity.
The composite end point was analyzed according to diabetes type in unadjusted and adjusted unconditional logistic regression models. The unadjusted analysis was performed with the composite endpoint as outcome and patient characteristics, biochemical markers, and BMD as exposure. Significant factors from the unadjusted model were included in the adjusted model. One variable was selected in the multivariate adjusted models if more variables correlated. Biochemical bone markers (17) (sclerostin, osteoprotegerin [OPG], receptor activator of nuclear factor-κβ ligand [RANKL], fibroblast growth factor-23 [FGF-23], C-terminal cross-linked telopeptide of type I collagen [CTX], procollagen type 1 amino terminal propeptide [P1NP], and osteocalcin) were integrated in the analyses.
Results
Characteristics
One hundred one type 1 diabetes patients and 96 type 2 diabetes patients were included. Table 1 presents characteristics of the included patients. Type 1 diabetes patients were younger, had a lower BMI, and longer diabetes duration than type 2 diabetes patients.
Characteristics of Type 1 and Type 2 Diabetes Patients (n = 197)
| Variables | T1D Mean (95% CI) (n = 101) | T2D Mean (95% CI) (n = 96) | P Value |
|---|---|---|---|
| Characteristics | |||
| Age, y | 60.7 (59.2; 62.2) | 65.2 (63.6; 66.7) | <.001 |
| Gender, % male | 59.4 (49.6; 69.1) | 64.6 (54.8; 74.3) | .457 |
| BMI, kg/m2 | 25.8 (25.1; 26.6) | 30.7 (29.9; 31.6) | <.001 |
| Diabetes duration, y | 24.4 (21.9; 26.8) | 14.6 (13.1; 16.2) | <.001a |
| Incident fracture, % | 5.94 (1.25; 10.6) | 5.21 (0.683; 9.73) | .824 |
| Previous fracture, % | 25.7 (17.1; 34.4) | 27.1 (18.0; 36.1) | .832 |
| Previous major osteoporotic fracture | 7.92 (2.56; 13.3) | 6.25 (1.32; 11.2) | .650 |
| Previous hypoglycemic events, % | 31.7 (22.5; 40.9) | 2.08 (0.01; 4.99) | <.001a |
| Charlson Comorbidity Index | 0.317 (0.180; 0.453) | 0.875 (0.421; 1.18) | .001[a |
| Microvascular complication, % | 46.5 (36.6; 56.4) | 45.8 (35.7; 56.0) | .922 |
| Macrovascular complication, % | 3.96 (0.01; 7.83) | 15.6 (8.23; 23.0) | .006a |
| Current smoker, % | 18.8 (11.1; 26.6) | 29.2 (19.9; 38.4) | .089 |
| Former and current smoker, % | 55.4 (45.6; 65.3) | 71.9 (62.7; 81.0) | .017 |
| Alcohol use, U/wk | 6.86 (5.36; 8.36) | 4.85 (3.51; 6.20) | .050 |
| Pharmaceutical use | |||
| Insulin, % | 100 | 59.4 (49.4; 69.4) | |
| Metformin, % | 1.98 (0.01; 4.74) | 77.1 (65.5; 85.6) | <.001a |
| Sulphonylurea, % | 21.9 (13.5; 30.3) | ||
| DPP IV inhibitor, % | 11.5 (4.97; 17.9) | ||
| Combination of DPP IV inhibitor and metformin, % | 8.33 (2.70; 14.0) | ||
| GLP-1 receptor agonist, % | 2.97 (0.01; 6.34) | 38.5 (28.6; 48.5) | <.001a |
| SGLT-2, % | 4.17 (0.0966; 8.24) | ||
| Statin, % | 60.4 (50.7; 70.1) | 79.2 (70.9; 87.4) | .004 |
| Lipid-lowering drugs, % | 63.4 (53.8; 72.9) | 84.4 (77.0; 91.8) | .001a |
| Antihypertensives, % | 71.3 (62.3; 80.3) | 86.5 (79.5; 93.4) | .009a |
| Acetylsalicylic acid, % | 21.8 (13.6; 30.0) | 57.3 (47.2; 67.4) | <.001 |
| Supplements | |||
| Multivitamin, % | 19.8 (11.9; 27.7) | 16.7 (9.08; 24.3) | .572 |
| Vitamin D, % | 27.7 (18.8; 36.6) | 32.3 (22.8; 41.8) | .487 |
| Calcium, % | 17.8 (10.2; 25.4) | 18.8 (10.8; 26.7) | .867 |
| Biochemical parameters | |||
| Sclerostin, pmol/L | 68.1 (62.1; 74.2) | 73.5 (66.0; 81.0) | .269 |
| RANKL, pmol/L | 0.0621 (0.0489; 0.0753) | 0.0449 (0.0342; 0.0557) | .0471a |
| OPG, pmol/L | 4.65 (4.22; 5.08) | 5.32 (4.91; 5.73) | .0277 |
| FGF-23, RU/mL | 97.3 (78.6; 116) | 113 (99.3; 126) | .185a |
| Creatinine, mmol/L | 74.9 (71.7; 78.1) | 76.6 (72.8; 80.4) | .493 |
| 25 OHD, nmol/L | 75.1 (68.6; 81.6) | 64.5 (58.3; 70.6) | .019 |
| HbA1c, mmol/mol | 64.5 (62.7; 66.4) | 63.4 (61.4; 65.3) | .378 |
| HbA1c, % | 8.1 (7.9; 8.3) | 8.0 (7.8; 8.1) | .378 |
Abbreviations: DPP IV, dipeptidyl peptidase IV GLP-1, glucagon-like peptide-1; SGLT, sodium-dependent glucose transporter; T1D, type 1 diabetes patients; T2D, type 2 diabetes patients. P value for difference between T1D and T2D in an unpaired t test. Bold indicates statistical significance.
Unequal variance from Bartlett's test and t test was performed with unequal variance. Lipid-lowering drugs included statins, fibrates, and cholesterol absorption inhibitors. Antihypertensive drugs included angiotensin-converting enzyme inhibitors, angiotensin 2 receptor blockers, β-blockers, diuretics, calcium channel antagonists, and antiadrenergic drugs. The normal range for the biochemical parameters are as follows: creatinine (45–105 mmol/L), 25 OHD (50–160 nmol/L), HbA1c (31–44 mmol/mol), HbA1c (5.0%–6.2%), RANKL (0.025–0.396 pmol/L), OPG (median 2.7 pmol/L), FGF-23 (21.6–91 RU/mL) (32), Sclerostin (median 24.14 pmol/L).
The patients did not differ in regard of previous fracture, previous major osteoporotic fracture, incident fracture, prevalent vertebral fracture, HbA1c, and creatinine levels.
HbA1c was 8.1% (65 mmol/mol) and 8.0% (63 mmol/mol) for type 1 and type 2 diabetes patients, respectively. LDL-, HDL-, and total cholesterol was significantly higher in type 1 compared with type 2 diabetes patients (results not shown). 25 Hydroxyvitamin D (25 OHD) was higher in type 1 compared with type 2 diabetes patients (75 nmol/L vs 65 nmol/L), but means were within normal range. Sclerostin levels did not differ between type 1 and type 2 diabetes patients.
Bone mineral density
Tables 2–4 present data on bone structure in type 1 and type 2 diabetes patients. DXA T-scores at the hip, femur, and spine (−0925 vs −0.261, −1.07 vs −0.669, and −0.580 vs 0.123) were lower in type 1 than type 2 diabetes patients, whereas no difference was found at the forearm. The simple and multiple linear regressions of DXA-derived density parameters are presented in Supplemental Tables 2, 3 and 4.
Differences in DXA Measurements and Prevalent Vertebral Fracture by Diabetes Type (n = 196)
| DXA Parameters | T1D Mean (95% CI) (n = 101) | T2D Mean (95%CI) (n = 96) | P Value |
|---|---|---|---|
| Hip T-scorea | −0.925 (−1.15; −0.703) | −0.261 (−0.505; −0.0164) | <.001 |
| Femur T-scorea | −1.07 (−1.29; −0.839) | −0.669 (−0.931; −0.407) | .024 |
| Spine T-score | −0.580 (−0.863; −0.297) | 0.123 (−0.232; 0.478) | .002 |
| Total forearm BMD | 0.556 (0.536; 0.575) | 0.578 (0.560; 0.596) | .102 |
| VFA or thoracic and lumbar x-ray | |||
| Vertebral fracture, % | 14.9 (7.80; 21.9) | 8.42 (2.73; 14.1) | .161b |
Abbreviations: T1D, type 1 diabetes patients; T2D, type 2 diabetes patients. P value for difference between T1D and T2D was performed in an unpaired t test. Bold data statistical significance.
Two type 2 diabetes patients were not scanned at the hip and femur due to prosthesis.
Unequal variance from Bartletts test and t test was performed with unequal variance.
Differences in HRpQCT Tibia Measurements by Diabetes Type (n = 119)
| HRpQCT Tibia | T1D Mean (95% CI) (n = 52) | T2D Mean (95% CI) (n = 67) | P Value |
|---|---|---|---|
| Structural parameters | |||
| Cortical area, mmb | 124 (114; 134) | 137 (128; 145) | .059 |
| Trabecular area, mmb | 691 (650; 732) | 704 (665; 742) | .659 |
| Cortical perimeter, mm | 114 (111; 118) | 116 (113; 119) | .402 |
| Cortical thickness, mm | 1.09 (1.01; 1.17) | 1.18 (1.11; 1.25) | .103 |
| Bone volume ratio, % | 0.149 (0.140; 0.157) | 0.153 (0.145; 0.160) | .460 |
| Trabecular number, per mm | 2.02 (1.92; 2.12) | 2.11 (2.02; 2.20) | .153 |
| Trabecular thickness, mm | 0.0743 (0.0711; 0.0774) | 0.0729 (0.0698; 0.0761) | .555 |
| Trabecular separation, mm | 0.441 (0.410; 0.473) | 0.415 (0.394; 0.437) | .166 |
| SD of the inverse number of trabeculae, mm | 0.188 (−0.169; 0.205) | 0.187 (0.165; 0.210) | .322a |
| Density parameters | |||
| vBMD, mg HA/cmc | 287 (272; 302) | 298 (285; 309) | .253 |
| Cortical vBMD, mg HA/cmc | 833 (814; 851) | 840 (828; 852) | .533a |
| Trabecular vBMD, mg HA/cmc | 178 (168; 189) | 183 (174; 192) | .462 |
| Metatrabecular vBMD, mg HA/cmc | 240 (230; 250) | 247 (238; 256) | .294 |
| Inner trabecular vBMD, mg HA/cmc | 136 (125; 147) | 140 (130; 149) | .620 |
| Porosity | |||
| Cortical porosity, % | 7.29 (6.57; 8.01) | 7.02 (6.50; 7.55) | .540 |
| Cortical pore volume, mmc | 77.5 (69.4; 85.6) | 82.7 (75.4; 90.0) | .343 |
| Finite element analysis | |||
| Tissue stiffness, kN/mm | 236 (218; 254) | 261 (244; 278) | .046 |
| Failure load, kN | 11.5 (10.7; 12.2) | 12.2 (11.5; 12.8) | .165 |
| Trabecular total bone load ratio, distal end | 0.609 (0.568; 0.650) | 0.590 (0.565; 0.615) | .421a |
| Trabecular total bone load ratio, proximal end | 0.379 (0.342; 0.416) | 0.356 (0.330; 0.381) | .279 |
| Apparent modulus, N/10g · mmb | 2.16 (2.02; 2.30) | 2.28 (2.19; 2.38) | .145 |
| Trabecular stress, kN/mmb | 552 (525; 579) | 549 (533; 564) | .847a |
| Cortical stress, kN/mmb | 826 (794; 859) | 841 (836; 847) | .359a |
| Average trabecular deformation | 0.00 972 (0.00 927; 0.0102) | 0.00 970 (0.00 948; 0.00 992) | .953a |
| Average cortical deformation | 0.0134 (0.0129; 0.0139) | 0.0137 (0.0136; 0.0137) | .338a |
Abbreviations: T1D, type 1 diabetes patients; T2D, type 2 diabetes patients. P value for difference between T1D and T2D was performed in unpaired t test. Bold indicates statistical significance.
Unequal variance from Bartletts test and t test was performed with unequal variance.
Differences in HRpQCT Radius Measurements by Diabetes Type (n = 117)
| HRpQCT Radius | T1D Mean (95% CI) (n = 51) | T2D Mean (95% CI) (n = 66) | P Value |
|---|---|---|---|
| Structural parameters | |||
| Cortical area, mmb | 61.8 (56.4; 67.2) | 67.8 (63.0; 72.6) | .0980 |
| Trabecular area, mmb | 271 (249; 292) | 283 (261; 304) | .440 |
| Cortical perimeter, mm | 80.1 (76.8; 83.5) | 81.7 (78.8; 84.6) | .464 |
| Cortical thickness, mm | 0.775 (0.712; 0.838) | 0.834 (0.781; 0.888) | .152 |
| Bone volume ratio, % | 0.137 (0.127; 0.146) | 0.141 (0.133; 0.149) | .457 |
| Trabecular number, per mm | 2.08 (1.97; 2.20) | 2.20 (2.11; 2.28) | .106 |
| Trabecular thickness, mm | 0.0657 (0.0625; 0.0689) | 0.0642 (0.0615; 0.0670) | .494 |
| Trabecular separation, mm | 0.405 (0.381; 0.429) | 0.405 (0.381; 0.429) | .322a |
| SD of the inverse number of trabeculae, mm | 0.198 (−0.165; 0.232) | 0.177 (0.153; 0.200) | .322a |
| Density parameters | |||
| vBMD, mg HA/cmc | 311 (293; 329) | 321 (307; 335) | .412 |
| Cortical vBMD, mg HA/cmc | 852 (830; 873) | 853 (836; 870) | .930 |
| Trabecular vBMD, mg HA/cmc | 164 (152; 176) | 169 (160; 179) | .460 |
| Metatrabecular vBMD, mg HA/cmc | 220 (208; 232) | 228 (219; 237) | .292 |
| Inner trabecular vBMD, mg HA/cmc | 125 (113; 137) | 129 (119; 140) | .608 |
| Porosity | |||
| Cortical porosity, % | 2.77 (2.46; 3.08) | 3.05 (2.74; 3.35) | .213 |
| Cortical pore volume, mmc | 15.6 (1.7; 17.5) | 18.9 (16.7; 21.1) | .0228a |
| Finite element analysis | |||
| Tissue stiffness, kN/mm | 94.3 (86.7 102) | 101 (94.4; 107) | .190 |
| Failure load, kN | 4.52 (4.16; 4.89) | 4.84 (4.54; 5.15) | .179 |
| Trabecular total bone load ratio, distal end | 0.637 (0.590; 0.685) | 0.588 (0.552; 0.623) | .0851 |
| Trabecular total bone load ratio, proximal end | 0.221 (0.185; 0.257 | 0.213 (0.175; 0.251) | .774 |
| Apparent modulus, N/10g · mmb | 1.82 (1.69; 1.94) | 1.88 (1.78; 1.97) | .456 |
| Trabecular stress, kN/mmb | 487 (470; 503) | 471 (455; 488) | .197 |
| Cortical stress, kN/mmb | 802 (791; 813) | 796 (776; 815) | .587a |
| Average trabecular deformation | 0.00 897 (0.00 871; 0.00 924) | 0.00 873 (0.00 846; 0.00 900) | .215 |
| Average cortical deformation | 0.0137 (0.0136; 0.0138) | 0.0134 (0.0131; 0.0137) | .0828a |
Abbreviations: T1D, type 1 diabetes patients; T2D, type 2 diabetes patients. P value for difference between T1D and T2D was performed in unpaired t test. Bold indicates statistical significance.
Unequal variance from Bartletts test and t test was performed with unequal variance.
Patients with type 2 diabetes also had an increased hip T-score compared with patients with type 1 diabetes in multiple linear regression. Spine T-score and femur T-score did not differ between diabetes types in multiple linear regressions.
High-resolution peripheral quantitative computed tomography
Structural, density, and cortical porosity parameters evaluated by HRpQCT at both the radius and tibia did not differ between diabetes types. Tissue stiffness at the tibia was increased in type 2 diabetes patients compared with type 1 diabetes patients (261 kN/mm vs 236 kN/mm) also after adjustment. Cortical pore volume at the radius was decreased in patients with type 1 diabetes (15.6 mm3 vs 18.9 mm3). HRpQCT results of the radius and tibia are presented in Tables 3 and 4.
When comparing the patients with diabetes who were examined by HRpQCT (n = 119) with those who were not (n = 78), fewer had type 1 diabetes (43.7% vs 62.8%, P = .0085), the diabetes duration was significantly shorter (17. 9 vs 22.2 y, P = .0109), fewer had microvascular and macrovascular complications (38.7% vs 57.7%, P = .0086. and 0.050% vs 16.7%, P = .0067, respectively), p-creatinine was lower (72.9 vs 80.0 mmol/L, P = .0051), p-25 OHD was lower (64.4 vs 78.3 mmol/L), and HbA1c was lower in the HRpQCT-scanned individuals (62.8 vs 65.7 mmol/mol, P = .0430). However, age (63.5 vs. 61.9 y, P = .1619), sex (62.2% vs 61.5% males, P = .9277), or BMI (28.6 vs 27.7 kg/m2, P = .1921) were not different when comparing those who were examined by HRpQCT with those who were not.
The simple and multiple linear regressions of HRpQCT-derived density, porosity, and tissue stiffness parameters are presented in Supplemental Tables 2–3 and 5–9.
Vertebral fractures
Eleven patients suffered an incident fracture (five forearm fractures, two tibia fractures, two fractures of the humerus, one fracture of a metacarpal bone, and one with multiple fractures of the spine, clavicle, and rib) distributed with six fractures in type 1 diabetes patients and five fractures in type 2 diabetes patients. Fifteen type 1 and eight type 2 diabetes patients had a vertebral fracture. Only one of the vertebral fractures was symptomatic; thus, most were asymptomatic. In total, 21 patients with type 1 and 13 patients with type 2 diabetes patients experienced a fracture.
In the unadjusted case control analysis (Supplemental Table 10), fracture in type 1 diabetes patients was significantly associated with diabetes duration (odds ratio [OR] 1.04), previous major osteoporotic fracture (OR 4.47), increasing hip T-score (OR 0.498), sclerostin (OR 0.974), sclerostin divided by tertiles (OR 0.471), and 25 OHD (OR 1.02). In the multivariate adjusted model, sclerostin decreased fracture risk in type 1 diabetes patients (OR 0.413). In particular, the upper tertile (OR 0.188) of sclerostin levels decreased fracture risk compared with the first tertile. When limiting the adjusted analysis to vertebral fractures, a nonsignificant association toward lower risk at a higher sclerostin tertile was present in patients with type 1 diabetes (OR 0.46 [0.18–1.20, P = .11]). In type 2 diabetes patients, no factor was associated with fracture in either the adjusted or unadjusted analysis. Table 5 and Figure 1 presents the results of the multivariate-adjusted model.
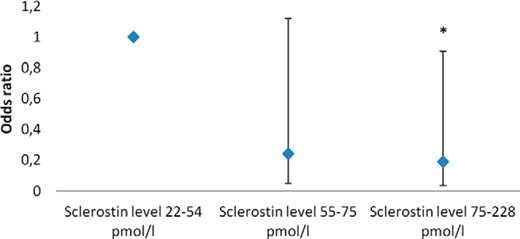
Odds ratio for a fracture by sclerostin level in type 1 diabetes patients.
Sclerostin level 22–54 pmol/L is the reference level. *, Statistical significantly different form reference. Data were adjusted by age, BMI, gender, diabetes duration, previous major osteoporotic fracture, hip T-score, and 25 OHD level.
Multivariate Adjusted Odds Ratio for Composite Fracture End Point (Incident Fracture and Vertebral Fracture) in Type 1 and Type 2 Diabetes Patients
| Variable | Type 1 Diabetes Patients | Type 2 Diabetes Patients | ||
|---|---|---|---|---|
| OR | 95% CI | OR | 95% CI | |
| Age, y | 1.06 | 0.975–1.15 | 0.981 | 0.895–1.07 |
| Male vs female gender | 2.62 | 0.720–9.54 | 0.492 | 0.118–2.05 |
| BMI, kg/m2 | 1.03 | 0.880–1.21 | 1.11 | 0.949–1.30 |
| Diabetes duration, y | 1.06 | 1.01–1.11 | 1.01 | 0.923–1.10 |
| Previous major osteoporotic fracture | 1.67 | 0.241–11.6 | 3.32 | 0.320–34.3 |
| Hip T-score | 0.549 | 0.283–1.06 | 0.469 | 0.207–1.06 |
| 25 OHD, nmol/L | 1.02 | 0.996–1.04 | 1.01 | 0.985–1.03 |
| Sclerostin in tertiles | 0.413 | 0.186–0.918 | 1.71 | 0.696–4.20 |
| Sclerostin tertile 2 vs tertile 1 | 0.24 | 0.05–1.12 | 1.34 | 0.24–7.50 |
| Sclerostin tertile 3 vs tertile 1 | 0.19 | 0.04–0.91 | 2.95 | 0.50–17.4 |
Bold indicates statistical significance. Values were adjusted by other factors in the table except sclerostin tertile 3 vs 1 and 2 vs 1.
Sensitivity analyses were conducted using other fracture outcomes (previous fracture and previous major osteoporotic fracture). A previous fracture was associated with diabetes duration (P = .012), whereas a previous major osteoporotic fracture was negatively associated with a BMD at all measured sites (P < .01 for all sites) and positively associated with the 25 OHD level (P = .015) and the use of vitamin D and calcium supplements (P < .05). None of these outcomes was associated with the sclerostin level.
Discussion
In this cross-sectional study, BMD was lower in type 1 diabetes patients compared with type 2 diabetes patients. However, only hip BMD differed in the adjusted models. Bone tissue stiffness at the tibia was increased in patients with type 2 diabetes compared with patients with type 1 diabetes also in the adjusted analysis.
To our knowledge, this is the first study to show an association between fracture and sclerostin levels in type 1 diabetes patients. In this study type 1 diabetes patients with the highest tertile of sclerostin had 81% decreased risk of a fracture compared with the lowest tertile. This finding may have important therapeutic implications for type 1 diabetes patients because they are at an increased risk of hip fracture throughout life (22). However, it is counterintuitive because increasing sclerostin levels have been associated with the risk of vertebral fractures (23, 24) and fragility fractures (25, 26) in type 2 diabetes patients and nondiabetes patients. In this study, there was a trend for an association between fractures and increasing sclerostin levels in patients with type 2 diabetes. Sclerostin levels were not different between the diabetes types and do not explain the discrepant fracture association. In a recent paper reporting on the same population, osteocalcin, P1NP, and CTX were higher in patients with type 1 diabetes compared with patients with type 2 diabetes, and P1NP and CTX were significant negatively associated with sclerostin levels (17). An increased amount of poor-quality bone (27) may be reduced by sclerostin in patients with type 1 diabetes. Sclerostin may decrease the already very low bone turnover in type 2 diabetes patients and thereby increase fracture risk. The results from this population indicate that the action of sclerostin on bone turnover may differ between type 1 and type 2 diabetes patients, decreasing and increasing fracture risk, respectively.
Previous studies have observed that the risk of fracture is greater in patients with type 1 than type 2 diabetes (1, 22). Although 15% of the patients with type 1 diabetes had a vertebral fracture compared with 8% of the patients with type 2 diabetes, we observed no statistical difference in fracture rates. The discrepancy in fracture rates between our study and previous studies may be due to low power of the analysis. Furthermore, selection bias may influence the fracture rates because the patients with type 2 diabetes recruited from hospitals may have a more severe diabetes compared with patients from the general population. In Denmark all patients with type 1 diabetes are treated at the hospitals.
The HRpQCT parameters were not different between type 1 and type 2 diabetes patients in the adjusted analyses except for an increased stiffness at the tibia in type 2 diabetes patients. Cortical porosity parameters have previously been proposed to discriminate fracture in type 2 diabetes patients (13). In this study cortical porosity parameters were not different between the diabetes types, suggesting that the cortical microstructure is similar between patients with type 1 and type 2 diabetes.
Hip T-score differed between patients with type 1 and type 2 diabetes, which may explain some of the difference in hip fractures previously observed (1). Neither hip T-score or spine T-score in type 1 or type 2 diabetes patients were predictive of fracture in this study, which may be due to low power.
Tissue stiffness measured at the tibia and radius by HRpQCT correlate strongly with the tissue stiffness at the lumbar spine and femur measured by quantitative computed tomography (28). Decreased tissue stiffness at the radius and tibia has been associated with fragility fractures in nondiabetes patients (29, 30) and may also be associated with fractures in diabetes patients.
The strengths of our study are the large sample size and the well-characterized study population. Given the sample size, it was possible to adjust for relevant variables and compare type 1 and type 2 diabetes patients. The limitations of our study are the short follow-up for the incident fractures and the evaluation of vertebral fracture by two different types of equipment (VFA and X-ray). Only two vertebral fractures were detected by VFA. We suspect that evaluation by x-ray instead of VFA would result in a higher detection rate of fracture. These limitations should not affect the evaluated bone structure in the study but may influence the fracture outcome. Nonfasting blood samples were obtained, which is known to decrease CTX, whereas OC and FGF-23 are stable (31, 32). We were unable to collect information on previous falls. A single patient had an International Classification of Diseases, 10th revision, code of tendency to fall, whereas no other had registered falls. When comparing with a Danish population-based HRpQCT material (33), vBMD, cortical porosity, and tissue stiffness were not different in the diabetes patients. However, it reports estimates for individuals between 20 and 35 years of age and predicted estimates at 80 years of age (33). When comparing the measured sclerostin levels with previous population-based values, both patients with type 1 and type 2 diabetes had higher levels (34). These comparisons of HRpQCT and sclerostin values with previous population-based samples should be interpreted with care because different equipment has been used for HRpQCT and the sclerostin levels may be influenced by differences between laboratories.
In conclusion, based on bone structural scans by DXA and HRpQCT, type 1 and type 2 diabetes patients differ only in BMD of the hip and tissue stiffness at the tibia. This may partly explain the difference in fracture risk between patients with type 1 and type 2 diabetes but does not entangle the discrepant fracture risk between diabetes patients and nondiabetes individuals. Sclerostin may be a BMD-independent predictor of fractures in type 1 diabetes patients and thus potentially of clinical importance; however, studies with a longer follow-up are needed.
Acknowledgments
We acknowledge the assistance for recruitment from doctors, nurses, and secretaries at the outpatient clinic of the Department of Internal Medicine and Endocrinology, Aarhus University Hospital, and at the outpatient clinic of the Department of Endocrinology, Aalborg University Hospital. We also acknowledge the assistance with sample collection from laboratory technicians at the osteoporosis clinic at Aarhus University Hospital and Center for Clinical and Basic Research (Aalborg, Denmark).
Author contributions included the following: J.S.-L., S.G., E.-M.H., B.L.L., and P.V. planned the study. J.S.-L. conducted the study, researched the data, and wrote the manuscript. A.H. and S.L. analyzed the bone turnover markers. S.G., E.-M.H., B.L.L., S.L., A.H., and P.V. reviewed and edited the manuscript.
Clinical trial number NCT01870557 was registered at https://clinicaltrials.gov/ct2/show/NCT01870557.
The salary of J.S.-.L. is supported by the European Union Framework Programme 7 Grant 282526. The Familien Hede Nielsens Fond provided financial support for the analysis of bone turnover markers. Acquisition of the XtremeCT scanner was supported by the Karen Elise Jensens Foundation, A. P. Møller og hustru Chastine MC-Kinney Møllers Foundation, the Central Region of Denmark, the Danish Osteoporosis Patient Union, and Toyota Foundation (Denmark).
Disclosure Summary: The authors have nothing to disclose.
Abbreviations
- BMD
bone mineral density
- BMI
bone mineral density
- CV
coefficient of variation
- CTX
C-terminal cross-linked telopeptide of type I collagen
- DXA
dual-energy x-ray absorptiometry
- FGF-23
fibroblast growth factor-23
- HbA1c
glycated hemoglobin A1c
- HDL
high-density lipoprotein
- HRpQCT
high-resolution peripheral quantitative computed tomography
- LDL
low-density lipoprotein
- 25 OHD
25 hydroxyvitamin D
- OPG
osteoprotegerin
- OR
odds ratio
- P1NP
procollagen type 1 amino terminal propeptide
- RANKL
receptor activator of nuclear factor-κβ ligand
- VFA
vertebral fracture assessment
- vBMD
volumetric BMD.
