


Abstract
The role of vitamin D in the development of type 1 diabetes (T1D) remains controversial.
The objective of the investigation was to study whether there are detectable differences in serum 25-hydroxyvitamin D (25[OH]D) concentrations between children who later progressed to T1D (cases) and matched children who remained nondiabetic and negative for islet autoantibodies (controls) when followed up from birth until disease onset.
A total of 3702 prospective serum samples from 252 children were measured for 25(OH)D from the age of 3 months onward using an enzyme immunoassay. Differences between the groups were compared by the mixed-model analysis of variance.
T1D prediction and prevention study clinics in Turku, Oulu, and Tampere University Hospitals, Finland, participated in the study.
By the end of 2012, all 126 case children were diagnosed with T1D. The control children (n = 126) were matched for age, sex, study site, and human leukocyte antigen-HLA-DQ-conferred risk for T1D.
Median circulating 25(OH)D concentration (nanomoles per liter) was measured.
The patterns of variation in circulating 25(OH)D concentrations were similar between cases and controls and did not correlate with the age at seroconversion to autoantibody positivity (P = .79) or disease onset (P = .13). The median concentration of all collected samples did not differ between case and control children (66.6 nmol/L [range 14.0–262.8] vs 67.4 nmol/L [range 19.9–213.0]) P = .56).
This study shows that serum 25(OH)D concentrations are not associated with the development of T1D in Finland.
Vitamin D affects the immune system in many ways (1), and therefore, the association of vitamin D concentrations with autoimmune diseases, including type 1 diabetes (T1D), has been extensively studied. Circulating 25-hydroxyvitamin D (25[OH]D) concentrations in adult patients with T1D have been reported to be significantly lower than in controls both at the time of diagnosis (2) and years later (3, 4). However, there are also studies showing no association (5), and accordingly the results remain contradictory. In children and adolescents with multiple islet autoantibodies, newly diagnosed T1D or established T1D lower 25(OH)D concentrations than in controls were reported in some studies (6, 7), whereas no differences were observed in others (8–10).
T1D is preceded by the appearance of islet autoantibodies, which is a hallmark of the ongoing autoimmune process. We analyzed the association of circulating 25(OH)D concentrations with the seroconversion to autoantibody positivity to understand the possible role of vitamin D in the pathogenesis of T1D (2, 7, 11).
Endogenous vitamin D production in the skin does not occur during the long dark period of the year at northern latitudes. Finland, located between 60°N and 70°N, is the country with the highest rate of T1D in the world (12). We noticed an increase of 25(OH)D vitamin D concentrations in Finnish children after year 2003, when vitamin D fortification of milk started in Finland, which preceded the plateauing of the rapid increase in T1D incidence that had continued more than 50 years (13). Here we addressed the role of vitamin D in the development of T1D by analyzing sequential 25(OH)D concentrations in Finnish children with human leukocyte antigen (HLA)-conferred susceptibility to T1D in a case-control setting comparing those who developed T1D with those who remained nondiabetic.
Materials and Methods
The study population comprised children (born between 1994 and 2004) who participated in the type 1 Diabetes Prediction and Prevention Study in Finland (DIPP). The DIPP project, initiated in 1994, is an ongoing, population-based, prospective, cohort study aimed at exploring means to prevent progression to clinical T1D (14, 15). Briefly, newborn infants with HLA-conferred susceptibility to T1D are recruited from the University Hospitals of Turku (60°N), Tampere (61°N), and Oulu (65°N), Finland. In the Turku cohort, the first serum samples were obtained at the age of 3 months followed by sample collection at 3-month intervals during the first 2 years, after which autoantibody-negative children were monitored at 6-month intervals. In the Tampere and Oulu cohorts, the serum samples were drawn at the ages of 3, 6, 12, 18, and 24 months and yearly thereafter if they were autoantibody negative, and stored at −75°C. If the participant seroconverted, the follow-up was changed to 3-month intervals in all the centers and the follow-up continued to the diagnosis of T1D. Islet cell antibodies were used as the primary screening tool for islet autoimmunity, and if a child seroconverted to positivity for islet cell antibodies, all the preceding and subsequent samples of this child were analyzed for the 65-kDa isoform of glutamic acid decarboxylase antibodies, tyrosine phosphatase-related islet antigen 2 antibodies, and insulin autoantibodies.
We analyzed 25(OH)D concentrations in 3702 serum samples from 252 DIPP study children (126 controls/126 cases). Case children were diagnosed by the end of 2012 with T1D according to the World Health Organization criteria. One control child was selected for each case child and matched pairwise for age (birth within 1 mo), sex, study site, and HLA-conferred risk for T1D. All control children remained autoantibody negative and nondiabetic throughout the follow-up. One control child was selected for each case because it was not possible to find multiple control children who would fulfill these tight criteria. Due to the study protocol, the number of samples per child was different in the two groups; the median number of samples per child in the case group was 13 (range 2–52 samples) and 10 (range 3–35 samples) in the control group, although the median follow-up time was somewhat longer for the control group; 6.05 years (range 1.00–14.27 y) vs 4.43 years (range 0.53–14.23 y) for cases. In some analyses, this would have caused a bias, and thus, a subcohort from the full data set with a matching number of samples from each pair of children was established by selecting the samples closest to each other based on sampling dates. This restricted data set included 3060 samples from the same 252 children, and the median number of samples per child was 12 (range 2–35 samples) for both cases and controls, and the median age was 2.92 years (range 0.15–14.23 y) for cases and 2.53 years (range 0.17–14.27 y) for controls. The basic characteristics of the study population in Turku, Oulu, Tampere, and all centers combined are shown in Table 1. The present study was conducted according to the guidelines of the Declaration of Helsinki and was approved by the Joint Commission on Ethics of Turku University and Turku University Central Hospital. Written informed consent was obtained from all subjects and/or their guardians.
The Basic Characteristics of the Study Population
| Variable | Turku | Oulu | Tampere | All |
|---|---|---|---|---|
| Children, n | 168 | 54 | 30 | 252 |
| Cases/controls, n | 84/84 | 27/27 | 15/15 | 126/126 |
| Case/control girls, n | 39/39 | 15/15 | 8/8 | 62/62 |
| Case/control boys, n | 45/45 | 12/12 | 7/7 | 64/64 |
| Cases with samples ± 30 d of diagnosis, n | 46 | 25 | 11 | 82 |
| Child pairs with high/moderate genetic T1D risk, n | 47/37 | 11/16 | 4/11 | 62/64 |
| Samples, n | 2970 | 468 | 264 | 3702 |
| Case/control samples, n | 1644/1326 | 232/236 | 143/121 | 2019/1683 |
| Cases with a sample at seroconversion, n | 83 | 25 | 11 | 119 |
| Median of samples per case after seroconversion (range), n | 12 (0–47) | 6 (1–16) | 9 (2–18) | 10 (0–47) |
| Median of samples per case in full data set (range), n | 18 (2–52) | 6 (2–22) | 10 (2–22) | 13 (2–52) |
| Median of samples per control in full data set (range), n | 14 (3–35) | 9 (5–12) | 8 (5–10) | 10.5 (3–35) |
| Median age of sample draw in cases in restricted data set (range), y | 3.23 (0.23–14.23) | 1.90 (0.15–7.97) | 1.50 (0.23–6.29) | 2.92 (0.15–14.23) |
| Median age of sample draw in control in restricted data set (range), y | 3.00 (0.24–14.27) | 2.02 (0.17–8.96) | 1.51 (0.24–7.17) | 2.53 (0.17–14.27) |
| Median age at seroconversion (range), y | 1.75 (0.5–9.55) | 1.12 (0.34–4.18) | 1.05 (0.51–2.01) | 1.51 (0.34–9.55) |
| Median age at diagnosis (range), y | 6.57 (0.87–14.23) | 2.96 (1.03–7.97) | 3.02 (1.06–6.40) | 4.53 (0.87–14.23) |
| Median follow-up of cases (IQR), y | 5.98 (3.66–9.04) | 3.29 (2.54–4.48) | 2.90 (2.06–4.62) | 4.43 (2.96–7.73) |
| Median follow-up of controls (IQR), y | 6.14 (3.97–8.96) | 6.90 (5.90–7.96) | 5.02 (4.70–6.01) | 6.05 (4.02–8.14) |
| BMI measurements in cases/controls, n | 1533/1251 | 212/231 | 133/118 | 1878/1600 |
| Median BMI in cases (IQR) | 16.31 (15.36–17.34) | 15.85 (15.00–17.08) | 16.55 (15.26–17.43) | 16.26 (15.31–17.30) |
| Median BMI in controls (IQR) | 16.42 (15.53–17.41) | 16.21 (15.19–17.22) | 16.23 (15.22–17.80) | 16.40 (15.45–17.39) |
| Median age at BMI measurement for cases (IQR), y | 3.73 (1.78–6.24) | 2.15 (1.02–3.22) | 1.99 (1.00–3.15) | 3.24 (1.55–5.74) |
| Median age at BMI measurement for controls (IQR), y | 2.66 (1.25–5.23) | 2.20 (1.01–5.04) | 1.82 (0.95–3.95) | 2.53 (1.10–5.20) |
Abbreviation: IQR, interquartile range.
25(OH)D concentrations
A commercial immunoassay kit (Immunodiagnostic Systems Ltd) was used for the 25(OH)D analyses as previously described (13). The intraassay coefficient of variation was 6.5% and the sensitivity was 5 nmol/L. The performance target set by the Vitamin D External Quality Assessment Scheme Advisory Panel for 25(OH)D assays was met (16).
Statistical analysis
Associations between 25(OH)D deficiency and case control status were studied using conditional logistic regression. Associations between the response variable, ie, concentrations of 25(OH)D, and various predictor variables were studied using mixed models with the subject as a random variable. The results were adjusted for sex, age, sample month, and year when appropriate. Numbers of samples in each group of the original data were compared using an independent-samples t test. All statistical analyses were performed with SAS for Windows version 9.3. For all analyses, statistical significance was defined as P ≤ .05.
Results
Monthly distribution of all analyzed 25(OH)D concentrations at different age points in cases and controls are shown in Figure 1. No statistically significant difference was observed. The median 25(OH)D concentrations were in the inadequate range of 50–75 nmol/L (17) in both cases and controls. In the full data set, the median 25(OH)D concentration was 66.6 nmol/L (range 14.0–262.8 nmol/L) in cases and 67.4 nmol/L (range 19.9–213.0 nmol/L) in controls (P = .56). In the restricted data set, the cases had a median concentration of 66.7 nmol/L (range 18.8–262.8 nmol/L) and the controls a median concentration of 68.0 nmol/L (range 19.9–213.0 nmol/L) (P = .78). During the darker 6-month period (November through April), the 25(OH)D concentrations were 61.0 nmol/L (quartiles 45.5–78.8) in cases and 62.0 nmol/L (interquartile range 46.5–78.3) in controls (P = .31), whereas during the lighter 6-month period (May through October), the concentrations were 71.9 nmol/L (interquartile range 57.2–91.5) in cases and 74.3 nmol/L (interquartile range 57.9–92.3) in controls (P = .82) in the restricted data set. As expected, the sample month (Figure 1), sample year (data not shown), and the age of the child (Figure 2) at sample draw each had a significant influence on 25(OH)D concentrations (P < .001) both in the full and restricted data sets.
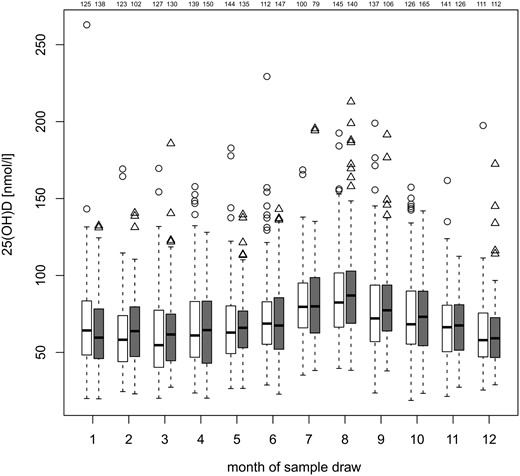
Monthly distribution of median 25(OH)D concentrations in cases (white) and controls (gray) of all ages in the data set matched additionally for the closest sample date, ie, restricted data, with number of samples for each group at the top for each box (first cases, then controls). Heavy lines indicate median concentrations and box ends represent quartiles, whereas whiskers indicate the lowest value still within 1.5 interquartile range of the lower quartile and the highest value still within 1.5 interquartile range of the upper quartile. Any data not included between the whiskers is plotted as an outlier (circles in cases, triangles in controls). The differences between cases and controls were not statistically significant at any month when adjusted for age, sex, and sample year.
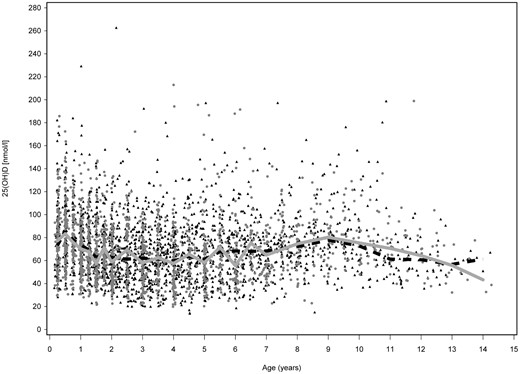
25(OH)D concentrations in serum samples of children of different ages. All analyzed samples are shown (full data set), with years 1994–2012 combined. Case samples are shown in gray (dots) and control samples in black (triangles), median 25(OH)D in cases (gray line), and controls (dashed line) first at 3-month, then 6-month, and finally 12-month intervals.
In this cohort, the median 25(OH)D concentrations were highest in the most southern center, Turku, ie, 69.2 nmol/L (range 14.0–262.8 nmol/L) in cases, 71.3 nmol/L (range 19.9–219.3 nmol/L) in controls in the full data set (P = .64) and 69.7 nmol/L (range 18.8–262.8 nmol/L) in cases, 71.0 nmol/L (range 19.9–213.0 nmol/L) in controls in the restricted data set (P = .35). The lowest median concentrations were observed in the most northern center, Oulu, 52.1 nmol/L (range 20.1–131.8 nmol/L) in cases, 49.8 nmol/L (range 20.1–131.0 nmol/L) in controls (P = .49) in the full data set and 52.1 nmol/L (range 20.1–131.8 nmol/L) in cases, 50.9 nmol/L (range 25.9–137.5 nmol/L) in controls (P = .37) in the restricted data set. In Tampere the median concentration was 55.8 nmol/L (range 20.4–132.4 nmol/L) in cases, 57.3 nmol/L (range 20.3–131.0 nmol/L) in controls (P = .95) in the full data set and 57.6 nmol/L (range 20.4–132.4 nmol/L) in cases, 59.2 nmol/L (range 20.3–131.0 nmol/L) in controls (P = .91) in the restricted data set. The differences between the centers were statistically significant in both the full and restricted data set (P < .001).
In the full data set, 10.3% of children had at least one sample in the range of severe vitamin D deficiency (18), with concentrations below 25 nmol/L, 17 cases vs nine controls (P = .10). In the restricted data set, the proportion was 9.5%, 15 cases vs nine controls (P = .19). None of the children was persistently vitamin D deficient, which was defined by having 25(OH)D concentration below 25 nmol/L in more than 50% of the samples.
The 25(OH)D concentrations did not correlate with the age at seroconversion for autoantibodies (P = .79) or with the age of disease manifestation (P = .13). The 25(OH)D concentrations were similar before vs after seroconversion among cases when the concentrations were adjusted for sample month, sample year, age of child at sample draw, and sex (P = .22) (Figure 3). No differences were observed when samples from cases before seroconversion were compared with controls (P = .35) or case samples after seroconversion to controls (P = .23). There was no correlation of 25(OH)D concentrations with the number of autoantibodies present (Supplemental Figure 1), type of autoantibodies (Supplemental Figure 2), or with the titers of the biochemical autoantibodies, glutamic acid decarboxylase (P = .40), autoantibody against the tyrosine phosphatase-related IA-2 protein (P = .35), and insulin autoantibodies (P = .46), when adjusted for the sample month, sample year, age of child at sample draw, and sex.
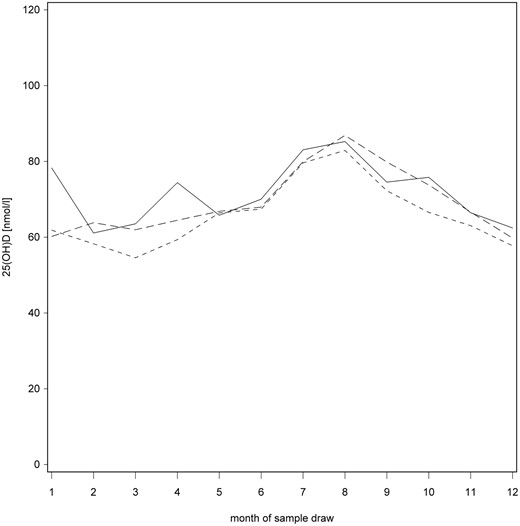
Median monthly 25(OH)D concentrations before seroconversion (solid line), from seroconversion to T1D (line with shorter dashes), and controls (line with longer dashes) in the full data set.
There were 112 case-control pairs in whom we compared 25(OH)D concentrations (adjusted for sample month, sample year, sex, and age of child at sample draw) in the last seronegative sample of each case child with the matching sample of the control child. The median 25(OH)D concentration was 70.0 nmol/L (range 20.8–184.1 nmol/L) in the cases and 72.1 nmol/L in the controls (range 23.4–185.8 nmol/L; P = .87).
There was no difference in 25(OH)D concentrations when the children were divided according to their HLA risk genotype: the DQB1*02/DQB1*0302 combination was defined as the high-risk genotype and other genotypes selected for follow-up as moderate-risk genotypes. Among the children with high-risk HLA, the median was 66.4 nmol/L (range 18.8–262.8 nmol/L) in cases and 65.5 nmol/L (range 21.9–198.9 nmol/L) in controls (P = .40), with 791 samples in both groups, whereas in children with moderate-risk HLA, the median concentrations were 67.1 nmol/L (range 20.0–197.3 nmol/L) in cases and 70.0 nmol/L (range 19.9–213.0 nmol/L) in controls (P = .53), with 739 samples in both groups.
Because body mass index (BMI) may affect circulating 25(OH)D concentrations, we analyzed the BMI in all children (Table 1). Because BMI is dependent on age and sex of the child (19), we first analyzed the median age of the BMI data, and it was similar between the groups (P = .21). The median BMI was also the same in cases and controls (P = .65). As expected, BMI showed an inverse association with the 25(OH)D concentrations; when BMI increased with 1 kg/m2, median 25(OH)D concentration decreased with 1.3 nmol/L. The effect was similar in cases and controls (P = .57).
Discussion
Our study showed that there are no apparent differences in the circulating 25(OH)D concentrations between children who progressed to T1D and children who remained unaffected. The 25(OH)D concentrations in the current study were higher than in previous studies in Finnish children (20, 21). The median age at blood sampling was 3 years in this survey, although the individual age ranged from 3 months to 14 years. We have previously shown that young children have higher 25(OH)D concentrations than older children (13). The geographical localization of the study center correlated with 25(OH)D concentrations because the vitamin D levels were highest in the most southern city (Turku, 60°N) and lowest in the most northern city (Oulu, 65°N), which may simply reflect the difference in the exposure to sun. Interestingly, dietary intake of vitamin D has been associated with a reduced risk of T1D in northern Finland (22).
The case children in this study developed T1D in different stages of their development. In a larger cohort, children could have been divided into different subgroups, for example, those who developed T1D before/after the age of 2 or 4 years, those with vitamin D deficiency vs those with vitamin D sufficiency at different age points, but the power for these analyses was too limited. Another weakness of this study is the somewhat limited number of vitamin D-deficient samples so that there is not enough power to examine the effects of long-term vitamin D deficiency in childhood. It may also be considered a weakness of this study that the possible variables affecting 25(OH)D concentrations, such as skin type, clothing habits, nutritional factors and supplement use, or genetic polymorphism linked to vitamin D metabolism, were not assessed. However, our aim was to study whether the concentrations are different in children who progress to overt T1D compared with those who do not, irrespective of the possible mechanisms behind the differences. The major strength of this longitudinal study is that it includes a large number of samples and that they are prospective serum samples so that 25(OH)D concentrations were analyzed consecutively both before and after seroconversion in carefully matched case-control pairs. The 25(OH)D measurements were made in well-designed batches in a single laboratory, thus minimizing the variation (23).
We found that children who progress to T1D have similar circulating 25(OH)D concentrations as unaffected children when they are carefully matched for age, geographic location in latitude of the living place, HLA risk, sex, and time of blood draw. This finding is in line with some previous studies (10, 11) but not with others (7, 24). The previous studies with similar results to ours have been quite small, with three children developing T1D, 32 additional autoantibody-positive children and 80 control children in one (10), and 55 children developing T1D, 218 additional autoantibody-positive children and 360 controls in another (11). The studies with contradictory results had more T1D cases. In a study with 244 children diagnosed with T1D, 108 autoantibody-positive children and 406 controls, the difference in 25(OH) concentrations was most conspicuous in summer and vitamin D deficiency was more pronounced in children with newly diagnosed T1D (7). Another study with 1000 adult T1D cases and 1000 adult controls reported a 3.5-fold lower risk of insulin-requiring diabetes with a serum 25(OH)D concentrations of 60 nmol/L or higher (24). The serum 25(OH)D concentrations were analyzed from a single sample per subject in that study, which can be considered as a clear limitation. Analyzing 25(OH)D concentration based on just one sample per individual may be misleading, as we have shown here (Figure 2).
Vitamin D intake has been linked to the development of T1D for quite some time (22) and lower serum 25(OH)D concentrations have been reported in T1D patients than in controls all around the world (2, 4, 6, 25–27). It is possible that the reported differences in 25(OH)D concentrations appear after the diagnosis because the disease may affect vitamin D metabolism, and there are T1D-associated complications that result in loss of the vitamin D-binding protein via excretion into urine (28). In conclusion, the results of this prospective study suggest that the development of T1D is not associated with marked changes in the vitamin D status.
Acknowledgments
We thank Jaakko Matomäki, Esko Pakarinen, Mika Riikonen, and Jari Hakalax for the data management and statistical analysis. Annika Koivu and Katja Orpana are acknowledged for the practical assistance on the 25(OH)D measurements. We are grateful to the Diabetes Prediction and Prevention Study in Finland families and study personnel for their contribution.
This work was supported by Grants 4–1998-274, 4–1999-731, and 4–2001-435 from the Juvenile Diabetes Research Foundation; the Academy of Finland (Centre of Excellence in Molecular Systems Immunology and Physiology Research 2012–2017, Decision Numbers 250114 and 284597); Funds for University Hospitals in Finland; the Sigrid Juselius Foundation; the Signe and Ane Gyllenberg Foundation; the Finnish Diabetes Research Foundation; the Jalmari and Rauha Ahokas Foundation; and the University of Turku Doctoral Programme of Clinical Investigation.
Disclosure Summary: The authors have nothing to disclose.
Abbreviations
- BMI
body mass index
- DIPP
Type 1 Diabetes Prediction and Prevention study
- HLA
human leukocyte antigen
- 25(OH)D
25-hydroxyvitamin D
- T1D
type 1 diabetes.
References
Author notes
O.S. and J.T. contributed equally to this work.
