


Abstract
There is debate about whether women may need greater vitamin D supplementation when pregnant. However, it is unclear whether the 25-hydroxyvitamin D (25-OH-D) concentration required for suppression of PTH (ie, suggesting vitamin D sufficiency) differs between pregnancy and the nongravid state.
To systematically characterize the relationship between 25-OH-D and PTH during and after pregnancy.
In this study, 468 women underwent serial assessment of serum 25-OH-D and PTH in late pregnancy, at 3 months postpartum, and at 12 months postpartum. At each visit, segmented regression analysis was performed to: 1) determine the best model to fit the relationship between 25-OH-D and PTH; and 2) identify the 25-OH-D threshold above which PTH is maximally suppressed.
Serum 25-OH-D and PTH were inversely correlated at each of the pregnancy (r = −0.33; P < .0001), 3 months postpartum (r = −0.37; P < .0001), and 12 months postpartum (r = −0.34; P < .0001) assessments. In pregnancy, PTH first rises when 25-OH-D falls below 82 nmol/L (95% confidence interval, 61–103) and follows a linear relationship with declining 25-OH-D thereafter. In contrast, at both postpartum visits, there was a curvilinear relationship between 25-OH-D and PTH below the 25-OH-D threshold at which PTH is suppressed (71 nmol/L [61–81] at 3 months and 81 nmol/L [61–100] at 12 months). The 25-OH-D thresholds for PTH suppression in pregnancy and at 3 and 12 months postpartum were not significantly different from one another (all pairwise P ≥ .26).
Although the shape of the relationship between 25-OH-D and PTH differs between pregnancy and the postpartum, the 25-OH-D thresholds for PTH suppression are similar, supporting comparable targets for vitamin D supplementation.
Pregnancy is a critical window during which perturbation of maternal physiology may have both acute effects on fetal development and long-term consequences for the health of the offspring (1). In this context, there is currently considerable debate regarding the adequacy of maternal vitamin D supplementation in pregnancy, which is typically provided in the form of antenatal vitamins containing 400 IU of vitamin D per day, although this content may vary depending on country and body habitus (2–4). Although physiological maternal adaptations in pregnancy will generally ensure the provision of sufficient calcium for the needs of the fetus (4), observational studies have raised the possibility that low maternal stores of vitamin D (as reflected in the serum concentration of 25-hydroxyvitamin D [25-OH-D]) may be associated with adverse obstetrical outcomes (such as pre-eclampsia, cesarean section, and neonatal hypocalcemia) (5, 6) and long-term deleterious effects in the offspring, including decreased bone mass, greater adiposity, and possibly higher rates of asthma and type 1 diabetes (7–10). Although causality remains unclear in these associations, these data have contributed to the suggestion that women potentially may need greater vitamin D supplementation during pregnancy, as compared to the nongravid state (3, 11–13). At the heart of this ongoing debate, however, lies uncertainty about the key outcomes that may be impacted by maternal vitamin D status (4).
In such a setting, where the outcomes of interest are unclear, a physiological approach to addressing the adequacy of vitamin D status is to consider the interaction between 25-OH-D and its upstream regulator, PTH. Specifically, the 25-OH-D concentration at which PTH is no longer suppressed may provide a sensitive indicator of physiological insufficiency of vitamin D stores, as per the classical endocrine feedback loop by which PTH and 25-OH-D interact, even if one does not know the precise adverse implications of the insufficiency in question. In this context, one would like to know whether the relationship between 25-OH-D and PTH is different in pregnancy, as compared to the nongravid state. Furthermore, because the 25-OH-D concentration that provides maximal PTH suppression can vary between individuals (14), such a comparison should ideally be performed by evaluating the same women on two occasions: when pregnant and nonpregnant. To our knowledge, however, the 25-OH-D/PTH relationship has not been previously studied in this manner (ie, in a single population of women evaluated both when pregnant and not). Thus, our objective in this study was to systematically characterize the relationship between 25-OH-D and PTH in a cohort of women undergoing serial evaluation at three points in time: in pregnancy, in the early postpartum, and late in the first year postpartum.
Subjects and Methods
Study population
In this prospective observational cohort study, participating women underwent assessment at recruitment in late pregnancy, at 3 months postpartum, and at 12 months postpartum. The study took place in Toronto, Canada (latitude 43°42′N), and the protocol has been previously described in detail (15–17). The women comprising this cohort were recruited at the time of antepartum screening for gestational diabetes in late second trimester. Exclusion criteria included pre-existing diabetes, major medical comorbidities, and major organ dysfunction, such as liver or renal disease. The current analysis was conducted in 468 women who had completed the study visits in pregnancy and at 3 and 12 months postpartum, with measurement of serum 25-OH-D and PTH on each occasion. The study protocol has been approved by the Mount Sinai Hospital Research Ethics Board, and all participants provided written informed consent.
Participant assessments
At each study visit, weight was measured, and data pertaining to medical and family history were collected by interviewer-administered questionnaire, as previously described (15–17). Serum 25-OH-D was measured by competitive electrochemiluminescent immunoassay on the Roche Modular E170 (catalog no. 05894913190). This assay has a lower reporting limit of 8 nmol/L and no upper reporting limit. Serum PTH was measured using an electrochemiluminescence immunoassay on the Roche Modular E170 Analyzer (catalog no. 11972103122), which has a detection range from 0.6 to 530 pmol/L.
Statistical analyses
All analyses were conducted using SAS 9.4 (SAS Institute). Continuous data are presented as mean ± standard deviation (if normally distributed) or median (interquartile range) (if skewed), and categorical variables are presented as proportions (Table 1).
Study Population in Pregnancy, at 3 Months Postpartum, and at 12 Months Postpartum (n = 468)
| In pregnancy | |
|---|---|
| Weeks gestation at assessment | 29.7 ± 2.9 |
| Age, y | 34.3 ± 4.3 |
| Ethnicity, % | |
| White | 71.6 |
| Asian | 11.7 |
| Other | 16.7 |
| Prepregnancy BMI, kg/m2 | 23.5 (21.3–27.5) |
| Weight gain in pregnancy, kg | 11.0 ± 4.9 |
| Use of calcium/vitamin D supplements, % | 83.7 |
| Season of blood sample collection, % | |
| Winter | 23.1 |
| Spring | 28.0 |
| Summer | 28.2 |
| Fall | 20.7 |
| 25-OH-D, nmol/L | 63.7 ± 24.5 |
| PTH, pmol/L | 3.0 (2.4–4.0) |
| At 3 months postpartum | |
| BMI, kg/m2 | 25.7 (23.1–29.4) |
| Use of calcium/vitamin D supplements, % | 56.0 |
| Season of blood sample collection, % | |
| Winter | 23.1 |
| Spring | 25.2 |
| Summer | 21.4 |
| Fall | 30.3 |
| 25-OH-D, nmol/L | 62.6 ± 24.2 |
| PTH, pmol/L | 3.2 (2.4–4.2) |
| At 12 months postpartum | |
| BMI, kg/m2 | 24.6 (21.8–28.5) |
| Use of calcium/vitamin D supplements, % | 36.1 |
| Season of blood sample collection, % | |
| Winter | 21.4 |
| Spring | 23.3 |
| Summer | 27.4 |
| Fall | 28.0 |
| 25-OH-D, nmol/L | 61.4 ± 26.4 |
| PTH, pmol/L | 3.5 (2.8–4.6) |
Continuous variables are presented as mean ± SD if normally distributed or median (interquartile range) if skewed. Categorical variables are presented as proportions.
To evaluate the relationship between 25-OH-D and PTH at each study visit, we first performed Spearman correlation analysis, both unadjusted and after adjustment for age, ethnicity, current body mass index (BMI), current use of calcium/vitamin D supplements, and season at the study visit. The adjusted analyses were performed as Spearman partial correlations, with covariates coded as follows: age and current BMI were continuous variables; ethnicity was a three-level categorical variable (white, Asian, other); current use of calcium/vitamin D supplements was a two-level categorical variable (yes, no); and season at the study visit was a four-level categorical variable (winter, spring, summer, fall). Each of these variables was coded in the same way as that of their presentation in Table 1.
Because the scatter plots revealed a complex relationship, we used the LOESS method to fit the data and generate a smoothed curve at each of the study visits. Without prior assumption of the shape of a relationship, a smoothed curve can be constructed by fitting successive regression functions in the local neighborhood. The radium of neighborhood is determined by a smoothing parameter, the fraction of the data that is used around each point. An optimal smoothing parameter is obtained by minimizing the corrected Akaike Information Criterion because it considers both the goodness of fit and model complexity. The 95% confidence limits of each smoothed curve were also determined (Figure 1).

Relationship between serum 25-OH-D and PTH in pregnancy (A), at 3 months postpartum (B), and at 12 months postpartum (C), respectively.
LOESS smoothed curve is shown, with 95% CI indicated by shading.
The LOESS fit visually suggested that there might be a threshold level of 25-OH-D around which the relationship between 25-OH-D and PTH would differ at each visit. Specifically, on each plot, there appeared to be a threshold level of 25-OH-D below which PTH started to rise and above which it would plateau. As per the physiology, this threshold represents the 25-OH-D concentration below which PTH is no longer suppressed. To determine the best model to fit the relationship between 25-OH-D and PTH and to obtain an optimal 25-OH-D threshold based on this model, we used segmented regression analyses. With this methodology, the data at each visit are split into two parts around a given 25-OH-D level, such that a different regression model can be fit for each segment of the data. For each visit, we constructed the following three segmented regression models consisting of two segments that connect in a smooth fashion: 1) linear model + plateau; 2) exponential model + plateau; and 3) quadratic model + plateau.
Model 1 can be written as follows:

where a1 is the intercept, b1 is the slope for the first segment, and x1 is the threshold. At the point x1, the two equations for PTH are equal. Then, we can get d1 = a1 + b1×x1. Therefore, a1, b1, and x1 are unknown parameters and need to be estimated.
Similarly, Model 2 can be written as follows:

where x2 is the threshold, a2 and b2 are unknown parameters, and .
Model 3 can be written as follows:

where x3 is the threshold, a3, b3, and c3 are unknown parameters, and d3 = a3 + b3×x3 + c3 × x3 × x3. Proc NLIN in SAS uses a nonlinear least-squares estimation method to estimate these unknown parameters in each model in an iterative process. The process requires a starting estimate for each parameter, until the estimate converges to a certain value. The final estimate minimizes mean squared errors (MSEs). The starting estimates for x1, x2, and x3 were visually provided by the smoothed curves from LOESS fit, and the other parameters were provided by fitting their own model (linear or curvilinear part) to the whole data. We used MSE to compare the three models and then to determine a best model with the smallest MSE for each visit. The estimated x1, x2, and x3 in the best models are the optimal 25-OH-D thresholds to achieve maximal suppression of PTH in pregnancy, at 3 months postpartum, and at 12 months postpartum, respectively (Table 2).
Optimal Model for Relationship Between PTH and 25-OH-D, and the Estimated 25-OH-D Threshold Where PTH Begins to Rise in Pregnancy, at 3 Months Postpartum, and at 12 Months Postpartum, Respectively
| Setting | Optimal Model | 25-OH-D Threshold, nmol/L | 95% CI, nmol/L | Pairwise Comparisons of 25-OH-D Thresholds | ||
|---|---|---|---|---|---|---|
| vs A | vs B | vs C | ||||
| In pregnancy | Line + plateau | 82 | 61, 103 | — | 0.26 | 0.94 |
| At 3 months postpartum | Exponential + plateau | 71 | 61, 81 | 0.26 | — | 0.60 |
| At 12 months postpartum | Quadratic + plateau | 81 | 61, 100 | 0.94 | 0.60 | — |
For pairwise comparison of the three 25-OH-D thresholds (ie, to see whether the thresholds differed between pregnancy, 3 months postpartum, and 12 months postpartum), we conducted bootstrap analyses to estimate the sampling distribution of the pairwise differences in the three thresholds. The bootstrap P values were calculated by the proportion of those bootstrapped differences in thresholds that were greater than or equal to the observed pairwise difference from the original data. Because not all bootstrap samples yielded converged breakpoints, we generated 10 000 samples and excluded those where the iteration did not converge. The samples that obtained converged breakpoints at all visits were merged to calculate the bootstrap P value (Table 2). The observed parameter estimates from the original dataset were used as starting estimates to run segmented regression models in the bootstrap samples.
Finally, we determined the predicted degree of PTH stimulation at different levels of 25-OH-D at each of the three study visits. The degree of PTH stimulation is presented as the expected percentage change in serum PTH as compared to the PTH level for 25-OH-D concentration of 100 nmol/L at each of the pregnancy, 3 months postpartum, and 12 months postpartum assessments, respectively (Figure 2). The expected PTH concentration at each level of 25-OH-D was obtained from the LOESS fit. This PTH concentration was compared to that when 25-OH-D = 100 nmol/L in order to quantify the degree of stimulation in relation to a threshold at which PTH suppression would be unequivocally expected. (Moreover, it has been reported that serum 25-OH-D of 100 nmol/L is required to optimize the production of 1,25-OH-D in pregnancy [13].) Based on the bootstrap samples previously generated (described above), we used LOESS fit to predict the PTH concentration at each level of 25-OH-D and then to calculate the expected percentage change in serum PTH as compared to the PTH level for a 25-OH-D concentration of 100 nmol/L at each of the visits. For levels of 25-OH-D between approximately 40 and 90 nmol/L (eg, 75 nmol/L), we were then able to compare the bootstrapped PTH stimulation between pregnancy and each of the two postpartum assessments by paired t test.
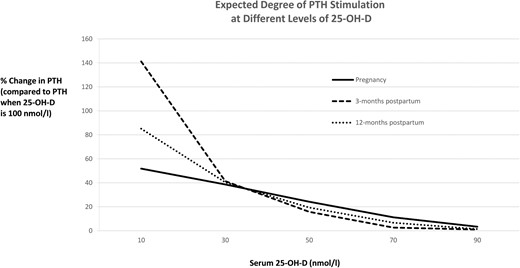
Degree of PTH stimulation at different levels of 25-OH-D, shown as the expected percentage change in serum PTH compared to PTH when 25-OH-D is 100 nmol/L at pregnancy, 3 months postpartum, and 12 months postpartum, respectively
Results
The study population consisted of 468 healthy women with mean age 34.3 ± 4.3 years. There were no women with renal disease, and the majority were of white ethnicity (71.6%). Table 1 shows the characteristics of the study population at mean 29.7 ± 2.9 weeks gestation, at 3 months postpartum, and at 12 months postpartum. Mean 25-OH-D was 63.7 ± 24.5 nmol/L in pregnancy, 62.6 ± 24.2 nmol/L at 3 months, and 61.4 ± 26.4 nmol/L at 12 months postpartum. The corresponding median (25th-75th percentile) PTH at these three points in time was 3.0 (2.4–4.0), 3.2 (2.4–4.2), and 3.5 (2.8–4.6) pmol/L, respectively.
Relationship between 25-OH-D and PTH at each visit
On Spearman correlation analysis, serum 25-OH-D and PTH were inversely correlated at pregnancy (r = −0.33; P < .0001), 3 months postpartum (r = −0.37; P < .0001), and 12 months postpartum (r = −0.34; P < .0001). These inverse correlations were unchanged upon adjustment for age, ethnicity, BMI, use of calcium/vitamin D supplements, and season of assessment (r = −0.31, P < .0001; r = −0.29, P < .0001; and r = −0.26, P < .0001, respectively). Further adjustment for breastfeeding status did not change these correlations at 3 and 12 months postpartum (r = −0.29, P < .0001; and r = −0.25, P < .0001, respectively).
To evaluate the relationship between 25-OH-D and PTH during and after pregnancy, we constructed LOESS smoothed curves at the study visits in pregnancy (Figure 1A), at 3 months postpartum (Figure 1B), and at 12 months postpartum (Figure 1C). Of note, these curves suggested that the relationship between 25-OH-D and PTH in pregnancy differed from that at the two postpartum visits. To formally evaluate this possibility, we applied segmented regression analysis to: 1) determine the best model to fit the relationship between 25-OH-D and PTH at each visit; and 2) obtain the 25-OH-D threshold below which PTH begins to rise based on this model (ie, the 25-OH-D concentration above which PTH is suppressed or plateaued) (Table 2). This analysis revealed that, in pregnancy, the optimal model is a linear relationship between 25-OH-D and PTH up to a 25-OH-D threshold of 82 nmol/L (95% confidence interval [CI], 61–103), after which PTH plateaus (ie, is suppressed). In contrast, for both of the postpartum visits, there was a curvilinear relationship between 25-OH-D and PTH up to the threshold at which PTH is suppressed. At 3 months postpartum, the optimal curvilinear model was exponential in shape, with a 25-OH-D threshold of 71 nmol/L (95% CI, 61–81). At 12 months postpartum, the optimal curvilinear model was quadratic up to a 25-OH-D threshold of 81 nmol/L (95% CI, 61–100). It thus emerges that, at 25-OH-D concentrations below which PTH is no longer suppressed, the shape of the relationship between 25-OH-D and PTH differs between pregnancy (linear) and the postpartum (curvilinear).
25-OH-D threshold for PTH suppression at each visit
Despite this difference in the nature of the relationship, the 25-OH-D thresholds associated with PTH suppression in pregnancy (82 nmol/L), at 3 months postpartum (71 nmol/L), and at 12 months postpartum (81 nmol/L) were not significantly different from one another on pairwise comparisons (all P ≥ .26) (Table 2). At each point in time, mean 25-OH-D in the study population was significantly lower than the indicated threshold (all P < .0001) (data not shown). Indeed, the prevalence of serum 25-OH-D below the respective threshold for PTH suppression was 74.6% in pregnancy, 61.7% at 3 months postpartum, and 77.8% at 12 months postpartum.
Degree of PTH stimulation across the range of 25-OH-D at each visit
Figure 2 shows the expected degree of PTH stimulation for different levels of serum 25-OH-D at each visit. It reveals that, at each visit, PTH stimulation (defined as the percentage change in PTH from that when 25-OH-D = 100 nmol/L; ie, reflecting presumed sufficiency) indeed first arises in the range of the indicated thresholds (70–90 nmol/L). However, PTH stimulation in pregnancy differs from that in the postpartum. First, throughout the 25-OH-D range between approximately 40 nmol/L and 90 nmol/L, the degree of PTH stimulation in pregnancy appears to be higher than that which would be expected for the same 25-OH-D concentration in the postpartum. For example, at 25-OH-D of 75 nmol/L, the PTH stimulation in pregnancy (9.1%) is significantly higher than that at either 3 months or 12 months postpartum (both comparisons, P < .0001). Secondly, as 25-OH-D falls below 30 nmol/L, there is a sharp increase in PTH stimulation in the postpartum that does not occur in pregnancy. Indeed, in contrast to the characteristic nongravid relationship that is seen in the postpartum, there appears to be a linear enhancement of PTH stimulation as 25-OH-D declines in pregnancy.
Discussion
There are three key strengths of this study. First, the serial assessments at late pregnancy, 3 months postpartum, and 12 months postpartum made it possible to compare the 25-OH-D/PTH relationship between pregnancy and the nongravid state within a single cohort of women—an optimal study design that, to our knowledge, has not been previously applied toward this research question. Second, this large patient population (n = 468) presented a broad range of 25-OH-D at each visit (as shown in Figure 1). Third, at each of the visits, we have performed rigorous mathematical interrogation of the relationship between 25-OH-D and PTH, yielding the following three key findings pertaining to the differences between pregnancy and the postpartum.
First, when serum 25-OH-D declines to the point where PTH is no longer suppressed, there is a linear relationship between PTH and falling 25-OH-D in pregnancy but a curvilinear relationship at 3 and 12 months postpartum. Second, the 25-OH-D thresholds associated with PTH suppression are similar between pregnancy (82 nmol/L), 3 months postpartum (71 nmol/L), and 12 months postpartum (81 nmol/L). Third, in most of the women, serum 25-OH-D was lower than these thresholds at the respective study visits, suggesting that current antenatal supplementation may be inadequate.
In pregnancy, antepartum maternal adaptations such as enhanced intestinal calcium absorption serve to meet the fetal requirements for calcium, even in the setting of suboptimal vitamin D status (4, 18). Accordingly, one might anticipate that the relationship between 25-OH-D and PTH in pregnancy may be distinct from that in the nongravid state. Indeed, previous cross-sectional studies in pregnancy have suggested that the antepartum correlation between 25-OH-D and PTH is weaker than that which is to be expected outside of pregnancy (19, 20). However, the current study does not support this suggestion by directly demonstrating similar correlations during and after pregnancy (both before and after covariate adjustment). Interestingly, the few previous studies that have plotted serum 25-OH-D vs PTH in pregnancy also displayed a linear relationship (21–23). However, owing to their cross-sectional designs, these studies could not determine whether the observed linearity was a feature of the study population, as opposed to pregnancy. The current study confirms that it is indeed a feature of gestation by demonstrating in the same set of women that the distinctive linear 25-OH-D/PTH relationship in pregnancy becomes the more familiar curvilinear shape in the postpartum. Furthermore, we have applied rigorous statistical modeling to formally confirm that these relations indeed represent the best fit for the 25-OH-D/PTH data in these settings. The linear relationship in pregnancy is partly a reflection of the absence of marked PTH stimulation when 25-OH-D falls below 30 nmol/L (as shown in Figure 2), although the physiological basis for this differential response as compared to the nongravid state remains to be determined.
Despite the differences in the shape of the 25-OH-D/PTH relationship during and after pregnancy, the issue of clinical importance is the 25-OH-D threshold at which PTH is suppressed, based on the argument that loss of such suppression is an endocrine indicator of physiological insufficiency (even when the relevant clinical outcomes of the insufficiency remain to be established). These thresholds were identified on segmented regression analysis at each of the three study visits (Table 2) and supported by the observed PTH stimulation patterns in Figure 2. In doing so, the current analyses have provided two key points of insight. First, the 25-OH-D thresholds at the study visits in pregnancy and 3 and 12 months postpartum were all in the range of 71 to 82 nmol/L, consistent with the diagnostic criterion for vitamin D sufficiency that the Endocrine Society has endorsed in nonpregnant adults (25-OH-D > 75 nmol/L) (24). Second, there were no significant differences between the thresholds at the three visits, suggesting that, despite differences in the 25-OH-D/PTH relationship, the target 25-OH-D to be achieved for vitamin D sufficiency in pregnancy is similar to that in the first year postpartum.
Of note, in most of the women, serum 25-OH-D was lower than the indicated thresholds for PTH suppression at the respective study visits, suggesting a possible role for greater vitamin D supplementation. However, it should also be recognized that the use of supplementation progressively declined from pregnancy (83.7%) to 3 months postpartum (56.0%) to 12 months postpartum (36.1%). Moreover, it should also be recognized that, despite its basis in classical endocrine physiological reasoning, our assumption that the 25-OH-D threshold at which PTH is suppressed should be a target level for vitamin D supplementation has not been established in relation to clinical outcomes. Taken together with the observational design of the study, definitive conclusions pertaining to the dosing of antenatal vitamin D supplementation thus cannot be drawn. Nevertheless, the observation that 74.6% of the women had serum 25-OH-D below the identified threshold in pregnancy (82 nmol/L), despite the fact that 83.7% of them were taking calcium/vitamin D supplements at the time, indirectly supports the emerging concept that current antenatal vitamin D supplementation should be increased. Ultimately, the question of optimal dosing of vitamin D supplementation in pregnancy will need to be addressed in clinical trials (11, 12).
A limitation of this study is that the precise formulations and doses of supplements were not characterized. Nevertheless, for the vast majority of the study participants, supplementation was in the form of antenatal vitamins, which typically contain 400 IU of vitamin D. Another limitation is that PTHrP was not measured, recognizing that its effects on mineral homeostasis during lactation could be relevant to the current findings. In addition, serum calcium was not measured, although it should be recognized that this study was conducted in a population of healthy young pregnant women, without major medical comorbidities. Moreover, the study design of comparing the 25-OH-D/PTH relationship during and after pregnancy in the same population of women would be expected to partially mitigate the impact of such patient-specific factors in the comparison of pregnancy to the postpartum. Indeed, this comparative approach was specifically designed to provide insight into the 25-OH-D/PTH relationship in pregnancy, as compared to the nongravid state.
In summary, the shape of the relationship between 25-OH-D and PTH differs between pregnancy and the postpartum. Specifically, when serum 25-OH-D is below the threshold at which PTH is suppressed, the relationship is linear in pregnancy but curvilinear in the postpartum. Importantly, however, the 25-OH-D thresholds associated with PTH suppression are similar between pregnancy (82 nmol/L), 3 months postpartum (71 nmol/L), and 12 months postpartum (81 nmol/L). Although these data suggest similar thresholds for vitamin D sufficiency at all three points in time, the limited achievement of these targets offers support for the emerging concept that greater antenatal vitamin D supplementation warrants evaluation in clinical trials.
Acknowledgments
This work was supported by operating grants MOP-84206 and MHC-115442 from the Canadian Institutes of Health Research and OG-3–11-3300-RR from the Canadian Diabetes Association. C.K.K. holds a Banting and Best Diabetes Centre New Investigator Award. A.J.H. holds a Tier-II Canada Research Chair in Diabetes Epidemiology. B.Z. holds the Sam and Judy Pencer Family Chair in Diabetes Research at Mount Sinai Hospital and the University of Toronto. R.R. holds a Heart and Stroke Foundation of Ontario Mid-Career Investigator Award.
Author contributions: C.K.K. and R.R. designed the analysis plan, contributed to the analyses, and wrote the first draft of the manuscript. C.Y. performed the statistical analyses. R.R. supervised the analysis and manuscript. A.J.H., P.W.C., M.S., B.Z., and R.R. were involved in the design/implementation of the overall study. All authors contributed to interpretation of the data and critical revision of the manuscript. All authors approved the manuscript. R.R. had full access to all of the data in the study and takes responsibility for the integrity of the data and the accuracy of the data analysis.
Disclosure Summary: The authors have nothing to disclose.
