


Abstract
Polycystic ovary syndrome (PCOS) is a common cause of anovulation. It may also negatively affect the endometrium, which could lead to implantation failure and proliferative aberrations.
Our objective was to study sex hormone receptors in the endometrium of women with PCOS.
This is a cross-sectional study and lifestyle intervention.
Clinical and laboratory research unit was undertaken at a university hospital.
Twenty overweight/obese women fulfilling all three PCOS criteria (anovulation, hyperandrogenism, and polycystic ovaries), 10 body mass index–matched regularly menstruating controls, 11 normal-weight women with PCOS, and 11 normal-weight controls.
Intervention for this study included dietary management and physical exercise.
mRNA levels and immunostaining of estrogen receptor α (ERα) and β (ERβ), nongenomic estrogen receptor α36 (ERα36), and G-protein–coupled estrogen receptor-1 (GPER), and the androgen receptor (AR) on cycle days 6–8 and cycle days 21–23.
Before intervention, mRNA levels of ERα, ERα36, and the ERα/ERβ mRNA ratio were lower in proliferative endometrium of overweight/obese PCOS women compared with controls (P < .05). After intervention, ERα protein and the ERα/ERβ protein ratio in proliferative endometrium increased and were higher in PCOS women with improved menstrual function than in those without improvement (P < .05). In the subgroup of PCOS women with restored ovulation, only higher protein levels of GPER were found in secretory endometrium (P < .01). However, PCOS women who remained anovulatory had higher protein levels of ERα, GPER, and AR on cycle days 21–23 than controls (P < .05).
Lifestyle intervention alters, but does not fully restore, ER and AR expression in proliferative and secretory endometrium of obese women with PCOS.
Polycystic ovary syndrome (PCOS) is one of the most common endocrine disorders in women of reproductive age (1). It affects about 10% of fertile age women and is characterized by hyperandrogenism, chronic anovulation, and polycystic ovaries. In many cases, the syndrome is associated with metabolic changes such as insulin resistance and hyperinsulinemia (2). Obesity is highly prevalent among women with PCOS, contributing to both metabolic and reproductive disturbances (3).
The endocrine and metabolic abnormalities associated with PCOS may negatively affect the endometrium, as revealed by altered receptivity, implantation failure, and increased incidence of endometrial hyperplasia and cancer in these women (4, 5). Thus, impaired fertility in PCOS women derives not only from anovulation, but probably also from a disturbed endometrial function. There are very few studies on endometrial function in women with PCOS.
Endometrial development and function is highly dependent on cyclic secretion of sex steroid hormones and expression of their cognate receptors (4). Proliferation and differentiation of the endometrium are regulated by estrogens (5). Estrogen actions are mediated via the genomic pathways by nuclear estrogen receptor α and β (ERα and ERβ) as well as via more rapid, nongenomic pathways such as ERα36 and G-protein–coupled ER-1 (GPER) (5, 6).
The expression of both ERα and ERβ in the endometrium increases during the proliferative phase of the normal menstrual cycle and then gradually decreases during the secretory phase in preparation for embryo implantation (4). The two nuclear ERs seem to have opposite biological effects in the endometrium (7). ERα promotes mitogenic activity and therefore proliferation, whereas ERβ protects the endometrium from undesired actions of ERα stimulation (7). Estrogenic actions in the endometrium are dependent on coexpression of both receptors and could be described by the ERα/ERβ ratio.
GPER is localized on the cell membrane and in the endoplasmic reticulum and has been suggested to regulate endometrial cell growth and proliferation through interaction with ERα (8, 9). Expression of endometrial GPER was found to be regulated by ovarian steroids in a similar way as ERα and ERβ (ie, up-regulation in the proliferative phase and down-regulation in the secretory phase) (8, 10). ERα36 is mainly localized on the cell surface, and its lower expression was shown to be associated with the development of endometrial hyperplasia (6).
In the endometrium of women with PCOS, the expression and distribution of ERs as well as their role and function remain unclear. In a series of studies by Vega and collaborators, endometrial ERα immunostaining was shown to be higher in the stroma and epithelium of PCOS women compared to healthy controls in the proliferative phase of the menstrual cycle (11, 12). Limited data have been published regarding the role of membrane bound receptors in the endometrium of women with PCOS. Recently, mRNA and protein expression of ERα36 was shown to be lower in proliferative endometrium (6), whereas expression of GPER was lower in secretory endometrium (13) of PCOS women compared to controls.
Androgens are known to inhibit endometrial proliferation and differentiation (14, 15) via the nuclear androgen receptor (AR). AR has been found in stromal and epithelial cells of the endometrium with higher expression in the proliferative phase compared to the secretory phase (16). AR is positively regulated by estrogens and androgens, but down-regulated by progesterone (16). Women with PCOS exhibit a higher mRNA and protein expression of AR in the epithelial cells of the endometrium compared to controls (5).
Change in lifestyle is an important therapy for obese women with PCOS (17). We have previously demonstrated that weight loss and exercise improve all clinical parameters of PCOS (18, 19). We have also shown that lifestyle intervention up-regulates gene and protein levels of molecules involved in insulin signaling in the endometrium (20). However, the effect of lifestyle changes on endometrial expression of steroid hormone receptors is not known. The aim of the present study was to investigate genomic and nongenomic estrogen receptors and the androgen receptor in the endometrium of women with PCOS before and after an individualized dietary and exercise program and in comparison to controls.
Materials and Methods
Subjects
The study was performed at the Women's Health Research Unit at the Karolinska University Hospital, Stockholm, Sweden, and has been described in detail previously (20). In short, women of reproductive age (18–40 years) fulfilling the tree Rotterdam criteria of PCOS (ie, oligo- or anovulation, hyperandrogenism, and polycystic ovaries on ultrasound) (21), as well as age- and body mass index (BMI)–matched controls were recruited between 2008 and 2012. All were nonsmoking and free of any hormonal treatment for at least 3 months before the study. Additional exclusion criteria were pregnancy or lactation during the preceding 12 months, current disease, or other endocrine disorders besides PCOS, eating disorders, and regular medications, including insulin-sensitizing drugs.
The participants were divided into four groups according to PCOS diagnosis and BMI: PCOS women with a BMI greater than 27 (OB-PCOS), n = 20; healthy overweight/obese women with a BMI greater than 27 (OB-C), n = 10; women with PCOS and BMI lower than 25 (NW-PCOS), n = 11; and healthy normal-weight women with BMI lower than 25 (NW-C), n = 11.
All women in the OB-PCOS and NW-PCOS groups were initially anovulatory, with either amenorrhea (no bleeding for the past 3 month) or oligomenorrhea (five to nine periods during the past year with intervals more than 6 weeks), whereas the women in the OB-C and NW-C groups were menstruating regularly.
Ethical approval
Written informed consent was obtained from all participants. The study was approved by the local ethics committee (2008/865-32).
The intervention
The women in the OB-PCOS group underwent 3 months of an individually adapted lifestyle intervention program aimed at weight reduction (20). Participants were closely supervised by a dietician (Å.N.) who recommended a diet high in protein and low in carbohydrates (40 Energy [E] % carbohydrates, 30E% fat, and 30E% proteins) (22, 23). A strict regimen of three main meals and two or three snacks were introduced. Food intake was self-reported and corrected if needed.
To increase physical activity, all women in the OB-PCOS group received membership of a local gym network and recommendations concerning frequency, duration, and type of training exercise. Recommendations were based on each individual's situation, interest, and experience. An average physical activity included aerobic activity for 45 minutes two or three times per week. Participation was recorded by the gym staff.
Experimental design
The women in the OB-PCOS group were examined before and after three months of lifestyle intervention on cycle days 6–8 and 21–23 of the menstrual cycle, as determined by spontaneous menstruation or by induced menstruation after a progestational test. A fasting blood sample was collected from a peripheral vein at 8:00 am for analysis of hormones and binding proteins. Gynecological examination, including transvaginal ultrasound, was performed by the same investigator (A.L.H.) using Sonoline SL-250 equipment (Siemens Healthcare Diagnostics). In addition, endometrial biopsies were collected under local anesthesia using an endometrial suction curette (Pipet Curet, CooperSurgical).
During the lifestyle intervention, the menstrual pattern of the women in the OB-PCOS group was recorded and ovulation was confirmed by an elevated serum level of progesterone (>17 nmol/liter) in the luteal phase of the menstrual cycle. The menstrual pattern was considered to be improved when there was a shift from amenorrhea to oligomenorrhea/regular menstruation or from oligomenorrhea to regular menstruation. The women in the OB-C, NW-PCOS, and NW-C groups were examined during a single menstrual cycle on cycle days 6–8 and 21–23.
Specimen
The obtained endometrial biopsies were divided into two pieces: one was preserved in RNAlater for future isolation of RNA and the other one was fixed in 4% phosphate buffered formaldehyde for 9 hours and then transferred to 70% ethanol for later embedding in paraffin.
RNA preparation and reverse transcription
Total RNA from endometrial biopsies were purified with RNeasy Mini Kit (Qiagen GmbH) in accordance to the manufacture's protocol, including a DNase treatment step. Reverse transcription was performed using 2 μg of total RNA from each sample and the reaction mixture (Qiagen) containing 1 × RT buffer, dNTP mix (0.5 mM each dNTP), 600 ng random primers (Invitrogen), 30 U RNase inhibitor (Qiagen), and 4 U Omniscript reverse transcriptase (Qiagen). A total volume of 20 μl was reverse transcribed at 37°C for 60 minutes.
Real-time PCR analysis
The oligonucleotide primers for ERα, ERβ, GPER, ERα36, AR, and RPL13A (housekeeping gene) are presented in Supplemental Table 1. Real-time PCR was performed as presented in the Supplemental Material and Methods.
Immunohistochemistry
The protein expression of ERα, ERβ, GPER, and AR was evaluated. ERα36 was not assessed by immunohistochemistry since we found no antibody that worked properly. Immunostaining was performed on 5-μm-thick sections using a standard immunohistochemical technique (avidin-biotin-peroxidase) as previously described (24). Before applying the primary antibody all slides were blocked with normal horse serum diluted in either PBS or Tris-buffered saline. Thereafter, the primary and secondary antibodies were applied, using dilutions and incubation times as presented in Supplemental Table 2.
Image analysis
A Leica microscope and Sony video camera connected to a computer with an image analysis system (Leica Imaging System Ltd) were used to perform quantitative evaluation of the nuclear ERα, ERβ, and AR immunostaining. The quantification of immunostaining was performed on 10 randomly chosen fields and performed as previously reported (25). When fewer than 10 fields were available for analyses, all epithelia or stroma cells were used for evaluation. An image analysis system using color discrimination software was used to calculate the total area of positively stained nuclei (brown) expressed as a ratio of the total area of cell nuclei (brown + blue negative). Luminal epithelium, glandular epithelium, and stroma were evaluated separately.
Manual scoring
The intensity and tissue distribution of cytosolic GPER immunostaining were manually and independently evaluated by two investigators blinded to the group using a four-group grading scale: (–) negative, (+) faint, (++), moderate; and (+++) strong immunostaining. The correlation between the two observers with this method was r = 0.75 (P = .001) for the three tissue types.
Serum analysis
Serum concentrations of T were analyzed by liquid chromatography/tandem mass spectrometry. Serum concentrations of LH, FSH, insulin and sex hormone-binding globulin (SHBG) were determined by chemiluminescent enzyme immunometric assays, and estradiol (E2) by a sensitive RIA as previously described (24). For detection limits and coefficient of variations, see the Supplemental Materials and Methods.
Statistics
All values are expressed as mean ± standard deviation (SD) or median and quartile range (P25–P75) depending on distribution. Differences between more than two groups were evaluated by the Kruskal-Wallis test followed by Dunn's test, whereas differences between two groups were performed by the Mann-Whitney U test. Repeated measurements of data before and after the interventions were analyzed employing the Mixed procedure in SAS. The between-subgroup factor in the model was outcome (improved menstrual function or no improvement) and the interaction group*time refers to the statistical test of whether the effect of the intervention was the same for the two groups. Before these analyses, certain variables were log-transformed to compensate for their positively skewed distributions. Correlations between the variables were evaluated using the Spearman's rank order correlation test. The significant level was set at P < .05.
Results
Baseline characteristics of overweight/obese and normal-weight women with and without PCOS
Clinical characteristics
The age and endocrinological parameters for OB and NW women with PCOS as well as their BMI-matched controls are shown in Table 1. Before intervention the OB-PCOS group had significantly higher serum levels of total and free T and lower levels of FSH and SHBG than the OB-C group in the mid-proliferative phase of the menstrual cycle, as previously reported (20). In the combined OB-PCOS and OB-C groups, endometrial thickness was greater (5.4 ± 1.9 mm vs 3.5 ± 1.8 mm) and estradiol levels were higher (156.5 ± 66.9 pmol/liter vs 121.8 ± 55.5) pmol/liter) than in the combined NW groups (P < .001 and P < .05, respectively).
Clinical Characteristics, Endocrinological Variables, and Relative mRNA Levels of ERs and the AR on Cycle Days 6–8 in OB-PCOS, OB-C, NW-PCOS, and NW-C Groups
| OB-PCOS# n = 18 | OB-C n = 10 | NW-PCOS n = 11 | NW-C n = 11 | |
|---|---|---|---|---|
| Age | 28.2 ± 4.9 | 33.5 ± 3.4 | 28.4 ± 5.5 | 27.2 ± 5.9 |
| BMI (kg/m2) | 37.4 ± 5.4 | 34.0 ± 5.1 | 21.9 ± 1.8 | 21.7 ± 1.8 |
| Endometrial thickness (mm) | 5.6 ± 2.2a | 5.2 ± 1.3a | 3.6 ± 2.1b | 3.4 ± 1.5b |
| Endocrinological variables | ||||
| LH (IU/I) | 4.6 ± 1.6a | 4.9 ± 2.0a,b | 8.6 ± 3.1b | 4.7 ± 1.1a |
| FSH (IU/I) | 5.1 ± 1.1a | 7.3 ± 2.9b | 6.9 ± 2.1b | 6.7 ± 2.4b |
| Total testosterone (nmol/liter) | 1.3 ± 0.6a | 0.7 ± 0.2b | 1.2 ± 0.3a,b | 1.0 ± 0.3a,b |
| SHBG (nmol/liter) | 27.4 ± 11.3a | 41.9 ± 18.6b | 63.5 ± 25.7b | 68.4 ± 22.6b |
| Free testosterone (pmol/liter) | 31.4 ± 18.3a | 12.4 ± 5.1b,c | 18.1 ± 5.5a,b | 12.8 ± 3.7c |
| Estradiol (pmol/liter) | 148 ± 66 | 171 ± 70 | 108 ± 31 | 134 ± 70 |
| Insulin (mIU/liter) | 75.6 ± 81.2a | 31.5 ± 15.6a,b | 17.8 ± 6.9b | 22.9 ± 14.6b |
| Relative mRNA expression | ||||
| ERα | 1.0 (0.7–1.3)a | 2.1 (1.6–2.4)b | 1.6 (1.2–1.6)a,c | 1.5 (1.3–1.8)b,c |
| ERβ | 0.3 (0.2–0.3)a,b | 0.3 (0.2–0.4)b | 0.1 (0.1–0.2)c | 0.2 (0.1–0.3)a,b,c |
| ERα/ERβ ratio | 4.3 (2.9–5.2)a | 7.5 (4.7–8.5)b | 10.1 (7.6–11.5)b | 6.9 (5.8–12.5)b |
| ERα36 | 0.5 (0.4–0.7)a,c | 1.8 (1.0–2.9)b | 0.8 (0.5–0.9)a,b,c | 0.8 (0.6–1.2)c |
| GPER | 0.08 (0.04–0.1) | 0.06 (0.05–0.09) | 0.04 (0.03–0.07) | 0.06 (0.03–0.1) |
| GPER/ERα36 ratio | 0.1 (0.05–0.3)a | 0.04 (0.01–0.08)b | 0.08 (0.05–0.1)a,b | 0.07 (0.06–0.1)a,b |
| AR | 1.4 (0.9–1.9) | 1.7 (0.6–3.0) | 1.8 (1.6–2.1) | 1.6 (1.1–2.2) |
The values are presented as means ± sd or medians with quartile range (25th–75th quartiles).
Before the intervention.
Values with different designations are significantly different (P < 0.05).
Gene and protein expression on cycle days 6–8
The mRNA expression of ERα and ERα36 was lower in proliferative endometrium of OB-PCOS women before the intervention compared to the BMI-matched controls (Table 1). The ERβ mRNA level in OB-PCOS women was comparable to the OB-C group, but both obese groups were higher compared to the NW-PCOS group. Consequently, the ERα/ERβ ratio was lowest in the OB-PCOS group (Table 1). There were no significant differences in either AR mRNA or GPER mRNA levels between groups; however, the GPER/ERα36 ratio was significantly higher in the OB-PCOS group compared to the OB-C group.
The combined group of PCOS women (OB-PCOS + NW-PCOS) exhibited lower mRNA levels of ERα and ERα36, and a lower ERα/ERβ ratio compared to the BMI-matched controls (Figure 1). On the other hand, the combined group of overweight/obese individuals (OB-PCOS + OB-C) had higher ERβ mRNA expression and consequently a lower ERα/ERβ ratio compared to the NW individuals (NW-PCOS + NW-C) (Figure 1). Furthermore, the combined group of PCOS women exhibited increased immunostaining of AR in luminal epithelium (6.2 [0.6–13.5]) compared to the controls (0.1 [0–1.8], P < .01).
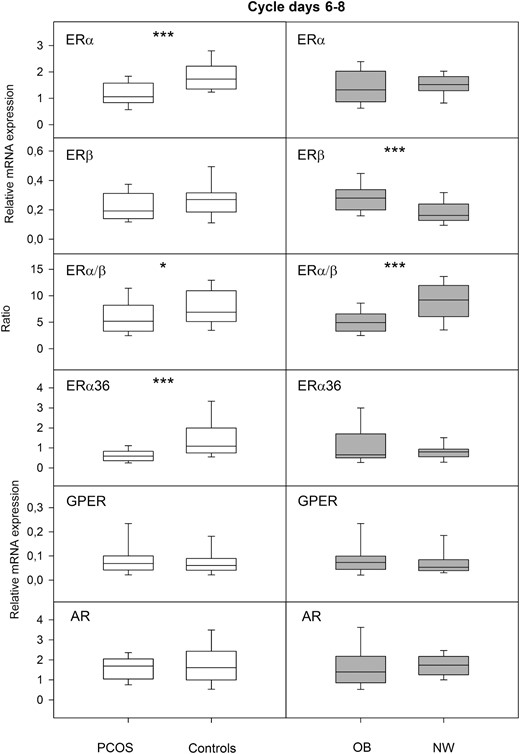
The left panel shows relative mRNA expression of the nuclear receptors ERα and ERβ, their ratio, and the nongenomic receptors ERα36 and GPER, and AR in proliferative endometrium of the combined group of normal-weight and obese PCOS women (PCOS, n = 29) compared to the combined group of normal-weight and obese controls (controls, n = 21). The right panel shows the same receptor parameters in proliferative endometrium of the combined group of obese women with or without PCOS (OB, n = 28) compared to the combined group of normal-weight women with or without PCOS (NW, n = 22). Box-and-whisker plots represent the median and interquartile range (P25–P75). *P < .05, ***P < .001.
Correlations
In the entire material, on cycle days 6–8, BMI correlated positively with endometrial thickness (r = 0.48) and the ERβ mRNA level (r = 0.30), and negatively with the ERα/ERβ mRNA ratio (r = −0.48). In the combined group of PCOS women, serum levels of free T correlated negatively with the mRNA levels of ERα (r = −0.45) and ERα36 (r = −0.46), and positively with the GPER mRNA level (r = 0.55) (Supplemental Figure 1). Moreover, in the same group serum levels of insulin correlated negatively with the ERα mRNA level (r = −0.46) and the ERα/ERβ mRNA ratio (r = −0.58). All the correlations presented previously are statistically significant (P < .05).
Effects of lifestyle intervention
Clinical outcome
Eighteen of the initially 20 overweight/obese women with PCOS completed the lifestyle intervention. Two women dropped out for personal reasons. After 3 months of intervention, body weight was reduced in 83% (on average by 5%), menstrual pattern improved in 66%, and ovulation was confirmed in 35% of the women, as previously reported (20). There were also a significant decrease in insulin levels and increases in LH and FSH levels (Table 2). The subgroup of women with improved menstrual function (n = 12), shifting from amenorrhea to oligomenorrhea/regular menstruation or from oligomenorrhea to regular menstruation, showed a weak trend for a greater weight loss than the subgroup of women who had no improvement of menstrual function (n = 6) (P = .083).
The Change in Clinical Characteristics, Endocrinological Variables, and mRNA Expression on Cycle Days 6–8 After Lifestyle Intervention in Overweight/Obese Women With PCOS
| Change n = 18 | |
|---|---|
| BMI | −1.6 ± 1.5a |
| Weight (kg) | −4.8 ± 4.3a |
| Endometrial thickness (mm) | −0.9 ± 2.5 |
| Endocrinological variables | |
| LH (IU/I) | 1.8 ± 2.5b |
| FSH (IU/I) | 0.9 ± 1.3c |
| Total testosterone (nmol/liter) | −0.1 ± 0.7 |
| SHBG (nmol/liter) | 0.1 ± 14.2 |
| Free testosterone (pmol/liter) | −3.5 ± 23.8 |
| Estradiol (pmol/liter) | −18.1 ± 102.3 |
| Insulin (mIU/liter) | −24.5 ± 37.3b |
| Relative mRNA expression | |
| ERα | 0.06 (−0.2 to 0.4) |
| ERβ | −0.03 (−0.09 to 0.02) |
| ERα/ERβ ratio | 0.5 (−0.5 to 1.5) |
| ERα36 | −0.03 (−0.09 to 0.02) |
| GPER | −0.03 (−0.09 to 0.02)c |
| GPER/ERα36 ratio | −0.02 (−0.2 to 0.05) |
| AR | 0.4 (−0.2 to 1.3) |
The before values for the OB-PCOS women are presented in Table 1. The values are presented as means ± sd or medians with quartile range (25th–75th quartiles).
Significant changes compared to before lifestyle intervention as follows:
P < .001;
P < .01;
P < .05.
Gene and protein expression on cycle days 6–8
After the intervention, there was a reduction in GPER mRNA expression in proliferative endometrium of the whole group of OB-PCOS women (P < .05), but no other changes in gene expression were found (Table 2). Strong nuclear immunostaining of ERα, ERβ, AR, and moderate to strong cytosolic immunostaining of GPER was observed in all endometrial compartments (Figure 2A). After lifestyle intervention, there were no significant differences in receptor expression within the entire group (n = 18). However, the change in stromal ERα immunoreactivity was significantly different between the subgroups of PCOS women with or without improved menstrual function (Figure 2B). Thus, the stromal ERα immunoreactivity, and subsequently the ERα/ERβ protein ratio, was significantly higher after intervention in those with improvement than those with no improvement (Figure 2B).
![(A) Representative images of ERα, ERβ, GPER, and AR immunoreactivity before and after lifestyle intervention in proliferative endometrium of OB-PCOS women with improved menstrual function (n = 12). (B) ERα immunostaining in stroma of proliferative endometrium before and after lifestyle intervention and the change in ERα immunostaining in stroma following lifestyle intervention in the subgroups of overweight/obese women with PCOS (improved menstrual function [n = 12] and no improvement [n = 6]). Box-and-whisker plots represent the median and interquartile range (P25–P75). * P < .05.](https://oup.silverchair-cdn.com/oup/backfile/Content_public/Journal/jcem/101/2/10.1210_jc.2015-3803/2/m_zeg9991522860002.jpeg?Expires=1748935410&Signature=f9mR~byT-FYpXPUBh2~ekeu~o5Zz6K2Cadfrh0S9jgMwPyyIR2CS7bpWg1sdjVWUqRA4UNihljC3yNgh6Mo0PGEIp9cvfS9GIRvWqG2F5yRfinX4ZkUB~Mfytxe5ZcWvx~dJyvQzdd7lI-f1el-14ByP1jSUJWH~QprD4F4SbzNrW-Nd84~HOr86ZxFQrdUAXBthWLsmQzQDD25hdZDjRdXOjRM9CLMoAcFDx1NhXEXMmvXC0i9W0k7HFPVOVbnK3fcnfA90y2m5K2Dz4eJDV87L1Rmp48~NZ~tGIzZ~WFnWRJWg~v4n6o-vOJ~fUiZ-Y1FuAHkj47Q49NX0RUkbpw__&Key-Pair-Id=APKAIE5G5CRDK6RD3PGA)
(A) Representative images of ERα, ERβ, GPER, and AR immunoreactivity before and after lifestyle intervention in proliferative endometrium of OB-PCOS women with improved menstrual function (n = 12). (B) ERα immunostaining in stroma of proliferative endometrium before and after lifestyle intervention and the change in ERα immunostaining in stroma following lifestyle intervention in the subgroups of overweight/obese women with PCOS (improved menstrual function [n = 12] and no improvement [n = 6]). Box-and-whisker plots represent the median and interquartile range (P25–P75). * P < .05.
Correlations
After lifestyle intervention, there were strong positive correlations between improved menstrual function and the ERα/ERβ protein ratio in both stroma (r = 0.55) and glands (r = 0.75) in proliferative endometrium. Furthermore, endometrial thickness and the serum estradiol level correlated positively with the ERα/ERβ protein ratio in luminal epithelium (r = 0.60) and glands (r = 0.67), respectively. All the correlations presented previously are statistically significant (P < .05).
PCOS women with or without restored ovulation after lifestyle intervention and their controls
Clinical outcome
Six of the 18 PCOS women had confirmed ovulation and luteal phase at cycle days 21–23 following lifestyle intervention. On cycle days 21–23, OB-PCOS women with no luteal phase had higher serum levels of LH and FSH and lower serum levels of SHBG, estradiol, and progesterone compared to the OB-PCOS and OB-C groups with confirmed luteal phase (Table 3). However, serum levels of total T were higher on cycle days 21–23 in both subgroups of OB-PCOS women compared to OB-controls.
Clinical Characteristics and Relative mRNA Expression on cd 6–8) and 21–23 After Lifestyle Intervention in OB-PCOS Women With Confirmed Luteal Phase or Not and OB-C
| After Lifestyle Intervention | OB-C Confirmed Luteal Phase n = 10 | |||||
|---|---|---|---|---|---|---|
| OB-PCOS No Luteal Phase n = 12 | OB-PCOS Confirmed Luteal Phase n = 6 | |||||
| cd 6–8 | cd 21–23 | cd 6–8 | cd 21–23 | cd 6–8 | cd 21–23 | |
| BMI (kg/m2) | 36.1 ± 5.4 | 34.9 ± 4.5 | 34.0 ± 5.1 | |||
| Endocrinological variables | ||||||
| LH (IU/I) | 7.0 ± 3.5 | 12.0 ± 5.9*,a | 5.9 ± 0.7 | 6.4 ± 3.2b | 4.9 ± 2.0 | 4.6 ± 2.1b |
| FSH (IU/I) | 6.0 ± 1.3 | 5.9 ± 0.9a | 5.9 ± 1.9 | 2.9 ± 1.2***,b | 7.3 ± 2.9 | 3.0 ± 0.8***,b |
| Total testosterone (nmol/liter) | 1.7 ± 0.7 | 2.2 ± 0.7***, a | 1.5 ± 0.6 | 1.9 ± 0.3*, a | 0.7 ± 0.2 | 1.3 ± 0.4***, b |
| SHBG (nmol/liter) | 24.7 ± 19.5 | 28.3 ± 33.6a | 32.9 ± 10.9 | 39.3 ± 17.7b | 41.9 ± 18.6 | 48.1 ± 20.5***, b |
| Free testosterone (pmol/liter) | 45.7 ± 24.7 | 58.7 ± 26.3**, a | 34.2 ± 17.3 | 38.0 ± 13.5a,b | 12.4 ± 5.1 | 21.4 ± 6.6***, b |
| Estradiol (pmol/liter) | 118 ± 41 | 288 ± 11*, a | 183 ± 97 | 587 ± 416*, b | 171 ± 70 | 356 ± 68***, b |
| Progesterone (nmol/liter) | 3.9 ± 0.9a | 34.9 ± 25.7b | 33.3 ± 11.9b | |||
| Relative mRNA expression | ||||||
| ERα | 1.0 (0.8–1.2) | 0.9 (0.7–1.0)a | 1.1 (1.0–1.2) | 0.6 (0.4–0.8)*, a,b | 2.1 (1.6–2.4) | 0.3 (0.3–0.7)***, b |
| ERβ | 0.3 (0.2–0.3) | 0.2 (0.2–0.3)* | 0.2 (0.2–0.2) | 0.3 (0.2–0.3) | 0.3 (0.2–0.4) | 0.2 (0.2–0.6) |
| ERα/ERβ ratio | 3.4 (2.6–4.5) | 3.9 (3.3–4.9) | 5.5 (5.0–7.7) | 2.3 (1.6–2.5)* | 7.5 (4.7–8.5) | 1.2 (0.5–3.3)*** |
| ERα36 | 0.7 (0.4–1.0) | 0.3 (0.2–0.5)**, a | 0.3 (0.2–0.4) | 0.4 (0.2–0.4)a,b | 1.8 (1.0–2.9) | 0.8 (0.5–1.0)**, b |
| GPER | 0.06 (0.04–0.08) | 0.2 (0.09–0.2)**, a | 0.04 (0.04–0.05) | 0.02 (0–0.03)a,b | 0.06 (0.05–0.09) | 0.01 (0–0.02)***, b |
| GPER/ERα 36 | 0.07 (0.04–0.2) | 0.7 (0.3–1.2)**, a | 0.2 (0.1–0.3) | 0.05 (0.03–0.09)a,b | 0.04 (0.01–0.08) | 0.02 (0.009–0.04)*, b |
| AR | 1.7 (1.3–2.6) | 1.4 (1.0–1.9) | 1.7 (1.6–2.2) | 0.7 (0.6–0.9) | 1.7 (0.6–3.0) | 0.6 (0.3–1.8) |
The values are presented as means ± sd or medians with quartile range (25th–75th quartiles).
cd, cycle day.
Significant changes within groups are marked as follows:
P < .05;
P < .01;
P < .001.
Significant changes on cd 21–23 between groups. Values with different letter designations are significantly different (P < 0.05).
Gene expression on cycle days 21–23
In the OB-C group, endometrial mRNA expression of ERα, ERα36, and GPER, and subsequently the ERα/ERβ and GPER/ERα36 ratios decreased on cycle days 21–23 compared to the proliferative phase of the menstrual cycle (Table 3). The same was found for ERα and ERα/ERβ in the OB-PCOS group of women with a confirmed luteal phase but not for the OB-PCOS women who remained anovulatory. Instead, this latter subgroup displayed a higher GPER mRNA level and GPER/ERα36 mRNA ratio on cycle days 21–23 compared to cycle days 6–8 (Table 3). Furthermore, the mRNA levels of ERα, GPER, and the GPER/ERα36 mRNA ratio were higher, whereas expression of ERα36 was lower on cycle days 21–23 in OB-PCOS women with no luteal phase compared to the controls (OB-C) (Table 3). In the OB-PCOS group with confirmed luteal phase, the mRNA expression of ERs on cycle days 21–23 was in between the two other groups and not significantly different from neither OB-PCOS women with no luteal phase nor the controls (Table 3). There was no significant difference in mRNA levels of AR between groups on cycle days 21–23.
Protein expression on cycle days 21–23
In anovulatory OB-PCOS women, the ERα/ERβ ratio in GE, GPER immunostaining in stroma and GE, and immunostaining of AR in all endometrial compartments were significantly higher on cycle days 21–23 compared to the BMI-matched controls (Figure 3). In the OB-PCOS group with confirmed luteal phase, merely immunostaining of GPER in stroma was higher than in the controls. In this group, immunostaining of AR was in between the two other groups and not significantly different from neither anovulatory OB-PCOS women nor the controls (Figure 3).
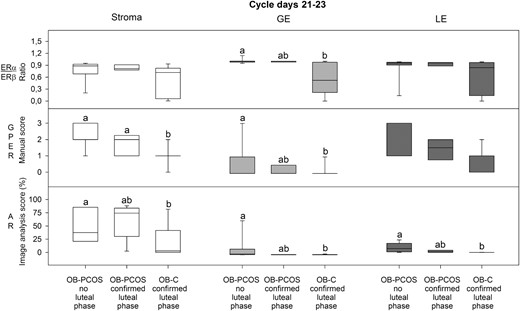
Results from immunohistochemistry evaluations on cycle days 21–23 in endometrial stroma, glandular epithelium (GE) and luminal epithelium (LE) (ERα, ERβ, and AR by image analyses, GPER by manual scoring) from overweight/obese PCOS women with no luteal phase (OB-PCOS no luteal phase, n = 12), PCOS women with confirmed luteal phase (OB-PCOS confirmed luteal phase, n = 6), and overweight/obese controls with confirmed luteal phase (OB-C confirmed luteal phase, n = 10). Box-and-whisker plots represent the median and interquartile range (P25–P75). Boxes with different letter designations are significantly different, ie, P < .05.
Correlations
In the OB-PCOS group with confirmed luteal phase, endometrial thickness correlated negatively with AR protein expression in stroma (r = −0.99, P = .01; n = 6).
Discussion
This is, to our knowledge, the first study to investigate endometrial expression of ERs and AR before and after lifestyle intervention in overweight/obese PCOS women. Before intervention, ERα and ERα36 mRNA levels, as well as the ERα/ERβ mRNA ratio, were lower, whereas the GPER/ERα36 mRNA ratio was higher in proliferative endometrium of overweight/obese PCOS women compared to healthy BMI-matched controls. After intervention, GPER mRNA levels decreased in proliferative endometrium of overweight/obese PCOS women. Furthermore, protein levels of ERα and the ERα/ERβ ratio increased and were higher in PCOS women with improved menstrual function than in those without improvement. The subgroup of women with restored ovulation and confirmed luteal phase displayed protein levels of ERs on cycle days 21–23 comparable to controls except for higher immunostaining of GPER in stroma. PCOS women who remained anovulatory had higher protein levels of ERα (and thereby increased ERα/ERβ ratio), GPER, and AR on cycle days 21–23 than controls, whereas protein levels of AR in secretory endometrium of PCOS women with restored ovulation was in between the controls and the anovulatory subgroup.
The functional endometrium of women with PCOS differs from that of control women as revealed by altered receptivity and increased incidence of hyperplasia and cancer (4, 5). However, there is little knowledge regarding coexpression of ER subtypes and AR in the endometrium of women with PCOS.
Endometrial expression on cycle days 6–8 before lifestyle intervention
We found that PCOS was characterized by lower mRNA levels of ERα and ERα36, but comparable ERβ and therefore a lower ERα/ERβ ratio, in proliferative endometrium than in controls. Obesity as such was also associated with a lower ERα/ERβ mRNA ratio compared with normal-weight women. However, in contrast to the case of PCOS, the lower ratio in obesity was due to a higher ERβ level. The lower mRNA levels of ERα and ERα36 in PCOS might be explained by the higher levels of T. In support of this, the levels of free T in the PCOS women correlated negatively with the mRNA levels of ERα and ERα36.
Previous studies by the group of Vega and collaborators, demonstrated higher protein levels of ERα and ERβ in proliferative endometrium of PCOS women compared to controls (11, 12). These results are not in agreement with ours and there may be several explanations to the discrepant findings. In these studies, the biopsies were collected during anovulation of unknown duration. Women with PCOS are anovulatory or exhibit occasional ovulations, which can result in prolonged, progesterone unopposed, estrogenic stimulation of the endometrium (5). Furthermore, different BMI of the PCOS women and the controls may influence the results (11, 12). To obtain comparable conditions, we chose to collect the biopsies on the same cycle days in all groups after spontaneous or induced menstruation and to use BMI-matched controls.
The balance between ERα and ERβ has been found to be of importance for the metabolism in tissues involved in glucose and lipid homeostasis (muscle, adipose tissue) (26). Several studies on knockout animals have revealed that ERs have opposite functions in metabolic regulation; whereas ERα enhances, ERβ reduces glucose uptake showing diabetogenic effects (26). Thus, an imbalance in the ERα/ERβ ratio can affect glucose homeostasis negatively, leading to abnormalities in tissue metabolism and function. We have previously shown that the expression of molecules involved in insulin signaling, including glucose transporter 1, is disturbed in proliferative endometrium of OB-PCOS women (20). In the present study, insulin levels correlated negatively with ERα mRNA levels and the ERα/ERβ ratio in proliferative endometrium of PCOS women, suggesting a possible association between disturbed estrogen receptor function and glucose homeostasis in these women.
Little information is available regarding membrane-bound ERs in the endometrium of PCOS women. Our results showing a lower ERα36 mRNA level in proliferative endometrium is in agreement with a previous publication, in which lower ERα36 mRNA expression in PCOS was found to be associated with endometrial hyperplasia (6). GPER mRNA expression in human endometrium displays a cyclic variation with the lowest levels in the secretory phase (8). There was no significant difference in endometrial mRNA and protein expression of GPER between groups, but endometrial thickness correlated positively with GPER mRNA expression in proliferative endometrium. This finding could be in agreement with previous reports suggesting a role of GPER in endometrial proliferation and cancer invasion (10).
T is known to inhibit the growth of human endometrial cells in vitro (27) and to counteract endometrial proliferation induced by estrogen in vivo (15). This effect of T was proposed to be associated with the interaction between ER and AR pathways (28). In our study, immunostaining of AR in the epithelial cells of proliferative endometrium was higher in PCOS women compared to controls, which is consistent with a previous report (11). Hypothetically, elevated androgen levels together with the increased expression of AR may have an adverse effect on the proliferative endometrium and contribute to poor reproductive outcome in women with PCOS.
Endometrial expression on cycle days 6–8 after lifestyle intervention
Following lifestyle intervention, the change in ERα immunostaining in proliferative endometrium was different between subgroups of OB-PCOS women with improved menstrual function compared to those who showed no improvement. Both ERα immunostaining and the ERα/ERβ protein ratio in stroma were higher in the former group. A positive association between improved menstrual function and the ERα/ERβ protein ratio in proliferative endometrium was further emphasized by correlation analyses. Increased ERα/ERβ protein ratio may therefore be beneficial and indicate improved estrogen action. Expression of ERα36 mRNA was not affected by lifestyle intervention, whereas GPER mRNA expression decreased in proliferative endometrium of obese PCOS women. The latter finding suggests that GPER may play a role in the impaired endometrial function of PCOS women.
Endometrial expression on cycle days 21–23 after lifestyle intervention
One-third of the PCOS women displayed restored ovulation and confirmed luteal phase after lifestyle intervention. In this subgroup of PCOS women, mRNA expression of ERα, and therefore the ERα/ERβ ratio, decreased in secretory endometrium as in the controls. In contrast, the anovulatory PCOS women showed no decrease in endometrial mRNA expression of ERα and ERα/ERβ ratio on cycle days 21—23, and their ERα levels were higher than in controls. This finding is in agreement with a previous study showing a higher ERα mRNA level in midsecretory endometrium of PCOS women compared with controls (29). Moreover, endometrial mRNA levels of GPER were higher on cycle days 21–23 in anovulatory women with PCOS compared with controls. Similarly, GPER immunostaining in stroma was higher in both anovulatory and ovulatory PCOS women on cycle days 21–23 compared to the healthy controls. Thus, increased GPER immunostaining, which was proposed to regulate endometrial growth (8, 9), might play a role in the development of proliferative abnormalities in women with PCOS.
Endometrial protein expression of AR in the anovulatory women was higher in stroma and epithelial cells on cycle days 21–23 than in the controls. These data are in agreement with a previous report where an elevated endometrial AR expression was found in women with PCOS in comparison to controls (16). In the subgroup of PCOS women with confirmed luteal phase, protein levels of AR on cycle days 21–23 were in between those of the controls and the anovulatory PCOS women. Furthermore, there was a negative correlation between AR immunostaining in stroma and endometrial thickness in the subgroup of ovulatory PCOS women, which might suggest an adverse effect on the secretory endometrium, which could be of importance for receptivity and implantation.
The major limitation of the present study is the small number of subjects in each group. The strengths are the homogenous groups of obese and normal-weight PCOS women fulfilling all three criteria of the Rotterdam consensus and of BMI-matched healthy controls as well as the collection of endometrial biopsies on standardized cycle days in all groups.
In conclusion, we have demonstrated that proliferative endometrium in obese PCOS women exhibits lower mRNA levels of ERα, ERα36, and subsequently the ERα/ERβ mRNA ratio, compared to BMI-matched controls. These changes might be explained by increased levels of free T and insulin. Following lifestyle intervention, ERα protein and the ERα/ERβ protein ratio increased and were higher in the group of OB-PCOS women with improved menstrual function as compared to those who showed no improvement. We propose that this change implies enhanced ER action and thereby improved endometrial function in women with PCOS. Restored ovulation and confirmed luteal phase following lifestyle intervention in PCOS women resulted in mRNA and protein levels of ERs in the secretory endometrium comparable to controls, besides protein expression of GPER that was significantly higher. It is possible that proliferative abnormalities that are present in the endometrium of PCOS women can be due to GPER. In addition, we found that AR immunostaining in PCOS women with restored ovulation was comparable to the controls. However, the negative correlation between AR and endometrial thickness may indicate that androgens have a role in endometrial dysfunction and poor reproductive outcome in women with PCOS.
Acknowledgments
We thank Lotta Blomberg, Siv Rödin Andersson, Berit Legerstam at the Women's Clinical Health Research Unit and to Britt Masironi at the Department of Women's and Children's Health for skillful technical assistance. Elisabeth Berg, at the Department of Learning, Informatics, Management and Ethics, is acknowledged for expert help with statistical analysis.
This study was supported financially by the Swedish Research Council (ALH 20324), Karolinska Institutet, and the regional agreement on medical training and clinical research (to A.L.F.) between Stockholm County Council and Karolinska Institutet (to A.L.H. and L.S.).
Disclosure Summary: The authors have no conflicts of interest.
Abbreviations
- AR
androgen receptor
- BMI
body mass index
- E
energy
- ER
estrogen receptor
- GPER
G-protein–coupled estrogen receptor-1
- NW-C
healthy normal-weight women with BMI lower than 25
- NW-PCOS
PCOS and BMI lower than 25
- OB-C
healthy overweight/obese women with a BMI greater than 27
- OB-PCOS
PCOS women with a BMI greater than 27
- PCOS
polycystic ovary syndrome
- SHBG
sex hormone–binding globulin.
