


The association of hyperglycemia and diabetic retinopathy (DR) in established type 2 diabetes mellitus (T2DM) subjects is well accepted. However, the association between β-cell responsiveness and insulin sensitivity leading to fasting and postprandial hyperglycemia with DR in newly diagnosed treatment-naïve T2DM subjects remain unreported.
A total of 544 newly diagnosed treatment-naïve T2DM subjects were screened for DR (digital photography) and underwent a standardized meal tolerance test. Serial plasma glucose and insulin levels were measured, and fasting (M0) and postprandial β-cell responsiveness calculated Calculating Pancreatic Response Program along with homeostasis model assessment-β cell function (HOMA-B) and HOMA-Insulin Sensitivity. A subgroup of 201 subjects also underwent a frequently sampled IV glucose tolerance test and the acute insulin response to glucose, insulin sensitivity, and glucose effectiveness (SG) estimated (MINMOD model).
A total of 16.5% (90) subjects had DR at diagnosis. Subjects with DR had significantly reduced M0, HOMA-B and SG leading to higher fasting and postprandial (2 hour) glucose and significantly lower fasting and postprandial (2 hour) insulin. Factors independently associated with DR in multivariate logistic regression analysis were M0, HOMA-B, and SG with fasting and postprandial (2 hour) glucose and insulin. There was no statistical difference in glycated hemoglobin, systolic blood pressure, acute insulin response to glucose, and insulin sensitivity between those with or without DR.
In this cohort of newly diagnosed T2DM subjects, DR is associated with reduced β-cell responsiveness, resulting from β-cell failure rather than insulin resistance, leading to fasting and postprandial hyperglycemia and hypoinsulinemia.
Diabetes mellitus (DM) is a worldwide epidemic, and recent estimates (1) indicate that the number of people living with DM is expected to rise from 366 million in 2011 to 552 million by 2030, with 90% having type 2 DM (T2DM). A recent analysis reported that of individuals with DM there are approximately 93 million people (approximately 35%) with diabetic retinopathy (DR), and 28 million with vision-threatening DR (approximately 10%) worldwide (2). In the United Kingdom, DR remains a leading cause of blindness in the working age population (3); thus, early detection and treatment of modifiable risk factors known to influence its onset and progression is imperative. After 20 years of known DM duration, approximately 40–60% of subjects with T2DM have some DR, with 10% of all T2DM subjects having developed sight-threatening lesions related to proliferative DR and/or exudative maculopathy (4).
Various risk factors have been associated with the development and progression of DR including hyperglycemia (5), duration of DM (5), hypertension, and dyslipidemia (6–8). The UK Prospective Diabetes Study (UKPDS) and Diabetes Control and Complications Trial (DCCT), along with their 10-year follow-up, have demonstrated the benefits of early and sustained improvement in glycemic control with respect to DR (9) (10). The early history of glycemic exposure leading to the legacy effect described in the UKPDS and the metabolic memory described in the DCCT is a very important component in the development of DR (9) (10). Furthermore, the UKPDS had shown that for every 1% decrease in glycated hemoglobin (HbA1c), there was a 37% risk reduction in microvascular complications in T2DM, predominantly DR (11). Recently, the Accord Eye Study Group has shown that intensive glucose and lipid lowering, but not intensive blood pressure control, reduce the rate of progression of DR (12).
Further analysis of the DCCT study (13), however, reported that the total glycemic exposure (HbA1c and duration of diabetes) was able to explain 11% of the variation in retinopathy risk in the complete cohort, but other factors (eg, environmental, genetic, glycemic variation, other measures of glycemia) could explain the remaining variation in risk on their own or through an intercorrelation with HbA1c.
Investigating the possible association between hyperglycemia and the presence of DR has over the years involved measurement of various metabolic indices, predominantly HbA1c and/or fasting plasma glucose (11, 14). In 2005, Shiraiwa et al showed that postprandial hyperglycemia and postprandial hypoinsulinemia were possible predictors for incident DR in Japanese T2DM subjects who were not on insulin treatment (15). The Diabetes Prevention Program (DPP), having studied subjects with impaired glucose tolerance and recent onset T2DM, found a higher baseline systolic blood pressure (SBP) and HbA1c among those with retinopathy, but found no difference in insulin secretion as estimated by the Corrected Insulin Response (16). In contrast, a community-based study in Taiwan demonstrated that both β-cell dysfunction and insulin resistance (both measured by the homeostasis model assessment [HOMA] methodology) were associated with DR in established T2DM patients (17). Similarly, over the past decade, there have been other reports associating insulin resistance with DR (18–20). However, the relationship between β-cell function, glucose effectiveness (SG), and insulin sensitivity (SI) contributing to the level of fasting and postprandial dysglycemia, with the presence of DR in newly diagnosed subjects with T2DM remaining unreported.
The aim of this study was to examine the association between β-cell function and SI contributing to various fasting and postprandial glycemic indices and the presence of DR in newly diagnosed and treatment-naïve T2DM patients.
Materials and Methods
Subjects
A total of 544 newly diagnosed Caucasian subjects with T2DM were recruited into the study within 1–2 weeks after diagnosis of DM before any treatment between 1981 and 2007. The subjects were referred by primary care on clinical presentation and were diagnosed by either fasting glucose or oral glucose tolerance test according to World Health Organization criteria (21). No formal dietetic or lifestyle advice or antidiabetic medication was given before study enrollment.
Ethical approval was obtained from South Glamorgan/Bro Taf Local Research Ethics Committee, and all subjects gave informed consent.
Metabolic tests
All subjects were admitted at approximately 8 am to an Investigation Unit following a 12-hour overnight fast and remained on bed rest throughout the morning of each of the study days.
Basic demographic data (ie, age, sex, height, weight, and resting supine BP) were recorded and body mass index (BMI) calculated. HbA1c and total cholesterol were measured. All subjects (n = 544; group A) underwent a standardized meal tolerance test (MTT). This involved consuming a 500-kcal meal over a 10-minute period (58% carbohydrate, 23% fat, and 19% protein) commencing at time 0 minutes (22). Blood samples were taken from −30 to 240 minutes at 30-minute intervals, to determine plasma glucose, insulin, and C-peptide concentrations.
From 1991 onwards, a subgroup of 201 subjects (group B) additionally underwent a frequently sampled IV GTT (FSIVGTT), following a second sequential overnight fast.
The FSIVGTT consisted of baseline blood samples taken at −30, −15, and 0 minutes followed by a bolus of glucose (0.3 g/kg body weight) given IV at 0 minutes over a 2-minute period. Thereafter, blood samples were taken at 1-minute intervals over 10 minutes. Following the IV bolus of insulin (Actrapid; Novo Nordisk) at a dose of 0.05 U/kg insulin given at 20 minutes (22), blood samples were taken at frequent intervals up to 180 minutes. At each time point, measurements of plasma glucose and insulin were made.
For both the procedures (MTT and FSIVGTT), an indwelling IV cannula was inserted into an antecubital fossa vein and connected via a three-way tap to a slow-running saline infusion, to maintain the patency of the canula allowing for repeated blood sampling. The technique was regularly checked to avoid any dilutional effect of the saline infusion.
Retinal photography
Retinal images were obtained (Canon CR6-45NM) non-mydriatic retinal camera) through dilated pupils. Two 45° images were taken, one centered on the macula and one nasal field per eye. Classification of DR was based on the Diabetic Retinopathy Screening Service for Wales grading protocol, which is an enriched version of the UK National DR grading protocol (23). The highest grade for both eyes used for classification. All grading was carried out by a senior grader from the Diabetic Retinopathy Screening Service for Wales and a diabetologist trained to grade fundus photographs with the Diabetic Retinopathy Screening Service for Wales grading protocol and any differences were reconciled by reference to a second diabetologist who was also trained to grade fundus photographs.
Assay methods
During the metabolic tests, blood was withdrawn and placed into tubes containing different anticoagulants; fluoride/oxalate for glucose and lithium-heparin for measurement of C-peptide and specific insulin. Within approximately 10 minutes from collection, the blood tubes were spun in a refrigerated centrifuge for 5 minutes at approximately 3000 rpm, and the plasma aliquoted into labeled tubes and stored frozen at −20 C until assay.
Glucose was measured by a glucose oxidase assay (YSI 2300, YSI) and C-peptide and specific insulin by immunoassay (24). The within- and between-assay coefficients of variation were 1.8% and 1.9%, 5.4% and 8.8%, and 4.1% and 8.8%, respectively, for the glucose, C-peptide, and insulin assays.
HbA1c measurements were performed in a routine hematology department. HbA1c measurements were determined using a high-performance liquid chromatography (HPLC) assay (TOSOH HLC-723 G7; Tosoh Corporation) (25), which was DCCT-aligned and the laboratory participated in an external quality assessment scheme. The general assay performance for the HPLC method used had a reported coefficient of variation within and between assay of less than 2.0% (25). HbA1 (total glycated hemoglobin) measured in the early part of the study by column chromatography was converted to HbA1c using the formula (HbA1c = 0.83 HbA1 − 0.54) (26).
Data analysis
Glucose and insulin levels.
Fasting plasma glucose (FPG) and fasting plasma insulin were measured. The postprandial plasma glucose (PPG) and plasma insulin were represented by the 120-minute values and the areas under the curve AUC(0–240 min) for plasma glucose and insulin over the 4-hour MTT period were calculated.
Calculating Pancreatic Response program.
The Calculating Pancreatic Response (CPR) program was used to quantify pancreatic β-cell responsiveness during the MTT. M0 (C-peptide response to fasting glucose) representing fasting prehepatic insulin secretion and M1 (C-peptide response to postprandial glucose) representing the increase in prehepatic insulin secretion in response to an increment in postprandial glucose were calculated (27).
Minimal model analysis.
The minimal model analysis of FSIVGTT provided data on SI and SG (28, 29). The acute insulin response to glucose (AIRG) was the incremental area AUC from 0 to 10 minutes during the FSIVGTT (30). The Disposition Index (DI), representing the composite measure of insulin sensitivity and pancreatic β-cell responsiveness, was calculated as DI = SI × AIRG (30).
HOMA calculation.
HOMA-β cell, HOMA-Insulin Sensitivity, and HOMA-insulin resistance were calculated using fasting plasma glucose and specific insulin levels using HOMA, version 2.2.2 (31), using fasting concentrations before the MTT.
Retinopathy classification.
Details of the method of retinal examination and classification of DR (23) have previously been described. For the purpose of this study, subjects were divided into two groups based on the absence (NDR) or presence of any DR, which included background DR (BDR), preproliferative DR (PPDR), proliferative DR (PDR), possible maculopathy, and exudative maculopathy.
Statistical analysis
Descriptive analyses was conducted with independent sample t test and Mann-Whitney U test for continuous variables and the χ2 test for categorical variables. Normally distributed variables were presented as the mean (± SD) and nonnormally distributed variables expressed as median (interquartile range).
The designated putative risk factors were assessed using logistic regression methods with nonnormally distributed variables (FPG, fasting plasma insulin, PPG, postprandial plasma insulin, AUCGlucose(0–240 min), AUCInsulin(0–240 min), HOMA β-cell function (HOMA-B), M0, M1, and Sg) log transformed. A noncorrelated subset of clinical and metabolic variables was determined based on statistical and clinical relevance. All multivariate analyses were adjusted for age, gender, BMI, and risk factors such as systolic BP and total cholesterol, which have previously been reported to have an association (6–8) with DR with the final model additionally including parameters of β-cell responsiveness/β-cell function and glycemia. All analyses were conducted using SPSS 20 with P < .05 taken as statistical significance (two-tailed).
Results
Of the 544 subjects (group A; 393 males and 151 females, 2.6:1) with a mean age of 54 (SD ± 10) years, 83.5% (454) had no evidence of DR and 16.5% (90) had evidence of DR at presentation. Of those with DR, the majority 84.4% (76) had lesions of BDR (including possible maculopathy) and 15.6% (14) had PPDR; none had either exudative maculopathy or PDR. In the subgroup of 201 subjects (group B) undergoing FSIVGTT in addition to MTT, 85% (171) subjects had no evidence of DR at presentation, whereas 15% (30) had DR, including 12.5% (25) with BDR and 2.5% (5) PPDR; none had either exudative maculopathy or PDR.
Baseline characteristics including age, weight, BMI, systolic and diastolic BP, total cholesterol, and HbA1c of the patients with DR and NDR in groups A and B are detailed in Table 1. At baseline, group A subjects with DR had significantly lower body weight at diagnosis of DM (P = .02) compared with those without DR. BMI was also lower in group A and HbA1c was higher, although both failed to reach statistical significance. There was no significant difference for the remaining baseline characteristics measured between those with or without DR. In group B, weight and BMI were lower in those with DR compared to those without DR; however, this was not significant.
Baseline Characteristics in Subjects With NDR Compared to Those With DR at Diagnosis of T2DM
| All Subjects | NDR | DR | P Value | |
|---|---|---|---|---|
| Group A | ||||
| Number | 544 | 454 | 90 | |
| Age at presentation (years) | 54 (10) | 54 (10) | 56 (11) | .28 |
| Male sex (%) | 393 (72) | 324 (71) | 69 (77) | .31 |
| Weight (kg) | 88 (17) | 88 (17) | 85 (19) | .02 |
| BMI (kg/m2) | 30.2 (5.0) | 30.4 (5.3) | 29.6 (5.8) | .06 |
| Systolic BP (mmHg) | 137 (19) | 137 (20) | 139 (18) | .25 |
| Diastolic BP (mmHg) | 83 (11) | 83 (11) | 83 (11) | .71 |
| Total cholesterol (mmol/liter) | 5.4 (1.2) | 5.5 (1.2) | 5.2 (1.2) | .08 |
| HbA1c (%) [mmol/mol] | 7.7 (2.0) [61] (22) | 7.7 (2.0) [61] (22) | 8.0 (1.8) [64] (20) | .06 |
| Group B | ||||
| Number | 201 | 171 | 30 | |
| Age at presentation (years) | 55 (10) | 55 (10) | 55 (11) | .79 |
| Male sex | 145 (72) | 125 (73) | 20 (67) | .47 |
| Weight (kg) | 90 (17) | 91 (16.7) | 86 (16.5) | .16 |
| BMI (kg/m2) | 31.2 (5.5) | 31.3 (5.6) | 30.6 (4.8) | .54 |
| Systolic BP (mmHg) | 135 (19) | 135 (18) | 134 (19) | .68 |
| Diastolic BP (mmHg) | 81 (10) | 81 (10) | 81 (10) | .95 |
| Total cholesterol (mmol/liter) | 5.4 (1.1) | 5.4 (1.2) | 5.4 (1.0) | .77 |
| HbA1c (%) [mmol/mol] | 7.6 (1.9) [61] (21) | 7.6 (2.0) [61] (22) | 7.7 (1.5) [61] (17) | .80 |
Data expressed as mean (±sd); sex: number (%).Group A, 544 subjects underwent MTT; group B, 201 subjects underwent FSIVGTT.
The metabolic variables measured during the MTT for group A subjects with either DR or no DR are detailed in Table 2. Those with DR had a lower estimated β-cell responsiveness: M0 (P = .014) and β-cell function (HOMA-B) (P = .044), associated with higher fasting glucose (P = .021) and lower fasting insulin concentrations (P = .036). In the postprandial state, individuals presenting with DR had higher postprandial (2 hour) glucose (P = .023) and lower postprandial insulin levels (P = .001). Those with DR had numerically lower but nonsignificant (P = .065) postprandial β-cell responsiveness: M1 (13.5 [7.9–23.8] vs 16.9 [9.1–30.0] × 10−9 pmol/kg/min).
Comparison of the Metabolic Variables During the MTT in Subjects With NDR and Those With DR at Diagnosis of T2DM
| Group A | NDR (n = 454) | DR (n = 90) | P Value |
|---|---|---|---|
| Fasting glucose (mmol/liter) | 9.6 (7.6–12.7) | 10.6 (8.5–13.8) | .021 |
| PPG (mmol/liter) (120 min) | 13.4 (9.8–17.3) | 15.1 (11.1–18.1) | .023 |
| AUCGlucose (0–240 min) (mmol/liter) | 11.8 (9.0–15.4) | 13.6 (9.8–16.3) | .023 |
| Fasting insulin (pmol/liter) | 61.8 (34.0–99.0) | 50.5 (33.9–86.36) | .036 |
| Postprandial insulin (pmol/liter) (120 min) | 278.5 (162.0–459.3) | 189.0 (108.3–335.5) | .001 |
| AUCInsulin (0–240 min) (pmol/liter) | 199.2 (117.7–317.2) | 130.5 (83.8–225.7) | <.001 |
| M0 (*10−9 pmol/kg/min) | 5.3 (3.1–7.8) | 3.7 (2.6–7.3) | .014 |
| M1 (*10−9 pmol/kg/min) | 16.9 (9.1–30.0) | 13.5 (7.9–23.8) | .065 |
| HOMA-B (%) | 34.9 (19.1–60.3) | 26.1 (14.7–48.2) | .044 |
| HOMA-S (%) | 59.7 (37.7–105.5) | 78.7 (45.2–108.6) | .094 |
| HOMA-IR | 1.7 (0.9–2.7) | 1.3 (0.9–2.2) | .094 |
Data expressed as median (first to third interquartile range).
Over the 4-hour MTT study period, subjects with DR had significantly higher AUCGlucose(0–240 min) (P = .023) and lower AUCInsulin(0–240 minutes) (P = .001) in comparison to those without DR (Table 2). The glucose and insulin profiles and indices of β-cell responsiveness (M0 and M1) during the MTT in subjects with DR and without DR are illustrated in Figure 1, A and B.
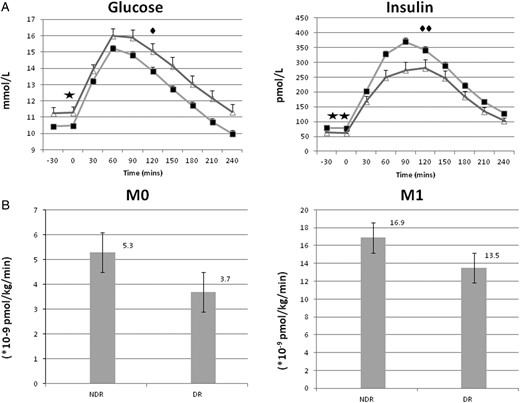
Glucose and insulin profiles with β-cell responsiveness in patients with and without diabetic retinopathy. (A) Plasma glucose and insulin profile (mean ± SEM) during MTT in subjects with NDR (filled square) (n = 454) and those with DR (open triangle) (n = 90) at diagnosis of T2DM. Significant difference between NDR and DR: (filled star)fasting glucose (P = .021), (filled diamond) postprandial glucose (P = .023), (two filled stars) fasting insulin (P = .036), and (two filled diamonds) postprandial insulin (P = .001). (B) Fasting (M0) and postprandial (M1) β-cell responsiveness during MTT in subjects with NDR and those with DR at diagnosis of T2DM.
The baseline characteristics and the metabolic responses in group B subjects with either NDR or DR who underwent FSIVGTT are detailed in Table 3. SI was not significantly different between the two groups; however, SG was significantly reduced in those with DR compared to those without DR (P = .012). There was no difference in the AIRG and DI between those with or without DR.
Comparison of Metabolic Variables Following Frequently Sampled IV GTT in Subjects With NDR and Those With DR at Diagnosis
| Group B | NDR (n = 171) | DR (n = 30) | P Value |
|---|---|---|---|
| SI × 10−4 [(microU/ml)−1 · min−1] | 0.8 (0.4–1.4) | 0.9 (0.6–1.3) | .610 |
| SG × 10−2 (min−1) | 1.4 (1.2–1.7) | 1.2 (0.8–1.6) | .012 |
| AIRG (0–10 min) (microU/ml/min) | 111.4 (65.4–177.7) | 94.8 (62.2–191.0) | .703 |
| DI × 10−2 | 0.89 (0.39–1.53) | 0.82 (0.51–1.70) | .744 |
Data expressed as median (first to third inter quartile range).
In univariate logistic regression analysis postprandial glucose, AUCGlucose (0–240 min), postprandial insulin, AUCInsulin (0–240 min), M0, HOMA-B, and SG were significantly associated with the presence of DR (Table 4).
Univariate and Multivariate Logistic Regression Depicting Variables Independently Associated With the Presence of DR
| Number | Crude OR (95% CI) | P (<.05) | Adjusted OR (95% CI) (for Age and Sex) | P (<.05) | OR (95% CI) (Fully Adjusted)a | P (<.05) | |
|---|---|---|---|---|---|---|---|
| HbA1c (%) | 506 | 2.329 (0.931–5.823) | .071 | 2.515 (0.997–6.346) | .051 | 2.296 (0.900–5.859) | .082 |
| Fasting glucose (mmol/liter) | 544 | 2.078 (0.982–4.400) | .056 | 2.238 (1.051–4.765) | .037 | 2.230 (1.038–4.791) | .040 |
| PPG (mmol/liter) (120 min) | 543 | 1.944 (1.004–3.763) | .049 | 2.054 (1.058–3.987) | .033 | 2.093 (1.063–4.123) | .033 |
| AUCGlucose (0–240 min) (mmol/liter) | 544 | 2.081 (1.021–4.242) | .044 | 2.196 (1.075–4.487) | .031 | 2.252 (1.087–4.664) | .029 |
| Fasting insulin (pmol/liter) | 494 | 0.782 (0.607–1.007) | .057 | 0.784 (0.607–1.012) | .061 | 0.759 (0.585–0.986) | .039 |
| Postprandial insulin (pmol/liter) (120 min) | 534 | 0.681 (0.526–0.882) | .004 | 0.686 (0.529–0.890) | .005 | 0.664 (0.511–0.863) | .002 |
| AUCInsulin (0–240 min) (pmol/liter) | 534 | 0.625 (0.465–0.840) | .002 | 0.631 (0.468–0.850) | .002 | 0.612 (0.453–0.828) | .001 |
| M0 (*10−9 pmol/kg/min) | 540 | 0.693 (0.514–0.934) | .016 | 0.697 (0.517–0.940) | .018 | 0.658 (0.484–0.894) | .007 |
| HOMA-B (%) | 494 | 0.750 (0.582–0.968) | .027 | 0.745 (0.577–0.963) | .025 | 0.739 (0.570–0.958) | .022 |
| SG × 10−2 (min−1) | 201 | 0.206 (0.069–0.618) | .005 | 0.211 (0.070–0.642) | .006 | 0.200 (0.066–0.602) | .004 |
For age, sex, BMI, SBP, total cholesterol.
Factors associated with DR in multivariate logistic regression analyses are detailed in (Table 4). Measures of β-cell function M0 (odds ratio [OR], 0.66; 95% confidence interval [CI], 0.484–0.894; P = .007) and HOMA-B (OR, 0.74; 95% CI 0.570–0.958; P = .022) were associated with DR along with SG (OR, 0.20; 95% CI, 0.066–0.602; P = .004).
The association of fasting glucose (OR, 2.23; 95% CI, 1.038–4.791; P = .04), postprandial glucose (OR, 2.09; 95% CI 1.063–4.123; P = .033), AUCGlucose (0–240 min) (OR, 2.25; 95% CI, 1.087–4.664; P = .029), fasting insulin (OR, 0.76; 95% CI, 0.585–0.986; P = .039), postprandial insulin (OR, 0.66; 95% CI, 0.511–0.863; P = .002), and AUCInsulin (0–240 min) (OR, 0.61; 95% CI 0.453–0.828; P = .001) with the presence of DR at diagnosis of type 2 diabetes shows the contribution of fasting, postprandial and overall hyperglycemic/insulinopenic exposure that leads to the development of DR. However, in this group of subjects, we failed to demonstrate significant association of HbA1c (OR, 2.3; 95% CI, 0.900–5.859; P = .082) with DR, when adjusted for the mentioned variables (age, gender, BMI, systolic BP, and total cholesterol) though the HbA1c was higher in subjects with DR. Each 1-mmol/L increase in fasting and postprandial glucose was associated with a 2-fold increase the risk of DR. Also each 1-pmol/L decrease in fasting and postprandial insulin was associated with increased risk of DR by 24% and 34%, respectively.
In the multivariate logistic regression models once adjusted for glycaemia (using either HbA1c, FPG, or PPG) in addition to those mentioned above (age, gender, BMI, systolic BP, and total cholesterol), β-cell responsiveness or β-cell function were the most significant risk factors for the presence of DR at diagnosis of diabetes. (Table 5).
Univariate and Multivariate Logistic Regression Depicting Variables Independently Associated With the Presence of DR
| Number | Crude OR (95% CI) | P (<.05) | Adjusted OR (95% CI) (Fully Adjusted)a | P (<.05) | Adjusted OR (95% CI) | P (<.05) | |
|---|---|---|---|---|---|---|---|
| (A) | (adjusted fora and HbA1cb) | ||||||
| M0 (*10−9 pmol/kg/min) | 540 | 0.693 (0.514–0.934) | .016 | 0.658 (0.484–0.894) | .007 | 0.647 (0.47 – 0.891) | .008 |
| HOMA-B (%) | 494 | 0.750 (0.582–0.968) | .027 | 0.739 (0.570–0.958) | .022 | 0.719 (0.550– 0.940) | .016 |
| (B) | (adjusted for a and FPGc) | ||||||
| M0 (*10−9 pmol/kg/min) | 540 | 0.693 (0.514–0.934) | 0.016 | 0.658 (0.484–0.894) | .007 | 0.655 (0.482 – 0.891) | .007 |
| HOMA-B (%) | 494 | 0.750 (0.582–0.968) | .027 | 0.739 (0.570–0.958) | .022 | 0.739 (0.570– 0.958) | .022 |
| (C) | (adjusted fora and PPGd) | ||||||
| M0 (*10−9 pmol/kg/min) | 540 | 0.693 (0.514–0.934) | .016 | 0.658 (0.484–0.894) | .007 | 0.655 (0.482–0.891) | .007 |
| HOMA-B (%) | 494 | 0.750 (0.582–0.968) | .027 | 0.739 (0.570–0.958) | .022 | 0.739 (0.570– 0.958) | .022 |
For age, sex, BMI, SBP, and total cholesterol.
For age, sex, BMI, SBP, total cholesterol and HbA1c.
For age, sex, BMI, SBP, total cholesterol, and FPG.
For age, sex, BMI, SBP, total cholesterol, and PPG.
Discussion
Our findings have shown that the presence of DR is associated with a reduced fasting β-cell responsiveness and function. This has resulted in hyperglycemia in both the fasting and postprandial state, concurrent with fasting and postprandial insulinopenia. In addition, the insulin-independent component of glucose tolerance was reduced and independently associated with the presence of DR at diagnosis.
In this study, while employing both the CPR program (27) and the HOMA methodologies, we have established an independent association of M0 and HOMA-B with the presence of DR by measuring β-cell function in response to a standardized meal challenge. This relationship of DR with β-cell function (HOMA-B) has previously been analyzed in a community-based study in Taiwan by Tung et al (17), involving patients with T2DM of varying duration, who were treated with lifestyle modifications and/or oral hypoglycemic agents. They observed that those subjects with better preserved β-cell function were less likely to have DR. The UKPDS has reported that the severity of retinopathy at diagnosis of T2DM was related in both sexes to higher fasting plasma glucose levels, higher systolic and diastolic BP, lower serum insulin levels, and reduced β-cell function (32). The association between fasting β-cell dysfunction and DR in established T2DM patients as reported by Tung et al (17) is also present in our newly diagnosed, treatment-naïve, T2DM subjects. This contrasts with the DPP study involving newly diagnosed T2DM subjects, where no difference in insulin secretion estimated by the Corrected Insulin Response was found (16).
We have also shown an independent association for the presence of DR with both fasting and postprandial hyperglycemic and insulinopenic responses to the MTT as well as to the 4-hour—AUC(0–240 min)—response to the meal. Thus, our study shows both fasting and postprandial glycemic exposure exhibit an independent association with DR. Though HbA1c was higher in the subjects with DR the difference failed to reach significance. In 2005, Shiraiwa et al studied Japanese T2DM subjects known to have DM but not on insulin treatment (15) and established postprandial hyperglycemia but not HbA1c to independently correlate with the presence of DR (15) and stated postprandial hyperglycemia as a possible predictor for incident DR in their subjects. Contrary to our findings, two recent studies from the United Kingdom identified an independent association for the presence of DR with HbA1c and systolic BP in newly diagnosed T2DM within the first year of their diagnosis (33, 34). The DPP study involving newly diagnosed T2DM subjects has also reported a higher HbA1c among those with DR (16).
SG represents the capacity of glucose, per se, to enhance glucose cellular uptake and to suppress endogenous glucose production and has been reported to be an important determinant of glucose metabolism (35). The glucose transporter protein GLUT-1 is widely distributed on the plasma membrane of various body tissues, contributing an important role in insulin-independent glucose uptake (36, 37). Thus, in the presence of significant β-cell dysfunction and resultant insulinopenia, a relatively poor SG will further worsen glycaemia. This might explain our findings, where the newly diagnosed T2DM subjects with worse SG are more likely to present with DR.
Our study therefore demonstrates the significant contributions of β-cell dysfunction, fasting and postprandial hyperglycemia/insulinopenia, and reduced glucose effectiveness. Thus it adds to the evidence base of cocontributory factors toward development of diabetic complications. Several epidemiological studies have confirmed the association between hyperglycemia and the development of late diabetic complications (9, 38). Most of the previous studies have employed the time-averaged mean levels of glycaemia measurement of HbA1c as a measure for glycemic status. Over the past decade, there has been increasing recognition that HbA1c is not a complete expression of the degree of hyperglycemia and that other components of dysglycemia contribute to the increased risk of diabetic complications; HbA1c was reported to account for 11% of the risk of retinopathy in the DCCT (13). Recent research has also suggested that postprandial glucose levels and glucose variability may confer additional risk for the development of micro- and macrovascular diabetic complications (39, 40).
In our study, we measured insulin sensitivity both by the MINMOD program (following FSIVGTT) and HOMA (following MTT) and found no difference between T2DM subjects presenting with DR compared to those without DR at the time of diagnosis. Our study cohort differs from previous reports because it comprised only newly diagnosed, treatment-naïve participants with T2DM, and thus lacked the confounding effects of therapeutic interventions. By contrast, other cross-sectional studies have associated insulin sensitivity (assessed by euglycemic clamp) with the presence or severity of DR (18–20). The numbers of subjects and controls in those studies were modest and the subjects recruited had established T2DM that was being treated with variety of hypoglycemic agents, both oral and insulin. It is therefore unclear whether the association that they found was entirely independent of the underlying confounders such as duration and treatment modalities of DM. Thus in our subjects presenting with DR there is no significant contribution from diminished SI/resistance at time of clinical diagnosis.
The DPP reported that more than 12% of subjects with T2DM had DR within approximately 3 years of diagnosis (16). A total of 16.5% of our subjects with newly diagnosed T2DM, who presented with DR were studied within 1–2 weeks of diagnosis, possibly indicating a slightly longer preclinical period in our cohort. Although our study is limited by its cross-sectional design, which makes it difficult to confirm a cause-and-effect relationship, the strength of our study lies in the recruitment of subjects at clinical diagnosis. Thus, we were able to rule out confounding factors such as known duration of DM and treatment modalities; however, we do acknowledge that duration before clinical diagnosis may have been substantial.
An independent association for the presence of DR with HbA1c in subjects with newly diagnosed T2DM within the first year of their diagnosis (16, 33, 34) is well recognized. However, our study fails to show this association with chronic glycemia as represented by HbA1c. A limitation of our study was that over its duration, because of developments in the measurement of HbA1c, we employed two different assays, which may account for this difference. However, our study provides a detailed analysis of the metabolic and hormonal responses to different carbohydrate challenges in our population of T2DM subjects.
In summary, our findings demonstrate an association between the presence of diabetic retinopathy and a diminished functional β-cell status (reduced β-cell responsiveness), leading to both fasting and postprandial hyperglycemia and relative hypoinsulinemia. There was a reduced insulin-independent glucose clearance in those with diabetic retinopathy, but no association with measures of insulin sensitivity/resistance in this population with newly diagnose treatment-naive T2DM.
Acknowledgments
The authors thank all the specialist nurses attached to the Diabetes Investigation Unit over the study period who provided invaluable support in conducting the experiments and sample collections and Prof Susan Wong for her ongoing guidance and support.
Author contributions: S.R.C. and D.R.O. had full access to all of the data in this study and take responsibility for the integrity of the data and the accuracy of the data analysis. All authors contributed to the writing of this report. S.R.C. processed, analyzed, and interpreted the data. D.R.O. and S.D.L. contributed to the conception, study design, and interpretation of the data. S.D.L. and G.J.D. performed the laboratory analysis. R.L.T., G.J.D., and R.P. contributed to processing and interpreting the data. R.V.N. and D.A.R. provided expert advice. All authors approved the final version of this manuscript.
Disclosure Summary: D.R.O. has received honoraria for participation in advisory boards and/or lectures for Sanofi, NovoNordisk, Boehringer Ingelheim, Eli Lilly. and Roche Diagnostics. The other authors have nothing to disclose.
Abbreviations
- AIRG
acute insulin response to glucose
- AUC
area under the curve
- BDR
background diabetic retinopathy
- BMI
body mass index
- BP
blood pressure
- CI
confidence interval
- CPR
Calculating Pancreatic Response
- DCCT
Diabetes Control and Complications Trial
- DI
Disposition Index
- DM
diabetes mellitus
- DPP
Diabetes Prevention Program
- DR
diabetic retinopathy
- FPG
fasting plasma glucose
- FSIVGTT
frequently sampled IV GTT
- GTT
glucose tolerance test
- HbA1c
glycated hemoglobin
- HOMA
homeostasis model assessment
- HPLC
high-performance liquid chromatography
- M0
fasting
- M1
postprandial
- MTT
meal tolerance test
- NDR
no diabetic retinopathy
- OR
odds ratio
- PDR
proliferative diabetic retinopathy
- PPDR
preproliferative diabetic retinopathy
- PPG
postprandial plasma glucose
- SBP
systolic blood pressure
- SG
glucose effectiveness
- SI
insulin sensitivity
- T2DM
type 2 diabetes mellitus
- UKPDS
UK Prospective Diabetes Study.
