


Patients with hypopituitarism of various etiologies have excess mortality. The mortality in patients with nonfunctioning pituitary adenoma (NFPA), regardless of pituitary function, is less well studied.
Our aim was to investigate mortality in patients with NFPA and to examine whether age at diagnosis, gender, tumor treatments, or hormonal deficiencies influence the outcome.
NFPA patients were identified and followed up in nationwide health registries in Sweden, 1987–2011. The criteria for identification were tested and validated in a subpopulation of the patients.
This was a nationwide, population-based study.
A total of 2795 unique patients with NFPA (1502 men, 1293 women) were identified and included in the study. Mean age at diagnosis was 58 years (men, 60 y; women, 56 y) and mean follow-up time was 7 years (range 0–25 y).
There were no interventions.
Standardized mortality ratios (SMRs) and annual incidence rates were calculated using the Swedish population as reference and presented with 95% confidence intervals.
Annual incidence of NFPA was 20.3 (18.8–21.9) cases per 1 million inhabitants. During the observation period, 473 patients died against an expected 431, resulting in an SMR of 1.10 (1.00–1.20). Patients diagnosed at younger than 40 years of age had an increased SMR of 2.68 (1.23–5.09). The SMR for patients with hypopituitarism (n = 1500) was 1.06 (0.94–1.19), and for patients with diabetes insipidus (n = 145), it was 1.71 (1.07–2.58). The SMR was increased in women with NFPA (1.29; 1.11–1.48) but not in men (1.00; 0.88–1.12). Women, but not men, with a diagnosis of hypopituitarism and/or diabetes insipidus also had an increased mortality ratio. SMRs due to cerebrovascular (1.73; 1.34–2.19) and infectious diseases (2.08; 1.17–3.44) were increased, whereas the SMR for malignant tumors was decreased (0.76; 0.61–0.94).
This nationwide study of patients with NFPA showed an overall excess mortality in women and in patients with a young age at diagnosis. Increased mortality was seen for cerebrovascular and infectious diseases.
Nonfunctioning pituitary adenomas (NFPAs) are histologically benign tumors, derived from cells in the anterior pituitary (1). The tumor's mass or its treatment may lead to hypopituitarism that has been shown to be associated with excess mortality (2–4). NFPAs constitute approximately 30% of all pituitary adenomas (5–7). NFPA has a reported incidence of 10–11 per million and a prevalence of 70–140 per 1 million inhabitants (7–10).
Excess mortality has been demonstrated in adult patients with hypopituitarism of various etiologies, including NFPA (2, 3, 11). In one study standardized mortality ratio (SMR) was 1.70 [95% confidence interval (CI) 1.34–2.15] based on a subgroup analysis of 573 patients with NFPA and hypopituitarism (3). An excess mortality was also reported in patients with pituitary adenoma, including prolactinomas, in Sweden, diagnosed between 1958 and 1991 (8). In contrast, a Danish study, in which 160 NFPA patients were studied between 1985 and 2005, found no increase in the overall mortality (12).
The excess mortality in patients with pituitary adenoma reported in the studies mentioned above was mainly due to cardiovascular and respiratory diseases (3, 8). Several hypotheses explaining the excess mortality have been proposed including hypopituitarism and inadequate hormonal replacement therapy or the tumor itself and its treatments. Radiotherapy (RT) may also contribute to the increased risk of premature death, as suggested in studies of patients with acromegaly (13).
The primary aim of this nationwide study was to analyze the mortality in a large unselected cohort of patients with NFPA. Secondary aims were to study the impact of RT and other potential prognostic factors such as gender, age at diagnosis, presence of hypopituitarism and diabetes insipidus (DI), and different tumor treatments on mortality. Moreover, the study also aimed to investigate the frequency of hypopituitarism in an unselected population of patients with NFPA.
Patients and Methods
Patients were identified in The Swedish National Patient Registry (Patient Registry) and cause of death was obtained from The Swedish National Cause of Death Registry (Cause of Death Registry). The Patient Registry achieved national coverage in 1987 and contains information from every patient visit within the Swedish hospital system. The Cause of Death Registry achieved national coverage in 1952 and collects information regarding every death in Sweden. A patient can be followed up throughout life in these registries, using the unique Swedish personal identification number. The National Board of Health and Welfare secures the high quality of the Patient Registry and the Cause of Death Registry (14, 15).
Earlier studies have shown that combined criteria for identification (both diagnostic codes and department codes) can be used to achieve higher sensitivity and specificity in the process of selecting patients (16, 17). In the present study, we used a combination of identification criteria to ensure a high quality in the selection. Patients should either have been given the NFPA diagnosis [International Classification of Diseases, 10th revision (ICD-10) code D35.2)] from a medical/endocrine care unit at least twice or have been given the NFPA diagnosis from a neurological or neurosurgical care unit at least once and also at least once from a medical/endocrine care unit. All patients with a diagnosis of a GH-, ACTH-, or TSH-secreting adenoma, prolactinoma, craniopharyngioma, pituitary cyst, or a pinealoma were excluded before the inclusion criteria were applied to the registries. An internal validation of the selection criteria was performed by reviewing the NFPA diagnosis of the patients originating from the Sahlgrenska University Hospital's uptake area against patient records.
Patients with NFPA were identified in the Patient Registry from January 1, 1997, when ICD-10 classification was implemented in Sweden. Patients identified with NFPA between January 1, 1997, and December 31, 2011, were included in the study either on the date of diagnosis or at the start of the study, which was January 1, 1987. The follow-up period, in which patients were studied regarding mortality, was from inclusion in the study to death or to the end of the study, December 31, 2011. Date of birth, gender, and diagnoses of hypopituitarism and DI were collected from the Patient Registry. The degree of hypopituitarism and its management were not available in the registry. Information regarding surgical treatments and RT was obtained in patients diagnosed between January 1, 1997, and December 31, 2011, from the Patient Registry (during the ICD-10 classification period).
Causes of death obtained from the Cause of Death Registry were classified in accordance with the ICD-10 classification. In addition, cause-specific mortality was studied for all malignant tumors, malignant neoplasm of the brain, malignant neoplasm of lymphoid, hematopoietic and related tissues, ischemic heart disease, and cerebrovascular disease (for ICD-codes, see Supplemental Materials and Methods).
Ethics
The study was approved by the Regional Ethical Review Board in Gothenburg, Sweden, and by the National Board of Health and Welfare (Sweden).
Statistical analysis
Person-years at risk were calculated from study inclusion to death or end of study and stratified according to gender, 5-year age groups, and 1-year calendar periods. The expected number of cases for each stratum was calculated using the general Swedish population as reference. The observed number of deaths among subjects with NFPA was compared with that expected using SMRs. Ninety-five percent CIs were calculated assuming a Poisson distribution of the observed numbers. Subgroup analyses for gender, age at diagnosis, hormonal deficiencies, and tumor treatments were performed. If less than four events were observed, no estimate was made for SMR. SMRs for nonoverlapping subgroups were compared with each other (18). Average years of life lost (cutoff age 75 y) was calculated for both the entire study population and the subgroups (19). Overall survival rates were analyzed with the Kaplan-Meier method. No patients in the validated subgroup, originating from the Sahlgrenska University Hospital's uptake area was lost to follow-up. Cox regression was used to analyze factors that may predict mortality in the cohort. Annual incidence of NFPA in Sweden was estimated for the time period 2002–2011. The software IBM SPSS (version 21; SPSS Institute) and STATA SE (version 12.1; Stata Corp) were used to perform the analyses in the study.
Role of the funding source
The sponsors did not in any way take part in the study design, collection, analysis, and interpretation of data or in the writing of the article.
Results
The identification criteria found 2795 unique patients with NFPA (1502 men; 1293 women; Table 1). The internal validation of the selection criteria was performed in 467 patients, 17% of the total patient population. NFPA diagnosis was confirmed in 424 patients, which resulted in a positive predictive value of 91%. Other nonfunctioning pituitary tumors were found in 4% of the patients and only 1% of the patients had etiologies not affecting the sella region. In the rest of the patients various other pituitary tumors or diagnoses affecting the sella region were found (see Supplemental Table 1).
Characteristics of Patients With Nonfunctioning Pituitary Adenoma Diagnosed Between January 1, 1987, and December 31, 2011
| Total (n = 2795) | |
|---|---|
| Gender | |
| Men | 1502 (54%) |
| Women | 1293 (46%) |
| Mean age at diagnosis, y | 58.4 (1–97) |
| Men (SD) | 60.2 ± 15 |
| Women (SD) | 56.2 ± 18 |
| Mean follow-up time, y | 7 (0–25) |
| Patient-years in the study | 20 139 |
| Hormonal status | |
| Patients with hypopituitarism | 1500 (54%) |
| Patients with diabetes insipidus | 145 (5%) |
| Patients without any hormonal deficiencies | 1266 (45%) |
| Patients with childhood onset* | 45 (2%) |
| Patients diagnosed at or before 40 y of age | 423 (15%) |
| Patients with adult onset | 2750 (98%) |
| Time of diagnosis | |
| Patients diagnosed before January 1, 1997 | 322 (12%) |
| Patients diagnosed between January 1, 1997, and December 31, 2011 | 2473 (88%) |
| Treatments of patients diagnosed between January 1, 1997, and December 31, 2011 | |
| No surgical treatment or radiotherapy | 1172 (47%) |
| Surgical treatment | 1276 (52%) |
| At least two surgical treatments | 265 (11%) |
| Radiotherapy | 104 (4%) |
Data are n/N (percentage or range) or mean ± SD.
Childhood onset of nonfunctioning pituitary adenoma defined by diagnosis at 18 years or younger.
The mean annual incidence of NFPA was 20.3 (95% CI 18.8–21.9) cases per 1 million inhabitants between 2002 and 2011 (Figure 1), and the mean age at diagnosis was 58.4 ± 17 (SD). Men had a higher incidence rate (21.8, 95% CI 19.7–23.9 vs 18.9, 95% CI 17.8–19.9; P = .03) and higher age at diagnosis (60.2 ± 15 vs. 56.2 ± 18; P < .001) than women (Table 1). The incidence peaked at the age band of 60–65 years for both genders (Figure 2). Only 45 patients (2%) were diagnosed during childhood (≤18 y of age) with NFPA. The diagnosis of hypopituitarism was recorded for 1500 patients (54%), DI for 145 patients (5%), whereas 1266 patients (45%) had no reported hormonal deficiencies. Fifty-two percent of the patients received surgical treatment and 4% were treated with RT.

Incidence of nonfunctioning pituitary adenomas.
Annual incidence rates of nonfunctioning pituitary adenomas per million inhabitants in Sweden during the time period from 2002 to 2011.
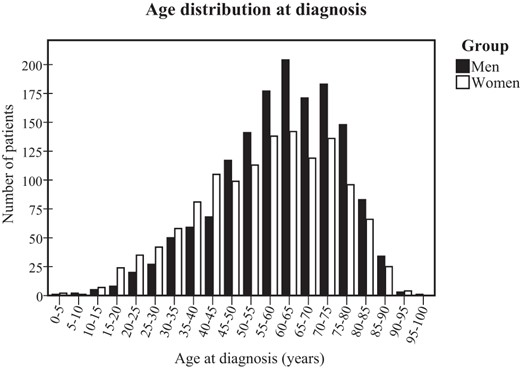
Age distribution at diagnosis.
Reported age at diagnosis for men and women with nonfunctioning pituitary adenoma presented in 5-year age bands.
Overall mortality
A total of 20 139 patient-years was included in the study, resulting in a mean follow-up time of 7 years (range 0–25 y). During the study period, the observed number of deaths was 475, compared with the expected number of 431, resulting in an SMR of 1.10 (95% CI 1.00–1.20) (Table 2). Patients who were diagnosed before or at 40 years of age had an increased mortality with an SMR of 2.68 (95% CI 1.23–5.09) (Figure 3). None of the patients with childhood-onset of NFPA (diagnosed at ≤ 18 y) died during the study. The mortality ratio was increased in women compared with men (1.29, 95% CI 1.11–1.48 vs 1.00, 95% CI 0.88–1.12; P < .01). Women with hypopituitarism and/or DI had an excess mortality, whereas men with hypopituitarism and/or DI did not have an increased mortality ratio (Table 2). Patients with only one surgical treatment in the pituitary region had a mortality ratio similar to the general population. In contrast, an elevated SMR was seen in patients treated with RT and those who received more than one surgical treatment or were treated with RT and received at least one surgical treatment (Table 2). An internal analysis of potential predictors of mortality was performed (Table 3).
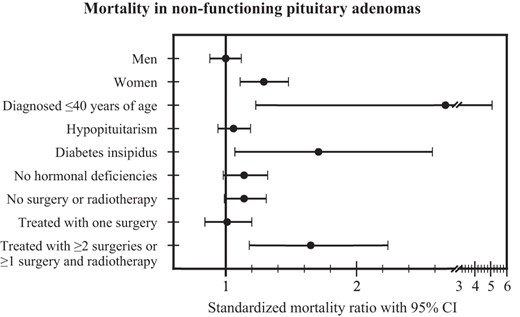
Mortality in nonfunctioning pituitary adenomas.
Mortality in patients with nonfunctioning pituitary adenoma presented as standardized mortality ratio ± 95% CI in subgroups (men, women, patients diagnosed ≤ 40 y of age, patients with hypopituitarism, patients with diabetes insipidus, patients without hormonal deficiencies, patients not treated with surgery or radiotherapy, patients treated with one surgery, and patients treated with two or more surgeries or with one or more surgery and radiotherapy).
Standardized Mortality Ratios for Patients With Non-Functioning Pituitary Adenoma
| Mortality | Expected, n | Dead, n | Standardized Mortality Ratio (95% CI) | P Value |
|---|---|---|---|---|
| Overall mortality | ||||
| Nonfunctioning pituitary adenomas (n = 2795) | 430.7 | 473 | 1.10 (1.00–1.20) | .047 |
| Men (n = 1502) | 279.3 | 278 | 1.00 (0.88–1.12) | .97 |
| Women (n = 1293) | 151.5 | 195 | 1.29 (1.11–1.48) | .0008 |
| Patients diagnosed at 40 y old or younger (n = 423) | 3.4 | 9 | 2.68 (1.23–5.09) | .015 |
| Patients with hypopituitarism and/or DI (n = 179) | 2.1 | 9 | 4.35 (1.99–8.26) | .0006 |
| Patients without hypopituitarism and DI (n = 244) | 1.3 | 0 | NC | NC |
| Cause-specific mortality | ||||
| ICD-10 Chapter 1, infectious disease | 7.2 | 15 | 2.08 (1.17–3.44) | .015 |
| Men (n = 1502) | 4.6 | 11 | 2.41 (1.20–4.31) | .015 |
| Women (n = 1293) | 2.6 | 4 | 1.52 (0.41–3.89) | .54 |
| Patients with hypopituitarism and/or DI (n = 1529) | 4.4 | 10 | 2.29 (1.10–4.20) | .029 |
| Patients without hypopituitarism and DI (n = 1266) | 2.8 | 5 | 1.77 (0.58–4.13) | .31 |
| ICD-10 Chapter 9, circulatory disease | 180.9 | 219 | 1.21 (1.06–1.38) | .007 |
| Men (n = 1502) | 119.7 | 132 | 1.10 (0.92–1.31) | .28 |
| Patients with hypopituitarism and/or DI (n = 957) | 82.4 | 81 | 0.98 (0.78–1.22) | .93 |
| Patients without hypopituitarism and DI (n = 545) | 37.3 | 51 | 1.37 (1.02–1.80) | .037 |
| Women (n = 1293) | 61.3 | 87 | 1.42 (1.14–1.75) | .002 |
| Patients with hypopituitarism and/or DI (n = 572) | 30.2 | 50 | 1.66 (1.23–2.18) | .001 |
| Patients without hypopituitarism and DI (n = 721) | 31.1 | 37 | 1.19 (0.84–1.64) | .33 |
| Ischemic heart disease | 86.1 | 94 | 1.09 (0.88–1.34) | .42 |
| Men (n = 1502) | 61.3 | 60 | 0.98 (0.75–1.26) | .93 |
| Women (n = 1293) | 24.8 | 34 | 1.37 (0.95–1.92) | .091 |
| Cerebrovascular disease | 38.8 | 67 | 1.73 (1.34–2.19) | <.0001 |
| Men (n = 1502) | 23.2 | 39 | 1.68 (1.19–2.30) | .003 |
| Women (n = 1293) | 15.6 | 28 | 1.79 (1.19–2.59) | .006 |
| Patients treated with RT (n = 104)a | 0.9 | 4 | 4.57 (1.24–11.7) | .025 |
| Patients not treated with RT (n = 2369)a | 28.4 | 44 | 1.55 (1.13–2.08) | .008 |
| Malignant neoplasms | 114.7 | 87 | 0.76 (0.61–0.94) | .009 |
| Men (n = 1502) | 74.9 | 56 | 0.75 (0.56–0.97) | .027 |
| Women (n = 1293) | 39.7 | 31 | 0.78 (0.53–1.11) | .19 |
| Patients with hypopituitarism and/or DI (n = 1529) | 75.5 | 54 | 0.72 (0.54–0.93) | .012 |
| Patients without hypopituitarism and DI (n = 1266) | 39.2 | 33 | 0.84 (0.58–1.18) | .36 |
| Patients treated with RT (n = 104)a | 3.4 | 17 | 5.06 (2.95–8.10) | <.0001 |
| Patients not treated with RT (n = 2369)a | 81.8 | 51 | 0.62 (0.46–0.82) | .0003 |
| Malignant neoplasm of the brain | 2.6 | 6 | 2.27 (0.83–4.93) | .11 |
| Malignant neoplasm of lymphoid, hematopoietic, and related tissue | 10.2 | 10 | 0.98 (0.47–1.80) | .99 |
| Overall mortality in subgroups | ||||
| Patients with hypopituitarism (n = 1500) | 269.3 | 286 | 1.06 (0.94–1.19) | .32 |
| Men (n = 946) | 193.0 | 181 | 0.94 (0.81–1.08) | .41 |
| Women (n = 554) | 76.3 | 105 | 1.38 (1.12–1.66) | .002 |
| Patients with DI (n = 145) | 12.9 | 22 | 1.71 (1.07–2.58) | .026 |
| Men (n = 60) | 8.0 | 10 | 1.26 (0.60–2.31) | .56 |
| Women (n = 85) | 4.9 | 12 | 2.43 (1.26–4.25) | .010 |
| Patients without hypopituitarism and DI (n = 1266) | 160.0 | 183 | 1.14 (0.98–1.32) | .079 |
| Men (n = 545) | 85.4 | 95 | 1.11 (0.90–1.36) | .33 |
| Women (n = 721) | 74.5 | 88 | 1.18 (0.95–1.45) | .14 |
| Patients diagnosed before January 1, 1997 (n = 322) | 106.2 | 99 | 0.93 (0.76–1.14) | .52 |
| Patients diagnosed between January 1, 1997, and December 31, 2011 (n = 2473) | 324.7 | 374 | 1.15 (1.04–1.27) | .008 |
| Patients without both surgery and radiotherapy (n = 1172)a | 173.4 | 198 | 1.14 (0.99–1.31) | .071 |
| Patients with one surgery and no radiotherapy (n = 960)a | 124.4 | 125 | 1.01 (0.84–1.20) | .98 |
| Patients with two or more surgeries or with surgery and radiotherapy (n = 316)a | 24.3 | 40 | 1.65 (1.18–2.24) | .004 |
| Patients treated with radiotherapy (n = 104)a | 10.9 | 29 | 2.67 (1.79–3.84) | <.0001 |
Abbreviations: NC, not calculated for groups with less than 4 observed events.
For patients diagnosed between January 1, 1997, and December 31, 2011.
Internal Analysis of Factors Predicting Mortality in Men and Women With Nonfunctioning Pituitary Adenoma
| Cox Regression Analyzing Factors Influencing Mortality | Men | Women | ||
|---|---|---|---|---|
| HR | 95% CI (P Value) | HR | 95% CI (P Value) | |
| All patients | ||||
| Age at diagnosis | 1.12 | 1.10–1.13 (<.0001) | 1.13 | 1.11–1.15 (<.0001) |
| Diagnosed at 40 y or younger | 3.47 | 1.28–9.42 (.015) | 4.20 | 1.32–13.32 (.015) |
| Hypopituitarism | 0.84 | 0.65–1.09 (.18) | 1.09 | 0.81–1.46 (.58) |
| DI | 1.35 | 0.71–2.57 (.36) | 1.81 | 0.99–3.31 (.055) |
| Analysis of treatment with RTa | ||||
| Age at diagnosis | 1.11 | 1.09–1.12 (<.0001) | 1.12 | 1.10–1.14 (<.0001) |
| Treatment with RT | 1.99 | 1.15–3.42 (.014) | 2.81 | 1.63–4.83 (<.0001) |
Abbreviation: HR, hazard ratio.
For patients diagnosed between January 1, 1997, and December 31, 2011.
Cause-specific mortality
Mortality was increased due to infectious disease (ICD-10 chapter 1), SMR 2.08 (95% CI 1.23–5.09), and circulatory diseases (ICD-10 chapter 9), SMR 1.21 (1.06–1.38) (see Supplemental Table 2). The SMR was increased for cerebrovascular disease but not for ischemic heart disease. The observed deaths caused by malignant neoplasm were lower than expected (Table 2). Patients treated with RT had an excess mortality caused by cerebrovascular disease and malignant neoplasm. Only one patient treated with RT died of a malignant neoplasm of brain.
Mortality due to circulatory disease was increased in women with NFPA compared with the general population but not in men (Table 2). In addition, women with reported hypopituitarism and/or DI had an increased SMR due to circulatory diseases (1.66, 95% CI 1.23–2.18), whereas women without hormonal deficiencies demonstrated no excess mortality. SMR was equally increased among men and women for cerebrovascular disease; however, for ischemic heart disease, there was a trend toward a worse outcome for women. A reduced mortality due to malignant tumors was seen in patients with hypopituitarism and/or DI (SMR 0.72, 95% CI 0.54–0.93).
Overall survival rates and average years of life lost
The overall survival rates for the entire NFPA population at 5, 10, and 15 years were 90%, 79%, and 69%, respectively. Furthermore, average years of life lost was 2.78 years (men 2.77 y, women 2.80 y). In patients with DI, hypopituitarism, or no hormonal deficiencies, the average years of life lost were 6.71 years, 3.43 years, and 1.67 years, respectively.
Discussion
This is the first study to investigate mortality, predictors of mortality, and incidence in a large unselected population of patients with NFPA. Although NFPA is a benign tumor, this study shows that the disease has a significant impact on mortality. Excess mortality was particularly seen in women and in patients diagnosed at 40 years of age or younger. In contrast, men with NFPA had the expected mortality ratio. Mortality due to cerebrovascular and infectious diseases was increased both in men and women compared with the general population, whereas death due to malignant tumors was decreased. The overall survival rate at 10 years was 79%, and the average years of life lost was 2.8 years in this nationwide population of patients with NFPA followed up for more than 20 000 patient-years.
Several studies have shown an excess mortality in patients with hypopituitarism due to various etiologies (2, 3, 11). The fraction of patients with NFPA in these studies varies. The only previous study including patients on the basis of tumor diagnosis (pituitary adenoma), and not on the basis of hypopituitarism or surgical treatment, demonstrated an increased SMR of 2.0 (95% CI 1.9–2.2) in patients diagnosed between 1958 and 1991 (8). However, during more than half of the time span in that study, analysis of prolactin was not used in routine clinical care. It is therefore plausible that a substantial number of prolactinomas were included in that study. Furthermore, since this previous study surgical techniques for pituitary surgery have evolved and the use of RT, both for primary and secondary treatment, has decreased, and measurements of prolactin are now used in the routine evaluation of pituitary tumors. These are all factors that may explain the lower SMR in the current study, although it is still increased.
This study is one of the first to investigate predictors of mortality in patients with NFPA. The strongest predictor of excess mortality was a young age at diagnosis, especially in combination with hypopituitarism and/or DI. This is in contrast with a previous study, in which the highest mortality ratio was seen in patients diagnosed between 40 and 69 years of age (8). The current study also found an excess mortality among women, but not among men, diagnosed with hypopituitarism or DI. Increased mortality was also seen in patients treated with multiple surgeries and/or RT. In contrast, patients with only one surgical treatment had an expected mortality ratio. Although tumor size and characteristics could not be assessed in this study, larger and more aggressive tumors are more likely to cause hypopituitarism and DI as well as requiring more advanced tumor treatment, all factors that were shown to have a negative influence on the outcome.
We found an association between increased mortality and the presence of hypopituitarism in women with NFPA, which has been indicated in previous studies, but not clearly demonstrated (20). In contrast, men with hypopituitarism had no excess mortality. Increased mortality in hypopituitary patients with hypogonadotropic hypogonadism has been shown as well as an excess mortality in patients with acromegaly receiving replacement therapy for adrenal insufficiency, in particular patients with higher doses of hydrocortisone (3, 13). Also, in patients with hypopituitarism the presence and management of adrenal insufficiency is associated with increased risk of death, in particular due to adrenal crisis (21). It is therefore likely that adrenal insufficiency and its treatment in hypopituitary patients contributed to the excess mortality seen in these patients, although other pituitary hormone deficiencies, such as GH deficiency may also play an important role (22).
The current study found an excess mortality among women but not among men. In a previous retrospective surgical series of 160 NFPA patients in Denmark, an increased SMR was found in women but not in men (12). A higher mortality among women compared with men was also found in two meta-analyses of patients with pituitary tumors of various etiologies (4, 20). The current study also demonstrated that patients diagnosed with NFPA at an age less than 40 years also fare less well. Because younger age at diagnosis seems to be a predictor of excess mortality, the lower age at diagnosis may in part explain the excess mortality in women because they had a lower mean age at diagnosis. It has been suggested that the excess mortality seen in women with hypopituitarism reflect that hypopituitarism removes their natural survival advantage that they have over men in the general population (23).
Patients with NFPA had an elevated risk of death due to cerebrovascular and infectious diseases. Earlier studies have suggested a multifactorial cause of cerebrovascular disease in hypopituitary patients, eg, lipid abnormalities, impaired vascular structure and function, GH deficiency, and RT treatment (23). Hypopituitary patients may also have an increased risk of life-threatening infections that may theoretically be due to nonoptimal glucocorticoid replacement (24).
Interestingly, the risk of death due to malignant tumors in the total population of NFPA patients was decreased in this study. The current study cannot offer an explanation to this finding, although a reduced serum IGF-1 concentration may be of importance as serum IGF-1 levels in the high normal range may be associated with an increased risk of malignancy (25, 26) and Laron dwarfism with exceptionally low levels of IGF-1 may have a decreased risk of malignancy (27).
The current study is the first to report the frequency of hypopituitarism (54%) in a large cohort of unselected patients with NFPA. In a previous study of surgically treated patients, 67% of the evaluated patients had hypopituitarism (12). The lower frequency of hypopituitarism in the current study may be due to that 47% of the patients did not receive any surgical or RT treatment and that not only patients from tertiary centers were included.
Previous studies have reported an annual incidence rate of 10–11 cases of NFPAs per million inhabitants in Sweden and Finland (7, 8). The current study reports an almost doubled annual incidence rate, 20.3 cases per 1 million inhabitants, which peaks at the age band of 60–65 years. Although this study does not offer any explanation to the higher incidence rate, one might consider the increased use of computerized tomography and magnetic resonance imaging of the head as contributing factors. Additionally, women were diagnosed with NFPA at a younger age than men. A plausible contributor to the lower age at diagnosis among women may be that menstrual complications is an early symptom of pituitary diseases and may lead to an earlier medical evaluation in women.
The limitations of this study include that it is a registry-based study in which detailed clinical characteristics, tumor size, and location as well as more explicit details concerning tumor treatment are not available. Because details on the degree of hypopituitarism and its management were not available in the registry, its impact on mortality could not be investigated. Although the diagnosis of hypopituitarism in these registries has previously been shown to uphold a high quality (17). The strengths of the study are the nationwide population sample and the large number of patient-years included in the analysis. Furthermore, the identification method, with multiple inclusion and exclusion criteria, together with the internal validation of the NFPA diagnosis in a large part of the population, adds strength to the study as compared with other similar studies that have not validated their identification criteria.
In the largest nationwide series of patients with NFPA, there is an excess mortality in women and in younger patients with NFPA. Other predictors of increased mortality in women were hypopituitarism and DI. In addition, multiple surgeries or surgery combined with RT were also associated with impaired outcome, emphasizing the importance of the tumor size, and aggressiveness on the overall outcome. This study stresses the need of targeted improvement in the management of women and young patients diagnosed with NFPA.
Acknowledgments
We express our gratitude to the staff at the Centre for Endocrinology and Metabolism at the Department of Endocrinology at Sahlgrenska University Hospital and to The National Board of Health and Welfare for their excellent collaboration. We also thank Professor Bengt-Åke Bengtsson for his valuable comments on the manuscript.
Author contributors include the following: All authors took part in the design of the study. D.S.O., E.A., and I.-L.B. performed the patient selection process and data collection. D.S.O. designed the figures. P.T. and D.S.O. have reviewed all the patient records in the internal validated cohort. All authors contributed to the data interpretation and analysis and in writing and revising the report. All authors are responsible for the integrity of the data and accuracy of the analysis, and all approved the final report.
This work was supported by The Sahlgrenska University Hospital Fund and The Swedish Government under the ALF agreement.
Disclosure Summary: I.-L.B., P.T., and E.A. have nothing to declare. D.S.O. has received lecture fees from Pfizer and has been a consultant for Ipsen. A.G.N. has been a consultant for Viropharma. G.J. has received lecture fees from Pfizer, NovoNordisk, and Otsuka and has been a consultant for Viropharma and Astra Zeneca.
Abbreviations
- CI
confidence interval
- DI
diabetes insipidus
- ICD-10
International Classification of Diseases, 10th revision
- NFPA
nonfunctioning pituitary adenoma
- RT
radiotherapy
- SMR
standardized mortality ratio.
