


Most epigenetic studies in diabetes compare normal cells in “high glucose” (HG) to cells in “normal glucose” (NG) and cells returned from HG to NG. Here we challenge this approach.
The objective was to determine whether there were differences in gene expression in skin fibroblasts of monozygotic twins (MZT) discordant for type 1 diabetes (T1D).
Skin fibroblasts were grown in NG (5.5 mmol/L) and HG (25 mmol/L) for multiple passages.
This study was conducted at the University of Minnesota.
Patients were nine MZT pairs discordant for T1D.
Gene expression was assessed by mRNA-Seq, using the Illumina HiSeq 2000 instrument. Pathway analysis tested directionally consistent group differences within the Kyoto Encyclopedia of Genes and Genomes pathways.
A total of 3308 genes were differentially expressed between NG and HG in T1D MZT vs 889 in non-T1D twins. DNA replication, proteasome, cell cycle, base excision repair, homologous recombination, pyrimidine metabolism, and spliceosome pathways had overrepresented genes with increased expression in T1D twins with P values ranging from 7.21 × 10⁻¹⁰ to 1.39 × 10⁻⁴. In a companion article, we demonstrate that these pathway changes are related to diabetic nephropathy risk. There were no pathways statistically significant differently expressed in nondiabetic twins in HG vs NG.
In vivo exposure to diabetes alters cells in a manner that markedly changes their in vitro responses to HG. These results highlight the importance of using cells directly derived from diabetic patients for studies examining the effects of HG in diabetes.
Studies suggest that epigenetic modifications are important in diabetes. Thus, benefits of improved glycemic control on diabetic complications during the Diabetes Control and Complications Trial (DCCT) persisted for the several years during the Epidemiology of Diabetes Interventions and Complications (EDIC) follow-up study, despite the absence of group differences in glycemic control (1, 2). Also, reversal of diabetic nephropathy was not seen during the first 5 years after successful pancreas transplantation but was dramatically demonstrable after 10 years (3, 4). These findings are consistent with prolonged “metabolic memory” for the diabetic state. Since the ground-breaking paper in 1990 demonstrating persistent alterations in cell behavior after brief in vitro high glucose (HG) exposure (5), there has been increased understanding of epigenetic processes, but also greater appreciation of the complexity of the interacting influences of DNA methylation, histone modifications, and micro-RNA (miRNA) processes in determining epigenetic outcomes (6).
Most recent in vitro epigenetic studies in diabetes have followed a basic design (5); normal cells are exposed to HG, and behaviors compared to cells are maintained in normal glucose (NG) environments. Then, the cells are returned to NG, and measures of these behaviors are repeated. Using this model, the increased nuclear factor-κB p65 subunit gene expression, which remained elevated after human aortic endothelial cells were returned from HG to NG, was considered consequent to altered histone methylation processes (7). Similar studies assessed expression of superoxide dismutase and related epigenetic changes in diabetic retinopathy pathogenesis (8). HG induced histone modifications in cultured mesangial cells, vascular smooth muscle cells (VSMCs), and monocytes in genes considered important in diabetic complications (9–13). An underlying supposition is that these studies, reflecting the epigenetic effects of transient exposure of normal cells to HG, represent a valid model of “metabolic memory.” However, differences in the in vitro effects of HG in cells from diabetic vs normal individuals would challenge the relevance of direct and epigenetic responses of normal cells to HG.
This challenge to conventional thinking was suggested by studies demonstrating differences in diabetic vs nondiabetic mouse VSMC's in vitro responses to TNF-α (12). After culture for several passages, VSMC from diabetic vs nondiabetic mice demonstrated enhanced proliferation and inflammatory gene expression in response to TNF-α. There was also a more sustained decrease in histone H3 lysine 9 trimethylation (H3K9me3) at the promoters of key inflammatory genes in VSMC from the diabetic mice, suggesting a more relaxed chromatin state around susceptible genes in diabetes (12). Furthermore, a key miRNA (miR-125b), was up-regulated in VSMC from diabetic mice, this miRNA known to down-regulate histone H3K9 methyltransferase Suv39h1, suggesting cross talk between miRNAs and epigenetic chromatin events (14).
This study of in vitro skin fibroblast (SF) responses to HG (15) demonstrated remarkable systematic differences between monozygotic twins discordant for type 1 diabetes (T1D), strongly suggesting that epigenetic changes are responsible for these differences.
Subjects and Methods
Subjects
Participants were nine pairs of monozygotic twins discordant for T1D, all ≥10 years old at enrollment. T1D twins were ≤30 years old at diabetes onset and were on insulin within 6 months. Seven to eight variable DNA markers on cheek cell swabs confirmed monozygosity with >99% certainty (Proactive Genetics). Given our interest in epigenetic effects of in vivo HG, twins were selected from a larger cohort to have glycated hemoglobin (HbA1c) ≥7.2% at the time of study and T1D for ≥4 years. Informed consent (and assent in children) was obtained from all participants. These studies were approved by the Committee for the Use of Human Subjects in Research of the University of Minnesota.
Clinical studies
Blood pressure was measured with a Dinamap monitor. Hypertension was defined as blood pressure ≥130/85 mm Hg in adults or >95th percentile for age and sex in children (16). Patients on antihypertensive drugs were also classified as having hypertension. HbA1c was measured with the Tosoh method (Tosoh Medics; normal 4.3–6.0%).
Skin biopsy and cell culture
Methods for skin biopsy, SF culture, and RNA isolation are detailed elsewhere (17–20). Cells were grown from acquisition in NG (5.5 mmol/L) or HG (25 mmol/L). SF were thawed and passaged before final seeding (fifth passage) into T150 tissue culture flasks at 10 000 cells/cm2 in DMEM with 10% fetal bovine serum, and grown for 60–72 hours until approximately 90% confluency. Cells were then harvested with 0.125% Trypsin-EDTA in Hanks' balanced salt solution without Ca++ or Mg++, washed in DMEM with 10% fetal bovine serum, pelleted by centrifugation, and stored at −80°C until used for RNA isolation. At approximately 90% confluence, these cells are long, spindle-shaped, and growing predominantly in monolayer. Cells were coded by the technician performing the original explants, whereas the technician performing gene expression studies was masked for the twins' identity and diabetes status. Due to the logistics of having skin biopsies arranged when subjects were not local, skin biopsies were performed a few weeks or even a few months apart in a few twin pairs. Primary cultures were stored in liquid nitrogen until used in these experiments. SFs from each pair were then grown and processed simultaneously.
The mirVana kit (Ambion, Life Technologies) was used for total RNA isolation, and integrity was confirmed using the RNA 6000 LabChip kit and Agilent 2100 bioanalyzer (Hewlett Packard).
mRNA-Seq
Cell sample transcriptome sequencing was carried out on the Illumina HiSeq 2000 instrument, in paired-end 2 × 50-bp cycle mode using library creation kits from Illumina Inc. (Tru-Seq RNA sample prep kit) (21). Sets of eight to 12 sample libraries were indexed together in sequencing flow-cell lanes using Illumina indexing adaptors during library creation and sufficient flow-cell lanes to generate ≥10 million filter-passing high-quality reads per sample.
mRNA sequence data analysis
Illumina read files were sent to the Minnesota Supercomputing Institute (MSI) server and converted to FASTQ format data files (http://www.bioinformatics.babraham.ac.uk/projects/fastqc), checked for resynchronization as paired end reads, and sent to the Galaxy/University of Minnesota MSI server for initial data quality assessment, further file conversion, and alignment with University of California, Santa Cruz, Homo sapiens reference genome (build hg19) using the TopHat algorithm. Mapping results were then used to identify exon expression.
Paired end FASTQ data files (two files/sample) were processed through “FastqQC (version 1.0.0.)” algorithm for quality assessment and “Fastq Groomer (version 1.0.4)” algorithm for further file type conversion (Illumina 1.3–1.7 to Sanger formats) before genome reference comparison using the “TopHat (version 1.5.0)” algorithm. TopHat maps quality reads to the reference genome, allowing multiple alignments per read and a maximum of two mismatches of mapping reads to the reference. TopHat builds a database of potential splice junctions and confirms these by comparing the previously unmapped reads against the database of putative junctions (22, 23). TopHat files are converted to BAM files, a tab-delimited text file containing sequence alignment data. BAM files for each sample are imported to a MSI server for gene expression analysis in GeneData Expressionist version 7.0 software (GeneData AG) (http://www.genedata.com) using the GeneData Refiner Genome 7.0 module to convert TopHat exon counts by scaling the read count at a genome location by the length of the mRNA and the total number of 1 × 10⁶ mapable reads to obtain RPKM (reads/kilobase/1 × 106) values. These gene values are then imported into the GeneData Analyst 7.0 module for differential gene expression paired t-testing (GeneData Expressionist version 7.0, Refiner Genome Reference Manual) (21). These selected gene expression data were used for pathway analysis.
Pathway analysis
Previously described directional pathway analysis methodology (15, 20) determined whether differentially expressed genes (up-regulated or down-regulated) were overrepresented in KEGG (Kyoto Encyclopedia of Genes and Genomes) biochemical pathways (24) (http://www.genome.jp/kegg/pathway.html) using Gene Set Enrichment Analysis annotations. For each pathway a 2 × 2 contingency table was constructed separately for up-regulated genes and for down-regulated genes with columns labeled “significant genes” (K) and “nonsignificant genes” (N-K) and rows labeled “present in pathway” (M) and “not present in pathway” (N-M) for a total of N genes. We then determined whether the significance of gene expression differences was independent of being present in a given pathway using a Fisher's exact test that is based on the hypergeometric distribution. Also, as we previously detailed (15, 20), we performed a 1000-fold permutation test that randomly redistributes genes across pathways to generate a null distribution of significant gene counts within each pathway. Both approaches to determining statistical significance gave nearly identical results (15). Enrichment analyses used Exploratory Visual Analysis (EVA) software (http://discovery.dartmouth.edu/∼pandrews/EVA.html) (20, 25, 26).
Directional pathway analyses, performed as we previously reported (15, 20), tested directionally consistent group differences on expression levels within the KEGG pathways. This system also used the 1000-fold permutation test on each pathway to evaluate whether the proportion of statistically significantly increased or decreased genes in a pathway was greater than by chance. Thus, the P value for directional pathway analyses represents the likelihood of obtaining the observed number of genes with increased (or decreased) expression levels in a given biological pathway other than by chance. A pathway was considered to have a statistically significant enrichment for differentially expressed genes at a type I error rate of α = 0.001. To help guard against type I error, we determined, as part of our interpretation, whether evidence existed from human, in vitro, or animal studies for the pathways' relationship to diabetes and/or its complications. We also considered whether these pathways were functionally interrelated, intuiting that such interrelationships decrease the likelihood of observations by chance. However, statistical methods to estimate the likelihood of such interrelationships are not currently available. For those more concerned about type I than type II errors, it is possible to apply a more stringent significance cutoff and subsequent interpretation. Finally, pathways that achieved this level of significance because of differential expression of genes that overlapped with a major pathway were not presented in Results.
Statistical analyses
After the codes for a patient's grouping were broken, paired analyses were performed as detailed above to compare values in NG vs HG in each of the twin groups.
Results
The twins' ages ranged from 13 to 52 years [41.0 ± 11.6 y (mean ± SD)], and diabetes duration ranged from 9 to 41 years (27.7 ± 11.9 y). HbA1c was 8.1 ± 0.7% in the T1D twins (Table 1). All nondiabetic twins had normal HbA1c values.
Demographic and Clinical Characteristics of Diabetic and Nondiabetic Twins
| Diabetic Twins | Nondiabetic Twins | P | |
|---|---|---|---|
| Male/female | 1/8 | 1/8 | NA |
| Age, y | 41.4 ± 11.8 | 40.5 ± 12.2 | NA |
| Diabetes duration, y | 27.7 ± 11.9 | NA | NA |
| HbA1c, % | 8.1 ± 0.7 | 5.2 ± 0.4 | <.001 |
| Diabetic Twins | Nondiabetic Twins | P | |
|---|---|---|---|
| Male/female | 1/8 | 1/8 | NA |
| Age, y | 41.4 ± 11.8 | 40.5 ± 12.2 | NA |
| Diabetes duration, y | 27.7 ± 11.9 | NA | NA |
| HbA1c, % | 8.1 ± 0.7 | 5.2 ± 0.4 | <.001 |
Abbreviation: NA, not applicable, identical by design. Data are expressed as means ± SD or number of subjects.
Gene expression
A total of 3308 genes were differentially expressed between NG and HG in the T1D twins compared to only 889 genes in the nondiabetic twins.
Pathway analyses
T1D twins
Seven pathways had a significantly greater proportion of genes that were increased in expression between NG and HG in T1D twins. These included proteasome (P = 6.41e−10), DNA replication (P = 7.21e−10), cell cycle (P = 1.47e−8), base excision repair (BER; P = 2.15e−8), homologous recombination (P = 1.77e−4), pyrimidine metabolism (P = 1.77e−4), and spliceosome (P = 1.39e−4) (Table 2). In addition, the oxidative phosphorylation (OxPhos) pathway had a strong trend toward having more genes (41 of 102) that were up-regulated by HG (P = .0016).
Pathways With Increase Proportion of Differentially Up-Regulated/Expressed Genes Between NG and HG in the Monozygotic Twins With T1D
| Pathway | Up-Regulated/Expressed Genes | Directional P Value |
|---|---|---|
| Proteasome | 29/40 | 6.41e−10 |
| DNA replication | 26/34 | 7.21e−10 |
| Cell cycle | 59/111 | 1.47e−8 |
| Base excision repair | 21/32 | 2.15e−6 |
| Homologous recombination | 16/25 | 1.77e−4 |
| Pyrimidine metabolism | 37/87 | 1.77e−4 |
| Spliceosome | 43/110 | 1.39e−4 |
Nondiabetic twins
Six pathways [inositol phosphate metabolism (P = .0038), mammalian target of rapamycin signaling (P = .0187), glycan degradation (P = .0188), phosphatidylinositol signaling (P = .0197), JAK-STAT signaling (P = .0203), and adherens junction (P = .0231)] showed trends toward greater numbers of down-regulated genes and six other pathways [glycosaminoglycan biosynthesis (P = .0073), asthma (P = .0089), autoimmune thyroid disease (P = .0175), cell adhesion (P = .0276), T1D (P = .0293), and intestinal immune network for IgA production (P = .0327)] had trends toward a greater proportion of genes that were increased in expression among nondiabetic twins in HG vs NG.
Discussion
Epigenetic modifications are mediated by DNA modifications (27), histone post-translational modifications (28), and miRNAs (29). Although repeatedly invoked, the concept of “metabolic memory” in the pathogenesis of diabetic complications has not been directly studied in humans, this despite strong support from clinical data (1–4).
The discordant monozygotic twin model gains its power for study of epigenetic effects of diabetes from the fact that the twins are genetically identical. Moreover, the uniformity of differences among the twin pairs makes it highly unlikely that environmental influences other than consequences of T1D could explain the findings. We previously reported microarray gene expression differences in SF in HG in a smaller cohort of monozygotic twins discordant for T1D in pathways previously associated with in vitro HG and/or in vivo diabetes (15). However, these differences were far less robust than the present findings, perhaps due to the different methodologies (microarray vs Hi-Seq), the smaller number of twins in the earlier study, and, importantly, the comparisons in HG alone vs this study where the focus was on the changes in gene expression from NG to HG (15). There was a >3.5-fold greater number of differentially expressed genes in HG vs NG in the T1D vs the nondiabetic twins. In addition, there were seven pathways that were highly statistically significantly directionally altered from NG to HG in the T1D twins but not in the nondiabetic twins, whereas different pathways showed only nonstatistically significant trends for directional alterations in the nondiabetic twins. These likely epigenetic alterations were present despite multiple passages and about 6 weeks in vitro, far longer than previous studies that assessed the durability of relatively brief in vitro HG exposure (7).
Some epigenetic processes may be cell specific (30); thus, extrapolation from the present studies to target organs for diabetic complications should be done with caution. Nonetheless, the apparent epigenetic influences of intensified glycemic control in the DCCT/EDIC studies affected multiple organ systems [ocular (31), renal (32), cardiovascular (33), and neurological (34)]. Moreover, there was an association between skin intrinsic fluorescence, an indirect measure of advanced glycation end-products content, and chronic complications in the DCCT/EDIC cohort (35). Interestingly, thickening of vascular walls was observed by electron microscopy in skin biopsies of T1D patients (36). This was caused by the peripheral deposition of basement membrane-like material admixed with variable amounts of collagen fibrils. In addition, an increased amount of an unidentified material, most likely basement membrane, was deposited within the vascular wall itself (36). Importantly, in a companion article (37) we show that many of the gene expression pathways up-regulated from NG to HG in the T1D monozygotic twins overlap with pathways up-regulated in HG in SF from T1D patients without vs with diabetic nephropathy, giving relevance of these T1D discordant identical twin studies to a major diabetic complication. Moreover, as mentioned above, to guard against type I errors, it is useful to consider the possible relevance of the pathway findings to diabetes and its complications. Several of the HG-driven up-regulated pathways in the T1D monozygotic twin are related to known effects of HG on cell function and to the pathogenesis of diabetic complications.
Multiple elements of the proteasome were up-regulated by HG in the T1D twins. Proteasome system up-regulation can result from mild to moderate oxidative stress, which damages proteins that are then removed by this system (38). Also, the ubiquitin-proteasome system and the lysosome/autophagy pathway are involved in degradation of advanced glycation end-products, and glycatively modified substrates are degraded more slowly by the ubiquitin-proteasome system (38).
Oxidative DNA damage requires elements of the BER pathway for maintenance of genomic integrity (39). Gene expression in the BER pathway was also up-regulated by HG in the T1D. It is attractive to conceptualize that hyperglycemia in individuals with diabetes induces glycation and oxidative stress, both capable of damaging proteins, whereas oxidative stress causes DNA lesions that activate BER, the major repair pathway for damaged DNA bases. In a companion paper (37), we report that the BER pathway was also up-regulated in patients protected from diabetic nephropathy. Other DNA repair pathways, including nucleotide excision repair, mismatch repair, and double-strand break repair, comprise the homologous recombination and nonhomologous end-joining subpathways (40). Imbalance between these processes of injury and repair could lead to long-term consequences of diabetes.
There was also differential expression of cell cycle genes in the T1D. Virtually all of the 59 cell cycle genes differentially expressed between NG and HG in the T1D twins fell into clear functional groups. Eight encode proteins key to cell cycle control (cyclins CCNB1, CCNB2, CCNE2, CCNA2, and CCND3) and cyclin-dependent kinases (CDK1, CDK2, CDK4). Small molecular inhibitors regulating cdc2/cdk1 activity (PKYMT1 and CDKN2C and D) were also involved. One of the gene groups comprised members of the E2F family (E2F1, 2, 4) that plays an important role in DNA replication and initiation of S phase. Nearly half of the remaining of the differentially expressed cell cycle genes are involved in control of M phase entry (CDC25A, B, C, and WEE1) and chromosome segregation at anaphase onset. Proteins encoded by these genes are crucial in determining metaphase-anaphase transition timing and triggering physical separation of sister chromatids at anaphase onset, and include: 1) chromosomal proteins securin, separase, and cohesin complex; 2) proteins in the spindle assembly checkpoint; and 3) subunits and/or coactivators of anaphase-promoting complex/cyclosome. The DNA replication, BER, RNA degradation, and spliceosome pathways, also differentially up-regulated by HG in the T1D monozygotic twin, would necessarily be involved in increased cell cycle activity. All these pathways were also markedly up-regulated in SF in HG from T1D patients without vs with diabetic nephropathy, findings further supporting the relevance of these twin studies to diabetic complications (37).
There is also an interesting possible relationship between the up-regulation of the OxPhos and its feeder tricarboxylic acid pathway by HG to the up-regulation of the cell cycle and related pathways in the T1D twins. The OxPhos pathway is important in mitochondrial reactive oxygen species production, and reactive oxygen species can act as second messengers controlling cell proliferation (41). As mentioned, we previously found up-regulation of OxPhos/ tricarboxylic acid complex genes in SF in HG in T1D patients with rapid vs very slow development of diabetic nephropathy (20). Functional studies are critical for further understanding of these oxidative stress phenomena. Interestingly, paralleling the present study, prostatic tissues from diabetic rats evidenced changes in expression of multiple genes, particularly in pathways of cell proliferation, DNA damage repair, and cell cycle checkpoints (42).
There were trends for inositol phosphate metabolism, mammalian target of rapamycin signaling, glycan degradation, phosphatidylinositol signaling, JAK-STAT signaling, adherens junction, glycosaminoglycan biosynthesis, asthma, autoimmune thyroid disease, cell adhesion, T1D, and intestinal immune network for IgA production to be differentially expressed in HG vs NG in the nondiabetic twins but not in the T1D twins. Overall, the relative paucity of gene and pathway expression changes and their weak statistical significance in the SF of the non-T1D compared to the T1D twins is striking. These results with “normal” cells may appear to differ from other studies showing acute effects of HG on in vitro cell behaviors (43). However, these tend to be much shorter term studies, very different in design from the present studies. Testing the effects of short vs long in vitro HG exposure is clearly of interest.
In summary, these discordant monozygotic twin studies suggest that prior in vivo exposure to hyperglycemia markedly epigenetically alters gene expression responses to in vitro exposure to HG. Thus, changes in behavior of cells derived from individuals with diabetes, upon relatively prolonged exposure to HG, are not mirrored by identical in vitro HG exposure of cells from their genetically monozygotic nondiabetic twins. These results and the as well as the results of animal studies (12, 42, 44) argue for a paradigm shift in research strategies to uncover epigenetic processes in diabetes. Clearly, the response of SF to HG is greatly exaggerated and different in kind in the T1D twin. Moreover, these responses to HG in the T1D twin were largely in pathways previously linked to diabetes and/or the pathogenesis of diabetic complications, and several of these pathways are functionally interrelated (Figure 1). A companion article (37) links the findings in the present report to diabetic complications. This argues that the proper focus for questions related to the study of the influence of hyperglycemia on cellular processes in diabetes should involve cells derived from individuals or animals with diabetes, and that the discordant monozygotic twins represent an excellent model for such studies.
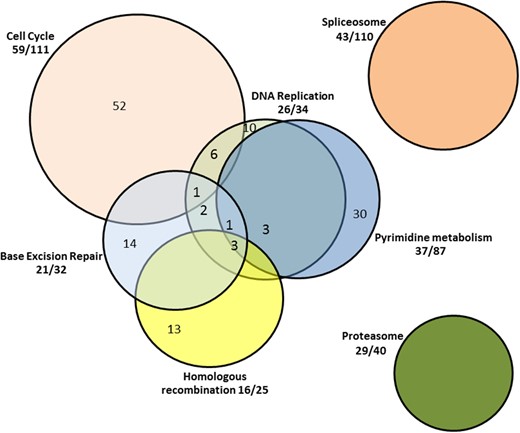
Pathways up-regulated by HG in monozygotic twins with T1D.
Fractions outside the Venn diagram represent the proportion of genes in a given pathway that are up-regulated by HG. Numbers within the Venn diagram reflect the numbers of genes up-regulated by HG exclusively within a given pathway and as included in more than one functionally interrelated pathway.
Acknowledgments
We thank Cathy Bagne for her clinical coordinator efforts, Paul Walker and Jhuma Saha for their technical work, and Patricia L. Erickson and Tanya Double for assistance in manuscript preparation. This work was carried out, in part, using computing resources at the University of Minnesota Supercomputing Institute.
Current address for J.H.M. is Informatics, Department of Biostatistics and Epidemiology, Perelman School of Medicine, University of Pennsylvania, Philadelphia, PA 19104.
This work was supported by a research grant from the Juvenile Diabetes Research Foundation (JDRF-42-2009-755; to M.L.C.) and by funds from the Pennock Professorship (to M.L.C.). M.L.C. was a recipient of a JDRF Career Development Award and is the guarantor of this work.
Disclosure Summary: The authors have nothing to disclose.
For related article see page E876
Abbreviations
- BER
base excision repair
- HbA1c
glycated hemoglobin
- HG
high glucose
- miRNA
micro-RNA
- NG
normal glucose
- OxPhos
oxidative phosphorylation
- SF
skin fibroblast
- T1D
type 1 diabetes
- VSMC
vascular smooth muscle cells.
