


Abstract
Sirtuins (SIRTs) regulate cellular metabolism and mitochondrial function according to the energy state of the cell reflected by NAD+ levels.
Our aim was to determine whether expressions of SIRTs and NAD+ biosynthesis genes are affected by acquired obesity and how possible alterations are connected with metabolic dysfunction while controlling for genetic and familial factors.
We studied a cross-sectional sample of 40 healthy pairs of monozygotic twins, including 26 pairs who were discordant for body mass index (within-pair difference > 3 kg/m2), from the FinnTwin12 and FinnTwin16 cohorts.
Subcutaneous adipose tissue (SAT) transcriptomics was analyzed by using Affymetrix U133 Plus 2.0 chips, total SAT (poly-ADP) ribose polymerase (PARP) activity by an ELISA kit, body composition by dual-energy x-ray absorptiometry and magnetic resonance imaging/spectroscopy, and insulin sensitivity by an oral glucose tolerance test.
SIRT1, SIRT3, SIRT5, NAMPT, NMNAT2, NMNAT3, and NRK1 expressions were significantly down-regulated and the activity of main cellular NAD+ consumers, PARPs, trended to be higher in the SAT of heavier co-twins of body mass index–discordant pairs. Controlling for twin-shared factors, SIRT1, SIRT3, NAMPT, NMNAT3, and NRK1 were significantly negatively correlated with adiposity, SIRT1, SIRT5, NMNAT2, NMNAT3, and NRK1 were negatively correlated with inflammation, and SIRT1 and SIRT5 were positively correlated with insulin sensitivity. Expressions of genes involved in mitochondrial unfolded protein response were also significantly down-regulated in the heavier co-twins.
Our data highlight a strong relationship of reduced NAD+/SIRT pathway expression with acquired obesity, inflammation, insulin resistance, and impaired mitochondrial protein homeostasis in SAT.
Inflammation, defective mitochondrial function, and impaired adipogenesis in subcutaneous adipose tissue (SAT) have been thought to underlie some of the pathological metabolic changes observed in obesity (1, 2). One possible factor behind the adipose tissue dysfunction in obesity and overnutrition is the down-regulation of the NAD+/sirtuin (SIRT) pathway—an essential mechanism sensing the energy levels within the cells (3). The SIRT family is comprised of seven proteins (SIRT1–SIRT7) that are expressed in metabolically active tissues, including white adipose tissue. SIRT1, SIRT6, and SIRT7 are localized in the nucleus; SIRT2 shuttles between the cytosol and the nucleus; and SIRT3, SIRT4, and SIRT5 are mitochondrial (3). SIRTs all share the dependence for NAD+ as an enzymatic cosubstrate and are activated by increased NAD+ levels during energy deprivation (3). In addition, at least the expression of Sirt1 is controlled by NAD+ levels (4). The availability of intracellular NAD+ levels is modulated by the biosynthesis and consumption of NAD+. Nicotinamide phosphoribosyltransferase (NAMPT) catalyzes the the rate-limiting step in the salvage pathway, which converts the main mammalian NAD+ precursor, nicotinamide, to NAD+ (5). Other major enzymes involved in NAD+ biosynthesis pathways are nicotinamide mononucleotide (NMN) adenylyltransferases 1 to 3: NMNAT1 (nuclear), NMNAT2 (golgi complex and cytosol), NMNAT3 (mitochondrial or cytosolic), and nicotinamide riboside kinases 1 to 3 (NRK1–3). Members of the (poly-ADP) ribose polymerase (PARP) enzyme family are the major consumers of the NAD+ pool (3).
SIRTs are deacylases and/or monoADP-ribosylates that control the activity of their target proteins in diverse cellular functions. SIRT1 deacetylates several critical regulators of metabolism and stress responses. Consequently, pharmacological activation or overexpression of Sirt1 increases mitochondrial function, energy expenditure, and insulin sensitivity (5–11) and also decreases inflammation (12). SIRT3 possibly supports proper mitochondrial oxidation and fatty acid oxidation and increases mitochondrial antioxidative capabilities via target protein deacetylation (3). Collectively, SIRT1 and SIRT3 induce the mitochondrial unfolded protein response (UPRmt), a pathway that promotes mitochondrial protein quality by protecting mitochondria from proteotoxic stress caused by misfolded proteins (13, 14). SIRT2 may promote adipogenesis and lipolysis through deacetylation and activation of forkhead box protein O1 (3), whereas SIRT4 represses lipid oxidation via deacetylation and inhibition of malonyl-coenzyme A decarboxylase activity (15). In contrast, SIRT5 possibly promotes mitochondrial respiration (16) and fatty acid oxidation (17) and controls lysine acylation of mitochondrial proteins (18). Overall, most of the SIRTs seem to drive favorable outcomes in metabolism and mitochondrial function.
It has been recently discovered that increases in SIRT activity and NAD+ levels can counteract the deleterious effects of overnutrition and physical inactivity on mitochondrial function and metabolic health (5, 9). Besides that, our knowledge of the role and function of SIRTs and NAD+ biology in obesity is limited. In particular, studies in human adipose tissue are rare, as most of the knowledge of SIRT biology is based on animal studies. Moreover, the existing SIRT studies on humans are limited by their inability to control for confounding factors such as genetic variation or early environmental factors. Here, we studied a cohort of young adult monozygotic (MZ) twin pairs, a most of whom were discordant for body mass index (BMI). This allowed us to assess the long-term effects of acquired obesity on SIRT expression and metabolic health while controlling for genetics and early environmental factors. We show that the expressions SIRT1, SIRT3, SIRT5, and NAD+ biosynthesis genes are reduced, and PARP activity trended to be increased in the SAT of the heavier MZ twins compared with their leaner co-twins. We also show that several measures of adiposity and insulin resistance and inflammation correlate negatively with SIRT1, SIRT5, and NAD+ biosynthesis gene expressions. Finally, we demonstrate that the expression of multiple UPRmt genes is significantly lower in the heavier co-twins, indicating impaired mitochondrial protein quality control, possibly due to reduced the NAD+/SIRT pathway activity.
Materials and Methods
Participants
This study included 26 obesity-discordant (within-pair difference in BMI ≥ 3 kg/m2) and 14 concordant MZ pairs (BMI difference < 3 kg/m2), identified from ten full-birth cohorts of Finnish twins (n = 5417 families) (19). For a detailed description of the twins see Naukkarinen et al (2). One heavier co-twin had type 2 diabetes and used metformin and insulin. Another heavier co-twin had inactive ulcerative colitis and used mesalazine and azathioprine. All other participants were healthy and normotensive and did not take any medications except for oral contraceptives.
Written informed consent was obtained from all participants. The study protocols were approved by the Ethical Committee of the Helsinki University Central Hospital.
Body composition
Weight, height, whole-body fat (by dual energy x-ray absorptiometry), abdominal sc and intra-abdominal fat (by magnetic resonance imaging), and liver fat (by magnetic resonance spectroscopy) were measured as described earlier (2). The diameter of adipocytes was measured with a light microscope as described in Heinonen et al (20).
Physical activity and diet
Physical activity was measured using the Baecke questionnaire (21). Dietary intake was assessed from 3-day food records and analyzed with the Diet32 program (Aivo), based on a national Finnish database for food composition (Fineli, www.fineli.fi).
Blood tests and oral glucose tolerance test
See the Supplemental Material for a description of the laboratory methods.
Transcriptomics analyses of SAT
Biopsies of periumbilical SAT were obtained under local lidocaine anesthesia by a surgical technique and snap frozen in liquid nitrogen for the extraction of total RNA. Total RNA was extracted from SAT using the RNeasy Lipid Mini Kit (QIAGEN) as described in Heinonen et al (1). Transcriptomics experiments were performed with Affymetrix U133 Plus 2.0 chips. Raw gene expression data were preprocessed with the GeneChip robust multiarray averaging algorithm using BioConductor (22) in R, using Brainarray custom cdf for probe annotations (23). SIRT1 expression results were validated with quantitative RT-PCR as described in Heinonen et al (1) and Naukkarinen et al (2). The primers used were: SIRT1 (Forward: 5′-TAGGCGGCTTGATGGTAATC-3′, Reverse: 5′-TCTGGCATGTCCCACTATCA-3′) and tyrosine 3-monooxygenase/tryptophan 5-monooxygenase activation protein zeta as a reference gene (Forward: 5′-ACTTTTGGTACATTGTGGCTTCAA-3′, Reverse: 5′-TCTGGCATGTCCCACTATCA-3′).
Based on the literature, we studied selected Gene Ontology (GO) terms depicting inflammation or leukocyte activity in the SAT. The following GO terms were included in the analyses: ‘positive regulation of macrophage chemotaxis’ (GO: 0010759), ‘macrophage activation involved in immune response’ (GO: 0002281), ‘positive regulation of neutrophil chemotaxis’ (GO: 0090023), ‘positive regulation of T cell chemotaxis’ (GO: 0010820), and ‘positive regulation of acute inflammatory response’ (GO: 0002675). Originally, ‘positive regulation of chronic inflammatory response’ (GO: 0002678), ‘positive regulation of T cell activation’ (GO: 0050870) and ‘positive regulation of neutrophil activation’ (GO: 1902565) were also selected but discarded given that many of their genes were not expressed at detectable levels in the samples. A mean-centroid value representing the activity of a pathway was calculated for all GO pathways by normalizing the expression levels of the genes in the pathway to a mean of zero and SD of 1 across all individuals, and then calculating the arithmetic mean of those normalized values.
Statistical analysis
Data were analyzed using R 3.1.1 and Stata 13.0 (StataCorp). In Table 1, data are presented as means ± SD for nonskewed variables and as median (interquartile range) for variables with a skewed distribution. Differences between groups were examined by t tests for normally distributed variables and Wilcoxon signed-rank tests for skewed variables. For the correlational analyses in Figures 1 and 2, skewed variables (sc fat volume, intra-abdominal fat volume, liver fat %, plasma leptin, plasma adiponectin, serum hs-CRP, homeostasis model of assessment–insulin resistance (HOMA-IR), Matsuda index, SAT SIRT1 expression, SIRT5 expression, NAMPT expression, IRS1 expression, CD14 expression, and macrophage activation) were transformed by calculating natural logarithms of them.
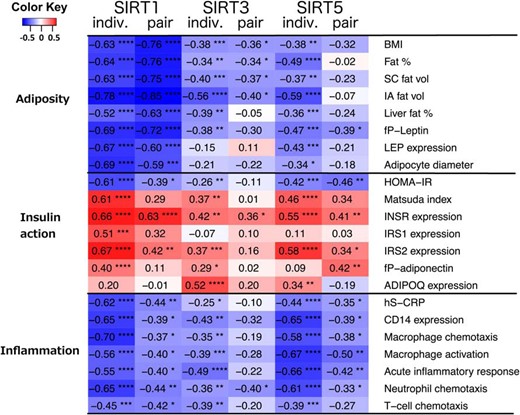
Correlations of SIRTs in SAT with different clinical and gene expression parameters in SAT.
Correlation coefficients depict partial correlations between variables, adjusting for age and sex. Individual (indiv.) correlations are calculated treating every subject as an individual, within-pair (pair) correlations are calculated for within-pair differences (heavy–lean co-twin) of each variable. Color of the cell denotes the strength and direction of correlations (blue, negative; red, positive) and asterisks mark their significance (*, P < .05; **, P < .01; ***, P < .001; ****, P < .0001). SC fat vol, subcutaneous fat volume; IA fat vol, intra-abdominal fat volume; LEP, leptin gene; INSR, insulin receptor gene; IRS1, insulin receptor substrate 1 gene; IRS 2, insulin receptor substrate 2 gene; ADIPOQ, adiponectin gene.

Correlations of NAD+ synthesis enzymes SAT with different clinical and gene expression parameters in SAT.
Correlation coefficients depict partial correlations between variables, adjusting for age and sex. Individual (indiv.) correlations are calculated treating every subject as an individual, within-pair (pair) correlations are calculated for within-pair differences (heavy–lean co-twin) of each variable. Color of the cell denotes the strength and direction of correlations (blue, negative; red, positive) and asterisks mark their significance (*, P < .05; **, P < .01; ***, P < .001; ****, P < .0001). NAMPT, nicotinamide phosphoribosyltransferase; NMNAT1–3, nicotinamidemononucleotide adenylyltransferase 1–3; NRK1, nicotinamide riboside kinase; SC fat vol, subcutaneous fat volume; IA fat vol, intra-abdominal fat volume; LEP, leptin gene; INSR, insulin receptor gene; IRS1, insulin receptor substrate 1 gene; IRS 2, insulin receptor substrate 2 gene; ADIPOQ, adiponectin gene.
Clinical Characteristics of Subjects
| Variable | Concordant, Both Co-twins (n = 28) | BMI-Discordant Lean (n = 26) | BMI-Discordant Heavy (n = 26) | P for BMI-Discordant Heavy Versus Lean |
|---|---|---|---|---|
| Age, y | 31.9 ± 3.3 | 30.2 ± 4.8 | 30.2 ± 4.8 | |
| Female, % | 36% | 65% | 65% | |
| Height, cm | 171 ± 11 | 172 ± 10 | 172 ± 10 | .349 |
| Weight, kg | 79.3 ± 13.3 | 75.4 ± 18.0 | 93.3 ± 20.4 | <.001 |
| BMI | 27.0 ± 3.6 | 25.3 ± 4.5 | 31.3 ± 5.2 | <.001 |
| Waist circumference, cm | 87.4 ± 9.3 | 83.6 ± 12.9 | 99.8 ± 14.6 | <.001 |
| Body fat, % | 29.2 ± 9.1 | 32.3 ± 9.2 | 41.1 ± 6.8 | <.001 |
| sc fat, cm3 | 2850 (2420–4000) | 3230 (2440–4910) | 5710 (4310–7950) | <.001 |
| Intra-abdominal fat, cm3 | 1040 (448–1480) | 571 (327–805) | 1200 (743–2210) | <.001 |
| Liver fat, % | 0.97 (0.51–2.01) | 0.58 (0.42–0.97) | 2.73 (0.64–7.28) | <.001 |
| Fat-free mass, kg | 55.9 (45.8–61.2) | 46.0 (41.2–57.7) | 51.7 (41.9–63.9) | <.001 |
| Adipocyte diameter, μma | 84.0 ± 11.0 | 80.9 ± 12.7 | 95.0 ± 14.1 | <.001 |
| fP-glucose, mmol/L | 5.40 (4.90–5.60) | 5.05 (4.90–5.50) | 5.40 (4.90–5.70) | .059 |
| AUC glucose, mmol/L × h | 13.9 (12.1–15.9) | 13.8 (12.5–15.3) | 14.6 (13.3–17.3) | .728 |
| fS-insulin, mU/L | 5.2 (3.0–6.9) | 4.5 (3.2–6.7) | 7.5 (4.9–9.9) | <.001 |
| AUC insulin, pmol/L × h | 66.2 (47.7–86.0) | 76.5 (58.1–103) | 111 (86.3–134) | .047 |
| HOMA-IR | 1.33 (0.64–1.72) | 1.05 (0.69–1.51) | 1.75 (1.02–2.38) | <.001 |
| Matsuda index | 7.51 (5.86–12.4) | 8.01 (6.04–11.2) | 4.82 (3.92–7.57) | .001 |
| fP-Leptin, pg/mL | 7500 (3740–15200) | 12200 (7460–27100) | 27000 (18800–55700) | <.001 |
| fP-Adiponectin, ng/mL | 2520 (1920–3970) | 3710 (2360–4800) | 2600 (1760–3520) | <.001 |
| fS-eNampt, ng/mL | 3.06 ± 1.71 | 2.87 ± 1.48 | 3.24 ± 1.67 | .357 |
| fS-hs-CRP, mg/dL | 0.80 (0.32–1.48) | 1.01 (0.45–3.93) | 1.58 (0.8–6.32) | .015 |
| LDL-cholesterol, mmol/L | 2.80 (2.35–3.35) | 2.55 (2.10–2.90) | 2.75 (2.50–3.40) | .035 |
| HDL-cholesterol, mmol/L | 1.24 (1.09–1.50) | 1.64 (1.28–1.94) | 1.27 (1.12–1.42) | <.001 |
| Triglycerides, mmol/L | 0.72 (0.57–1.11) | 0.87 (0.68–1.17) | 1.13 (0.78–1.43) | .014 |
| Physical activity | 8.65 ± 1.89 | 8.64 ± 1.51 | 7.99 ± 1.42 | .037 |
| Energy intake, kcal | 2180.6 ± 550.2 | 2072.9 ± 542.5 | 2132.5 ± 531.2 | .663 |
| Protein intake, g | 97.9 ± 33.4 | 90.0 ± 38.4 | 86.2 ± 25.4 | .674 |
| Fat intake, g | 82.6 ± 27.6 | 82.8 ± 30.8 | 84.8 ± 22.5 | .764 |
| Carbohydrate intake, g | 228.5 ± 62.9 | 219.7 ± 61.3 | 221.6 ± 70.3 | .899 |
Abbreviations: HDL, high-density lipoprotein; LDL, low-density lipoprotein.
Data are shown as mean ± sd and median (interquartile range) for variables with a skewed distribution. P-values are from paired t tests and Wilcoxon signed-rank tests for skewed variables.
For Adipocyte diameter n = 16 for concordant, n = 25 for discordant pairs.
Correlations between variables were assessed with R by calculating partial correlation coefficients corrected for age and sex. The variance estimates were corrected for stratified sampling by twin pairs in all of the nonpair analyses using a survey package for R (survey 3.29-5). Within-pair difference variables were calculated by subtracting the leaner twins' values from the heavier co-twins' values. BMI-concordant twin pairs were included in the correlational analyses with the BMI-discordant pairs. For the partial correlations in the heat map, overly influential outlier observations that had a Cook's D (which depicts the effect of the said observation on the correlation coefficient) of over 4/N were removed from the final models.
Results
Clinical characteristics of the twins
The heavier co-twins of the BMI-discordant pairs (ΔBMI > 3 kg/m2) were on average 18.0 kg (25%) heavier and had 13.3 kg (69%) more total adipose tissue than their leaner co-twins (Table 1.). The heavier co-twins also had on average 8.9% higher fat percentage, 89% more sc fat, 20% greater waist circumference, 172% more intra-abdominal fat, 476% more liver fat, 8.2% higher fat-free mass, and 17% larger average adipocyte diameter. The heavier co-twins were more insulin resistant with higher fasting insulin, insulin area under the curve (AUC), and HOMA-IR, and lower Matsuda indices. They also had higher levels of low-density lipoprotein cholesterol, triacylglycerols and leptin, lower levels of high-density lipoprotein cholesterol and adiponectin, and signs of low-grade inflammation with higher levels of serum hs-CRP. However, only five of the heavier co-twins met the International Diabetes Federation criteria for the metabolic syndrome. Leaner co-twins were found to be significantly more physically active. There were no significant differences in the intake of total energy, protein, fat, or carbohydrates (as assessed by food diaries) between BMI-discordant co-twins.
Expression of SIRTs and NAD+ biosynthesis genes, and total PARP activity in SAT
Affymetrix gene array results of SAT revealed that SIRT1, SIRT3, and SIRT5 were significantly down-regulated in the heavier co-twins of the BMI-discordant twin pairs (Figure 3, A–C). There were no significant differences in the expression levels of SIRT2 (P = .38) or SIRT7 (P = .40) whereas SIRT4 and SIRT6 expressions were undetectable. Given that SIRT activity depends on intracellular NAD+ levels, the expression of genes involved in NAD+ biosynthesis were examined. The expressions of NAMPT, NMNAT2, NMNAT3, and NRK1 were significantly lower in the heavier co-twins (Figure 3, D and F–H). Conversely, NMNAT1 expression was up-regulated (Figure 3E). The activity of main cellular NAD+ consumers, PARPs trended to be higher in the heavier co-twins (Figure 3I). The expression of the most investigated SIRT, SIRT1, was verified with RT-PCR in a subset of twins. The results obtained with Affymetrix and RT-PCR were highly correlated (Figure 3J). The localization of SIRT1, SIRT3, and SIRT5 in adipocytes was verified using immunohistochemistry (Supplemental Figure 1). Furthermore, serum NAMPT (visfatin) concentration was determined, but no significant difference between BMI-discordant twins was found (Table 1), although the concentrations of serum NAMPT correlated moderately with measures of adiposity (Supplemental Table 1).
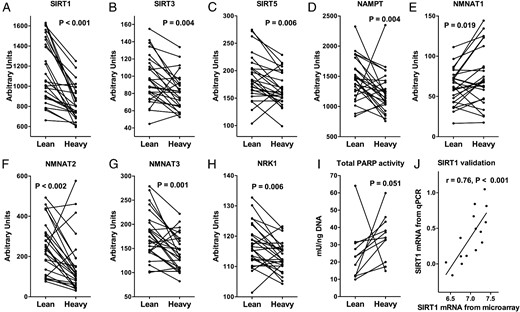
SAT expression of SIRT1 (A), SIRT3 (B), SIRT5 (C), and NAD+-biosynthesis genes (D–H) in lean and heavy BMI-discordant twins (BMI difference > 3 kg/m2; n = 52).
I, SAT total PARP activity assay (n = 22), Wilcoxon signed-rank test for trend (A–I). J, SIRT1 mRNA from affymetrix by SIRT1 mRNA from RT-PCR. SIRT1–3, sirtuin 1–3; NAMPT, nicotinamide phosphoribosyltransferase; NMNAT1–3, nicotinamidemononucleotide adenylyltransferase 1–3; NRK1, nicotinamide riboside kinase 1.
Correlation of SIRT and NAD+ biosynthesis gene expression with clinical and selected Affymetrix expression parameters
To analyze how SIRTs down-regulated in the heavier co-twins correlate with the clinical and expression parameters, we calculated partial correlations separately in the individual level and for within-pair differences, adjusting for age and sex in both cases. When correlating the magnitudes of within-pair differences in two variables in MZ twins, the correlation of the variables presents an association that must result from environmental differences between co-twins thus excluding possible genetic or shared early environmental confounding factors. In the individual twins, SIRT1 expression was significantly negatively correlated with all the following adiposity variables: BMI, body fat percentage, SAT volume, intra-abdominal fat volume, liver fat percentage, plasma leptin, and average adipocyte diameter (Figure 1). Within-pair differences in these adiposity variables correlated similarly with SIRT1 as in the individual level. SIRT3 was negatively correlated with BMI, body fat percentage, SAT volume, and intra-abdominal fat volume in individual and within-pair analyses. In addition, SIRT5 was negatively correlated with all of the adiposity variables in individual twins, but only with plasma leptin within pairs. Similarly, NAD+ biosynthesis genes were negatively correlated with adiposity variables in individuals, except for NMNAT1 (Figure 2). Within pairs, NAMPT, NMNAT3, and NRK1 were correlated with most adiposity variables.
As SIRTs are linked to the regulation of insulin sensitivity and glucose metabolism, we went on to examine the correlations of SIRTs with insulin sensitivity during oral glucose tolerance test, as well as with SAT insulin signaling cascade gene expression. SIRT1 was significantly positively correlated with Matsuda index and insulin-signaling genes (INSR, IRS1, and IRS2) and negatively with HOMA-IR in individuals. Within pairs SIRT1 was positively correlated with INSR and IRS2 expression, and negatively with HOMA-IR (Figure 1). SIRT3 was positively correlated with measures of insulin sensitivity in individuals, but not within pairs. SIRT5 was similarly associated with some of the insulin sensitivity variables such as HOMA-IR, INSR expression, and IRS2 expression in individuals and within pairs. Within pairs adiponectin gene (ADIPOQ) expression in SAT and plasma adiponectin levels correlated only with SIRT5 expression. NAD+ biosynthesis genes, apart from NMNAT1, were correlated negatively with HOMA-IR and positively with Matsuda index, INSR expression and IRS2 expression in individuals, but within pairs only associations with INSR and IRS2 remained significant (Figure 2).
Of the SIRTs, SIRT1 has been shown to regulate inflammation and macrophage recruitment to SAT. We thus examined serum hs-CRP, adipose tissue CD14 (macrophage marker) expression, and five GO pathways depicting macrophage chemotaxis (GO: 0010759), macrophage activation (GO: 0002281), acute inflammatory response (GO: 0002675), neutrophil chemotaxis (GO: 0090023), and T-cell chemotaxis (GO: 0010820). All of the inflammatory markers were correlated negatively with SIRT1, SIRT3, and SIRT5 in individuals and with SIRT1 and SIRT5 within pairs (Figure 1). NAD+ biosynthesis genes, apart from NMNAT1, were negatively correlated with most of the inflammatory markers in individuals (Figure 2). Within pairs, only NMNAT2, NMNAT3, and NRK1 were significantly negatively correlated with inflammatory markers.
Expression of UPRmt-associated genes in SAT
Recently, SIRTs, especially SIRT1, have been implicated in promoting UPRmt, a mitochondrial proteostasis pathway. Therefore, we went on to examine the differential expression of a set of nine UPRmt-related genes in the BMI-discordant twin pairs (Figure 4). The expressions of DNA damage inducible transcript 3 (DDIT3, aka CHOP), heat shock 60 kDa protein 1 (HSPD1, aka HSP60), caseinolytic mitochondrial matrix peptidase proteolytic subunit (CLPP), and HtrA serine peptidase 2, (HTRA2) were significantly down-regulated in the heavier co-twins. There were no significant changes in the other five UPRmt genes analyzed. For correlations between the down-regulated UPRmt-associated genes and clinical parameters, see Supplemental Figure 2.
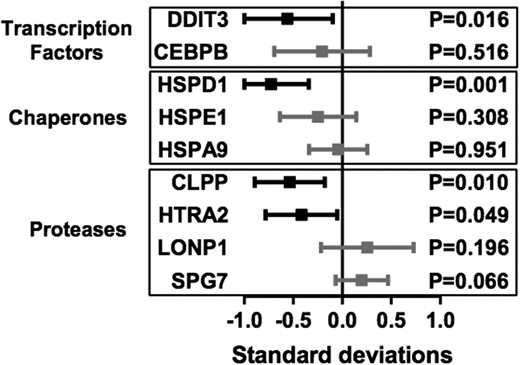
Differential expression of UPRmt-related genes in lean vs heavy discordant twins in SAT.
The boxes (mean within-pair differences) and bars (95% confidence intervals) present the differences in heavy compared with the lean co-twins in SDs of the gene's expression. P-values from pairwise t tests. DDIT3, DNA damage inducible transcript 3; CEBPB, CCAAT/enhancer-binding protein beta; HSPD1, heat shock 60 kDa protein 1; HSPE1, heat shock 10 kDa protein 1; HSPA9, heat shock 70 kDa protein 9; CLPP, caseinolytic mitochondrial matrix peptidase proteolytic subunit; HTRA2, HtrA serine peptidase 2; LONP1, Lon peptidase 1, mitochondrial; SPG7, spastic paraplegia 7.
Discussion
Our carefully phenotyped young adult MZ twin pairs discordant for BMI represent an ideal model to explore the metabolic effects of excess weight in SAT independent of genetic background. In this study, we integrated gene expression patterns of energy-sensing mechanisms, mitochondrial proteotoxic stress (UPRmt) and inflammatory responses in SAT to the clinical data on obesity-related metabolism. We discovered that SIRT1, SIRT3, and SIRT5 along with NAD+ biosynthesis genes were down-regulated in the heavier co-twins' SAT. Furthermore, we demonstrated that SAT SIRT1, SIRT3, NAMPT, NMNAT3, and NRK1 expressions correlated inversely with different measures of adiposity, SIRT1, SIRT5, NMNAT2, NMNAT3, and NRK1 inversely with inflammation in SAT, and SIRT1 and SIRT5 with whole-body insulin resistance, even after adjusting for genetic effects with the twin pairs. The SIRT1 downstream pathway, UPRmt, was also significantly down-regulated in the heavier co-twins' SAT. Our findings reveal for the first time that a decrease in SAT NAD+/SIRT pathway expression is associated with acquired obesity, insulin resistance, inflammation, and impaired mitochondrial protein homeostasis in SAT.
The evidence for a role for SIRTs in human obesity comes so far from studies showing an association between decreased SAT SIRT1 (24–26), SIRT3 (24), and SIRT6 (24) expression with obesity and type 2 diabetes. Here we extend these results by demonstrating in genetically identical, BMI-discordant MZ twins that acquired obesity is associated with reduced expression of SIRT1, SIRT3, and SIRT5 in SAT already before development of overt metabolic disease. These observed SIRT-related harmful alterations in SAT most likely reflect the influence of environmental factors not shared by these MZ twins, such as excessive calorie intake or sedentary behavior, which reduces transcription of SIRT1, SIRT3, and SIRT5, and NAD+ availability. We were not able to demonstrate differences in the food records between the co-twins, but based on our previous study using doubly-labeled water, the golden standard for energy consumption, obese co-twins seem to underreport dietary intake and overreport physical activity (27). Despite this tendency to overreport physical activity, heavier co-twins had significantly lower physical activity scores, which might partly explain the observed gene expression changes as exercise up-regulates at least the mRNA levels of SIRT1 and NAMPT (28). In addition, a high-fat diet is known to decrease the transcription of SIRTs, at least Sirt1 (29) and Sirt3 (30), and Nampt (31), and to induce PARPs (32), the main consumers of the intracellular NAD+ pool. In line with this, the expressions of several enzymes involved in NAD+ biosynthesis were significantly decreased in the heavier co-twins as previously observed for NAMPT in obese individuals by Pagano et al (33). In addition, there was a clear trend for total PARP activity to be higher in the heavier co-twins. Overall, our novel results in relatively healthy MZ twins suggest that the lowering of expressions of SAT SIRTs and NAD+ biosynthesis genes and induction of PARP activity are early changes in the metabolic of obesity. Therefore, even metabolically healthy obese subjects could benefit from lifestyle interventions but also pharmacological treatments increasing NAD+ levels (aka, NAD+ boosters) to maintain the sufficient cellular SIRT activity and to postpone the development of the metabolic syndrome.
The ability of Sirt1 overexpression or activation to prevent obesity via the induction of mitochondrial function, and thereby energy expenditure, is well established in animal models (7–11). Conversely, adipose tissue–specific SIRT1 deletion is known to promote body weight gain (34). In line with these animal studies, we observed significant negative correlations between SAT SIRT1 expression and all adiposity measures in our MZ twins. Notably, our correlations were stronger compared with previous studies on subjects with higher BMIs (24, 26). SIRT3 has also been suggested to protect from obesity by enhancing mitochondrial function and energy expenditure in mice (3). In line with this, we show that the negative correlation between SAT SIRT3 expression and adiposity, demonstrated by Moschen et al (24) in morbidly obese subjects, persists even after controlling for twin-shared factors. In total, our results strengthen the notion that the expressions of SIRT1 and SIRT3 are negatively correlated with different measures of adiposity, irrespective of genetic factors, and that SIRT1 and SIRT3 expressions are modified by environmental factors in humans.
SIRT1 is known to suppress inflammation (11). Conversely, deficits in SAT-specific Sirt1 expression lead to increased adipose tissue macrophage recruitment and inflammation (12). Furthermore, SAT Sirt1 expression has been noticed to correlate negatively with the levels of macrophage marker CD14 and macrophage chemoattractant CX3CL1 expression (12). Controlling for twin-shared factors, we confirm here the negative association of SIRT1 expression with multiple measures of adipose tissue inflammation. Interestingly, along with SIRT1, SIRT5 expression was also negatively correlated with multiple different inflammatory GO pathways, although the role of SIRT5 in inflammatory pathways is currently unknown. Both of the associations were weaker within pair, which suggests that at least a part of the association is confounded by genetic or early environmental factors. Nevertheless, the reduced SIRT expression in SAT may, at least partly, explain the inflammation observed in obesity.
SIRT1 has been suggested to act as an insulin sensitizer based on several animal studies (6, 7) and a few human studies (35, 36). In addition, SAT SIRT1 expression has been shown to correlate positively with insulin sensitivity during a hyperinsulinemic-euglycemic clamp in humans (36). We extend these findings by showing that after controlling for confounders, SAT SIRT1 expression was correlated negatively with HOMA-IR and positively with the Matsuda index and the expression of insulin-signaling cascade genes INSR and IRS2 in SAT. However, contrary to earlier findings (24, 26), ADIPOQ expression was not correlated with SAT SIRT1 expression in individuals or within-pair in our study. Interestingly, SIRT5 was also associated with measures of insulin sensitivity in within-pair analyses. Given that the role of SIRT5 in regulation of insulin sensitivity is unclear, the biological significance of this finding remains to be elucidated. In summary, our findings underline the role of SIRT1 in the regulation of insulin sensitivity in humans.
UPRmt is a recently discovered downstream pathway for the NAD+/SIRT axis that promotes mitochondrial protein homeostasis against proteotoxic stress (13). Known factors stimulating the UPRmt are mitochondrial stressors inducing a mitonuclear protein imbalance, the disruption of the stoichiometric balance between nuclear and mitochondrially encoded proteins, and a change in protein-folding workload during mitochondrial biogenesis (37). The significance of UPRmt in mammals is still unclear but two studies have demonstrated the existence of this stress response pathway in mouse (38) and human (39) muscle tissue. In our study, the expression of multiple UPRmt-associated genes was decreased in the SAT of heavier BMI-discordant co-twins. We have previously demonstrated in the same twins that multiple markers of mitochondrial biogenesis (mtDNA copy number, respiratory chain gene expression, and protein levels) are reduced in the heavier co-twins without a sign of mitonuclear protein imbalance (1). Therefore, abnormalities in protein-folding workload during impaired mitochondrial biogenesis accompanied with reduced NAD+/SIRT1 pathway activity might reduce UPRmt activity in obesity. Our novel findings suggest that acquired obesity is associated with an impaired UPRmt response in human SAT, which may lead to abnormalities in mitochondrial protein homeostasis.
To conclude, in this study, we show that acquired obesity is linked to decreased expression of SIRT1, SIRT3, and NAMPT, and tendency for an increase in total PARP activity in young adult individuals with increased adiposity compared with their leaner genetically identical siblings. This suggests that the NAD+/SIRT pathway activity is suppressed and total PARP activity induced in human SAT due to acquired obesity, but an opposite causal direction cannot be excluded. Also, we show that the expression of multiple UPRmt-associated genes in SAT is down-regulated in heavier co-twins, possibly as a result of impaired NAD+/SIRT pathway activity. Following this, NAD+ boosters might be tooled to prevent harmful alterations in metabolism associated with obesity, prior the development of the metabolic syndrome.
Acknowledgments
We thank the participants for their invaluable contributions to the study. Mia Urjansson is warmly thanked for excellent technical assistance. M. Turunen, Helsinki University Central Hospital, and L. Mustelin, University of Helsinki, are acknowledged for their help in the collection of the data. R. J. Rose, University of Indiana, is thanked for contributing to funding of FinnTwin16 and FinnTwin12. We also thank E. Moilanen from The Immunopharmacology Research Group at the University of Tampere School of Medicine and Tampere University Hospital for the adiponectin and leptin assays.
Disclosure Summary: The authors have nothing to disclose.
Abbreviations
- AUC
area under the curve
- BMI
body mass index
- GO
Gene Ontology
- HOMA-IR
homeostasis model of assessment–insulin resistance
- MZ
monozygotic
- NAMPT
nicotinamide phosphoribosyltransferase
- NMN
nicotinamide mononucleotide
- PARP
(poly-ADP) ribose polymerase
- SAT
subcutaneous adipose tissue
- SIRT
sirtuin
- UPRmt
mitochondrial unfolded protein response.
