


Left ventricular hypertrophy (LVH) and myocardial fibrosis are considered common findings of the acromegaly cardiomyopathy in echocardiography studies.
To evaluate the frequency of LVH, systolic dysfunction and myocardial fibrosis was undertaken in patients with acromegaly using cardiac magnetic resonance imaging (CMRi) before and after 12 months of octreotide long-acting repeatable treatment.
Consecutive patients with active acromegaly submitted to biochemical analysis and CMRi before and after 12 months of treatment. Additionally, echocardiography was performed before treatment.
Forty consecutive patients were evaluated using CMRi at baseline and 30 patients were reevaluated after 12 months of treatment. Additionally, 29 of these patients were submitted to echocardiography. Using CMRi, the frequency of LVH was 5%. The mean left ventricular mass index (LVMi) was 61.73 ± 18.8 g/m2. The mean left ventricular ejection fraction (LVEF) was 61.85 ± 9.2%, and all patients had normal systolic function. Late gadolinium enhancement was present in five patients (13.5%), and one patient (3.5%) had an increased extracellular volume. After treatment, 12 patients (40%) had criteria for disease control. No clinically relevant differences in cardiac variables before and after treatment were observed. Additionally, there was no difference in LVMi and LVEF among patients with and without disease control. Using echocardiography, 31% of the patients had LVH, mean LVMi was 117.8 ± 46.3 g/m2 and mean LVEF was 67.3 ± 4.4%. All patients had normal systolic function.
We demonstrated by CMRi, the gold-standard method, that patients with active acromegaly might have a lower prevalence of cardiac abnormalities than previously reported.
Patients with acromegaly are exposed to cardiovascular risk factors such as arterial hypertension, diabetes mellitus (DM) and hypertriglyceridemia (1). Some studies have described that acromegaly per se may cause a number of cardiac abnormalities characterized mainly by left ventricular (LV) hypertrophy (LVH) (2, 3).
The prevalence of LVH evaluated by echocardiography in patients with acromegaly varies greatly, ranging from 25–85% in different series (2–5). Myocardial fibrosis is considered another common histological abnormality (53.7%) (6). Some reports have described that LVH and cardiac function may improve, particularly in young patients with short disease duration, by suppression of GH and IGF-I during acromegaly treatment (7, 8).
Cardiac magnetic resonance imaging (CMRi) is the established noninvasive gold standard method for measuring LV volume, cardiac function, and LV mass (LVM) due to its higher accuracy and reproducibility and lower variability in comparison with echocardiography (9, 10). To date, few studies evaluating small cohorts have analyzed patients with acromegaly using CMRi (5, 8, 11). Bogazzi et al (5) found a higher prevalence of LVH by CMRi (72%) than by echocardiography (36%) and an improvement in LVM in most patients who were treated with somatostatin analogues, which was more evident if the disease was controlled (8).
Another described feature of the acromegaly cardiomyopathy, myocardial fibrosis, has only been evaluated by CMRi in one study with a small sample, but no signs of cardiac fibrosis were found (5). However, to date, no study has used the myocardial T1 mapping to detect changes in the extracellular volume (ECV) fraction, a marker of diffuse interstitial fibrosis.
The aim of this study was to determine the frequency of structural and functional cardiac alterations in patients with acromegaly using CMRi before and after 12 months of octreotide long-acting repeatable (LAR) treatment. Additionally, the same features were evaluated by echocardiography at baseline.
Patients and Methods
Study population
Consecutive patients with acromegaly were recruited from the outpatient endocrinology clinic of the Hospital Universitário Clementino Fraga Filho-Universidade Federal do Rio de Janeiro from November 2011 until December 2014. The study was approved by the Ethics Committee of the Hospital Universitário Clementino Fraga Filho-Universidade Federal do Rio de Janeiro and all patients signed written informed consent forms.
Diagnosis of acromegaly was made according to current criteria (12). The presumed duration of acromegaly was assessed by comparing photographs taken over a period of 5–20 years and by interviews.
Inclusion criteria were patients older than age18 years with medically naive active acromegaly. Exclusion criteria were history of myocardial infarction, previous radiotherapy, surgery within less than 3 months, acute and chronic renal failure, metallic implants, or claustrophobia.
Study design
This was a prospective, single-center study. Eligible patients started treatment with octreotide- LAR 20 or 30 mg every 4 weeks. Dosage was increased to 30 mg after 3 months, if necessary to achieve acromegaly control. Patients were evaluated at enrollment, before medical treatment, and after 12 months of treatment. Acromegaly was considered controlled if basal GH was lower than 1 ng/mL and IGF-I was normal for age after 12 months of treatment (12).
Clinical and biochemical variables
The following clinical and biochemical variables were evaluated before and after 12 months of octreotide-LAR therapy.
Body mass index was calculated using the formula weight (kg) divided by height squared (m2) (13), body surface area (BSA) was calculated according to the Mosteller formula (14), and systolic and diastolic blood pressures (BP) were measured in millimeters of mercury (mm Hg). Arterial hypertension was defined as systolic BP higher than 140 mm Hg and/or diastolic BP higher than 90 mm Hg or as treatment of previously diagnosed arterial hypertension (15). Additionally, heart rate was measured in beats per minute.
Patients were classified as cigarette smokers (individuals who smokes at least one cigarette per day for not less than 6 months) or nonsmokers (16). They were classified according to ethnicity as white or nonwhite.
DM was diagnosed according to American Diabetes Association recommendations or if treatment of previously diagnosed DM was documented (17). Hypercholesterolemia was defined according to the National Cholesterol Education Program Adult Treatment Panel III guidelines or if the patients had been prescribed drugs to treat dyslipidemia (18).
Hormone assays
Plasma GH levels were measured by a chemiluminescence assay kit (IMMULITE 2000; DPC Inc.). The inter- and intra-assay coefficients of variation were 6.0 and 5.8%, respectively. The International Reference Preparation for GH was the 98/574. Plasma IGF-I levels were measured by a chemiluminescence assay kit (IMMULITE 2000; DPC). The inter- and intra-assay coefficients of variation were 3.6 and 6.6%, respectively. The International Reference Preparation for IGF-I was the 87/518. IGF-I level was expressed as percentage of the upper limit of normal range.
All plasma samples were collected in the early morning after a 12-h fasting period before and after 12 months of octreotide-LAR treatment.
Cardiac evaluation
CMRi acquisition and interpretation
A whole-body 3.0-T scanner was used (MAGNETOM Verio, Siemens AG) with an eight-element body coil and fast parallel acquisition. The CMRi was performed at baseline and after 12 months of treatment.
Ventricular volumes measurements
Cine imaging using retrospective electrocardiography gating with segmented steady-state free precession (SSFP) readout during a breath hold was done. Standard imaging included a short axis stack of cine SSFP images from cardiac base to apex. Typical scan variables included field of view = 32–38 cm, matrix of 256 × 208, slice thickness = 6 mm, gap = 4 mm, GRAPPA acceleration factor of 2, with 12 segments per RR interval (temporal resolution of 38 msec), resulting in approximately 8–10 heart beats per breath-hold.
All analyses were blindly performed in a dedicated offline workstation (CMR42, Circle Cardiovascular Imaging). The LVM, LV end-diastolic volume (LVEDV), LV end-systolic volume (LVESV), LV stroke volume (LVSV), LV ejection fraction (LVEF; stroke volume divided by end-diastolic volume), and interventricular septum thickness (IVST) were determined. All CMRi data except LVEF and IVST were indexed (i) to BSA. Two independent observers read the baseline measurements in a blinded manner.
The international normal values (19) were validated in the Brazilian population (20) and are as follows: LVMi, men: 57–91 g/m2; women, 48–78 g/m2; LVEDVi, men: 62–98 ml/m2, women: 58–92 mL/m2; LVESVi, men: 16–38 ml/m2; women, 15–33 ml/m2; LVSVi, men 41–66 ml/m2; women, 38–62 ml/m2; LVEF greater than 55%; and IVST, 0.7–1.1 cm.
Delayed myocardial enhancement
Late gadolinium enhancement (LGE) was performed approximately 7–10 minutes after an IV injection of 0.15 mmol/kg of a gadolinium chelate infusion (gadoteric acid), using a standard segmented inversion-recovery spoiled gradient echo sequence with careful inversion time (TI) adjustment for null the myocardium. Typical acquisition variables were as follows: matrix 240 × 192; slice thickness, 8 mm; gap, 2 mm; 14 segment views; and TI, 280–320 msec with phase-sensitive reconstruction images on short and long axis of the left ventricle. LGE was considered positive when hyperenhancement was observed in at least two different views, was confirmed by phase-sensitive reconstruction images, and was considered not an artifact by the reader (21).
Myocardial T1 mapping and extracellular volume quantification
T1 maps were acquired before and after 15 min postinjection of 0.15 mmol/kg of gadoteric acid at a midventricular short-axis plane. For T1 quantification, the conventional Modified Look-Locker inversion recovery sequence was used as previously described (22). Briefly, it consisted of a single breath-hold protocol of three inversion recovery episodes with 3-3-5 (3 inversion pulses with collection of 3 beats in the first 2 pulses and the last 5 beats) acquisition heartbeats and three recovery heartbeats between inversions. Further acquisition variables were initial TI, 100 msec; TI increment, 80 msec; acquisition matrix, 192 × 124; GRAPPA acceleration factor, 2; flip angle, 35º; slice thickness, 8 mm; field of view, 330–380 mm; and SSFP readout with Cartesian k-space filling. The computer immediately postprocesses the images by first applying a motion correction algorithm; then, a pixel-wise myocardial map is generated using unsupervised curve-fitting producing a final colored image where pixel signal intensity is its measured relaxation time.
All images were considered to have diagnostic quality and were analyzed in a blinded fashion using multiplatform commercial software (CMR42). Regions of interest were placed covering most of the mid-interventricular septum, and at blood pool, carefully avoiding papillary muscles.
The precontrast myocardial T1 and postcontrast myocardial T1 maps before and after treatment are demonstrated in Supplemental Tables 1 and 2.
Blood samples for determination of hematocrit were taken 24 h before the scan. The ECV was considered normal at 25 ± 5% and was calculated according to previous work (23).
Two-dimensional conventional and Doppler echocardiography
Echocardiography data were obtained using Vivid and ultrasound scanners (General Electric) with 2.5-MHz transducer. Patients were scanned in a left decubitus position from the parasternal and apical window. Heart cavity dimensions and EF were documented by M-mode, according to current recommendations (24). All echocardiography examinations were done only at baseline by the same operator.
LV mass was calculated by the modified Devereux formula: 1.04 (IVST + PWT + LVEDD)3 − (LVEDD)3 + 14 g, where PWT and LVEDD correspond to measurements of posterior wall thickness and LV diameter in the diastolic state. LVMi was determined after correcting LVM by BSA. LVH was defined when LVMi was higher than 135 g/m2 for men and higher than 110 g/m2 for women (25). LV systolic dysfunction was defined when EF was lower than 55%. LV diastolic dysfunction was defined when early/to late or atrial peak velocities was at least 1 for patients younger than age 50 years or 0.5 for patients at least 50 years of age (26).
Statistical analysis
Statistical analyses were performed using SPSS 20.0 for MacOS (SPSS Inc.). The Kolmogorov–Smirnov test was performed to analyze the distribution pattern of numerical variables. Categorical variables were expressed as percentage and frequency, and numerical variables were expressed as mean ± sd. Student's t test or the Mann-Whitney U test was performed to compare numerical variables between the two groups. Correlations between numerical variables were analyzed using Pearson's correlation test or Spearman test, as appropriate. Difference between variables before and after somatostatin analogue therapy was evaluated by paired Student's t test or Wilcoxon test, as appropriate. The post hoc probability of an error type II was calculated considering the frequency of LVH in the literature, the one found in the current study and the number of patients included, with an α of 0.05. P value < .05 was considered significant.
Results
Forty patients with acromegaly (18 women; mean age, 44.5 ± 13.6 years) were enrolled in the study. Twenty-eight patients with persistent disease activity following surgery started adjuvant medical therapy with octreotide-LAR. Four patients refused to undergo surgery and eight had tumors with significant parasellar extension and were treated with octreotide-LAR as the primary therapy.
Thirty patients completed 12 months of treatment. Ten discontinued the study: six dropped out after the first scan, one died from a hepatic abscess, and three were lost to follow-up.
Characterization of the study population before treatment with octreotide-LAR
Clinical, biochemical, and imaging characteristics
The main clinical and biochemical characteristics of the patients with acromegaly before treatment are presented in Table 1.
Clinical and Biochemical Features of Patients With Acromegaly Before Treatment With Octreotide LAR (n = 40)
| Age (year) | 44.5 ± 13.6 |
|---|---|
| Sex (female/male, n) | 18/22 |
| BMI (kg/m2) | 30.4 ± 4.6 |
| Heart rate (beat/min) | 78.2 ± 8.6 |
| GH (ng/ml) | 9.9 ± 13.6 |
| IGF-I (% ULNR) | 298 ± 120 |
| Disease duration (year) | 7.9 ± 4.3 |
| Arterial hypertension (%) | 55 |
| Glucose (mg/dl) | 109.3 ± 64.5 |
| HbA1c (%) | 6.3 ± 2.0 |
| Diabetes mellitus (%) | 25 |
| Total cholesterol (mg/dl) | 183.1 ± 39.3 |
| HDLc (mg/dl) | 47.2 ± 13.7 |
| LDLc (mg/dl) | 114.1 ± 29.6 |
| Triglycerides (mg/dl) | 118.8 ± 60.78 |
| Hypercholesterolemia (%) | 23 |
| Smoking habit (%) | 10 |
Value are presented as mean ± sd.
Abbreviations: BMI, body mass index; HbA1c, glycosylated hemoglobin; HDLc; high-density lipoprotein-cholesterol; LDLc, low-density lipoprotein-cholesterol; ULNR, upper limit of normal range.
All patients with arterial hypertension were treated with only one or two antihypertensive drugs (angiotensin receptors antagonists, β-blockers, or diuretics). Thirty-one patients were classified as white and nine as nonwhite. Five patients with central hypothyroidism and five with central adrenal deficiency were on adequate replacement therapy. There were only six patients with hypogonadism (four women/two men). Three women were in menopause (73, 70, and 62 years old); the other three patients were receiving adequate sex hormone replacement. Twenty-nine patients were diagnosed with a macroadenoma (73%).
CMRi
The CMRi variables of the patients with acromegaly are shown in Table 2. The correlations regarding numerical baseline variables between the two observers were: LVMi (r = 0.947; P < .0001), LVEDV (r = 0.984; P < .0001); LVESV (r = 0.971; P < .0001); LVSV (r = 0.908; P < .0001), and LVEF (r = 0.883; P < .0001). Mean LVMi in the whole group was 61.7 ± 18.8 g/m2. Two patients (5%) had LVH. One patient with LVH had arterial hypertension. Mean LVMi was not significantly different in patients with or without arterial hypertension and between different ethnical groups. Seven patients (17.5%) had IVST greater than 1.1 cm. LVMi was correlated with IVST (r = 0.639; P = .001). Mean LVEF in the whole group was 61.8 ± 9.2%, and all patients had normal ventricular systolic function. LVMi and LVEF values were not correlated to the estimated duration of disease, GH, or IGF-I levels. Examples of CMRi in patients with and without LVH are shown in Figure 1. The post hoc power considering an alpha of 0.05 and the expected frequency of 40% of LVH (according to previous studies using echocardiography) and the frequency of 5% found in the present study, resulted in 100% power with our sample size.
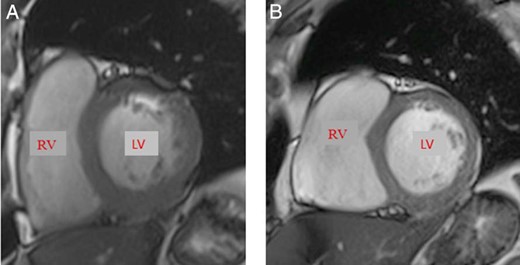
Cardiac magnetic resonance.
The two images represent cardiac short axes at the end of diastole. (A) The left ventricular (LV) mass index in a 52-year-old man with acromegaly and LV hypertrophy was 107.1 g/m2. (B) The LV mass index in a 48-year-old man with acromegaly without LV hypertrophy was 67 g/m2. Normal range (male), 57–91 g/m2.
Cardiac Magnetic Resonance Parameters in Patients With Acromegaly (Male/Female/Whole Group) Before Treatment With Octreotide LAR
| Parameter | Male (n = 22) | Female (n = 18) | Whole Group (n = 40) | Normal Values |
|---|---|---|---|---|
| LVM (g) | 153.9 ± 36.6 | 94.9 ± 24.3 | 127.1 ± 43.0 | Male: 106–186 Female: 72–144 |
| LVMi (g/m2) | 71.8 ± 19.8 | 49.4 ± 11.3 | 61.7 ± 18.8 | Male: 57–91 Female: 48–78 |
| LV hypertrophy (yes/no)/(%) | 2/20 (9%) | 0/18 (0%) | 2 (5%) | a |
| IVST (cm) | 1.01 ± 0.18 | 0.92 ± 0.15 | 0.97 ± 0.17 | 0.7–1.1 |
| Increased IVST (yes/no)/% | 5/20 (23%) | 2/16 (11%) | 7/40 (17.5%) | a |
| LVEDVi (ml/m2) | 86.0 ± 26.6 | 66.2 ± 14.8 | 77.0 ± 23.9 | Male: 62–98 Female: 58–92 |
| LVESVi (ml/m2) | 37.0 ± 18.7 | 23.5 ± 7.8 | 30.9 ± 16.1 | Male: 16–38 Female: 15–33 |
| LVSVi (ml/m2) | 49.1 ± 10.3 | 42.7 ± 10.7 | 46.2 ± 10.8 | Male: 41–66 Female: 38–62 |
| LVEF (%) | 59.5 ± 9.4 | 64.7 ± 8.5 | 61.8 ± 9.2 | >55% |
| Late gadolinium enhancement (yes/no)/(%) | 4/18 (22%) | 1/17 (5%) | 5/32 (13.5%)b | a |
| Extracellular volume fraction (%) | 25.2 ± 3.0 | 26.7 ± 1.8 | 25.9 ± 2.6 | 20–30 |
| Increased extracellular volume fraction (yes/no)/(%) | 0/13 (0%) | 1/14 (7%) | 1/27 (3.5%)c | a |
IVST, interventricular septum thickness; LVEDVi, left ventricular end-diastolic volume index; LVEF, left ventricular ejection fraction; LVESVi, left ventricular end-systolic volume index; LVM, left ventricular mass; LVMi, left ventricular mass index; LVSVi, left ventricular stroke volume index.
Statistical analyses for these parameters were not performed because of small sample size.
Left ventricular delayed hyperenhancement was analyzed in 37 patients.
Extracellular volume fraction was analyzed in 28 patients.
Values are presented as mean ± sd and frequency (%).
Five patients (13.5%) had LGE. One patient had an extensive hyperenhancement with a “nonischemic” mesocardial distribution in seven LV segments and another had a transmural inferolateral LGE, suggestive of myocardial infarction. The remaining three patients presented small areas of mesocardial LGE. Images of two patients with acromegaly and LGE are shown in Figure 2. Additionally, T1 mapping was possible in 28 patients; only one (3.5%) had an abnormal ECV of 31.5%. Images of this patient are shown in Figure 3. The patients with myocardial fibrosis did not have LVH.
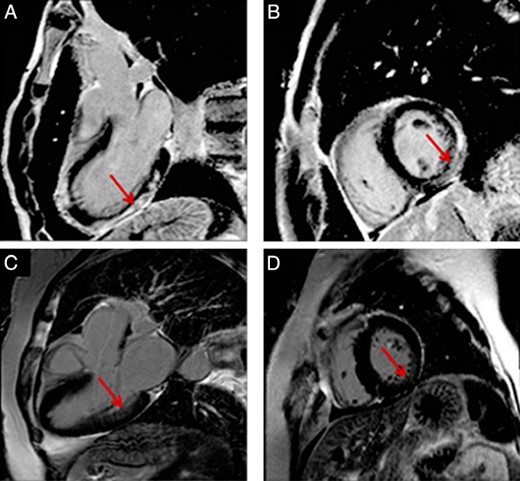
Cardiac magnetic resonance.
These images represent cardiac long (A, C) and short (B, D) axes. (A, B) An extensive subepicardial and mesoepicardial late gadolinium enhancement (red arrow) in 20-year-old man affecting more than four walls. (C, D) A mesocardiac mild late gadolinium enhancement in a 56-year-old woman (red arrow).
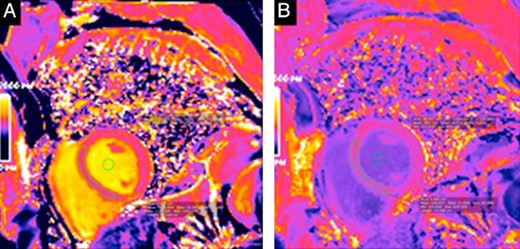
T1 mapping in a 48-year-old man.
The T1 map for this patient was calculated precontrast (A) and postcontrast (B). This patient had an abnormal extracellular volume fraction of 31.3%.
Two-dimensional conventional and Doppler echocardiography
Echocardiography was performed in 29 patients. Mean LVMi in the whole group was 117.8 ± 46.3 g/m2. Nine patients (31%) had LVH. Distribution of LVH was not different in patients with or without arterial hypertension or between ethnical groups. Mean IVST was 1.0 ± 0.16 cm. Diastolic function was mildly impaired in 12 patients (41%). Mean LVEF was 67.3 ± 4.4%. All patients had normal LVSF. LVMi or LVEF values were not correlated to the estimated duration of disease, GH, or IGF-I levels.
Correlations between CMRi and echocardiography before treatment
LVMi evaluated by CMRi was related to those evaluated by echocardiography (r = 0.48; P = .008). However, two patients had increased LVMi at CMRi (2/40) and nine had increased LVMi at echocardiography (9/29). The two patients with increased LVMi at CMRi also had increased LVMi at echocardiography. Interventricular septum thickness evaluated by CMRi was related to those evaluated by echocardiography (r = 0.46; P = .03).
Characterization of the study population after 12 months of octreotide-LAR treatment
Thirty patients were regularly treated with octreotide-LAR for 12 months, with 12 patients achieving disease control (40%). A comparison of CMRi variables before and after treatment with octreotide-LAR in these patients is shown in Table 3.
Cardiac Magnetic Resonance Parameters of Patients With Acromegaly Before and After 12 Months of Treatment With Octreotide LAR
| Parameter | Acromegaly Before Treatment (n = 30) | Acromegaly After Treatment (n = 30) | P |
|---|---|---|---|
| LVM (g) | 126.6 ± 45.4 | 123.0 ± 41.3 | .441 |
| LVMi (g/m2) | 61.5 ± 19.5 | 59.6 ± 17.2 | .389 |
| LV hypertrophy (yes/no) | 2/28 (7.5%) | 1/29 (3.5%) | a |
| IVST | 0.99 ± 0.14 | 0.98 ± 0.15 | .316 |
| Increased IVST (yes/no)/(%) | 5/25 (17%) | 5/25 (17%) | a |
| LVEDVi (mL/m2) | 77.2 ± 25.5 | 75.3 ± 23.4 | .576 |
| LVESVi (mL/m2) | 31.2 ± 17.3 | 27.0 ± 12.0 | .042 |
| LVSVi (mL/m2) | 46.2 ± 11.1 | 47.9 ± 14 | .372 |
| LVEF (%) | 61.7 ± 9.0 | 65.41 ± 9.4 | .010 |
| Late gadolinium enhancement (yes/no) (%) | 4/26 (13.5%) | 4/26 (13.5%) | a |
| Extracellular volume fraction (%) | 26.1 ± 2.6 | 27.5 ± 8.0 | .50 |
| Extracellular volume fraction (yes/no)/(%) | 1/17 (5.5%)b | 4/14 (22.5%)b | a |
IVST, interventricular septum thickness; LVEDVi, left ventricular end-diastolic volume index; LVEF, left ventricular ejection fraction; LVESVi, left ventricular end-systolic volume index; LVM, left ventricular mass; LVMi, left ventricular mass index; LVSVi, left ventricular stroke volume index.
A statistical analysis for these parameters was not performed due to small sample size.
Extracellular volume fraction was analyzed in only 18 patients before and after treatment. Values are presented as mean ± sd and frequency (%).
Boldface text indicates P < .05.
Mean LVM and LVMi did not significantly decrease after treatment. However, only one patient remained with LVH. All patients that had IVST >1.1 cm persisted with this alteration. Although mean LVESVi decreased and LVEF increased after treatment, the mean values were in the normal range. Regarding myocardial fibrosis, there were no differences in LGE before and after treatment and three additional patients present ECV greater than 30% after treatment. There was no difference in LVMi and LVEF among patients with and without controlled disease. Additionally, the 12 patients with acromegaly and controlled disease did not have differences in CMRi variables before and after octreotide-LAR treatment.
Discussion
We found a lower frequency of LVH and myocardial fibrosis by CMRi in our patients with acromegaly than previously described in literature and no systolic dysfunction (5, 8). To date, this study has the highest number of patients using CMRi in acromegaly disease and is the first to evaluate the presence of interstitial myocardial fibrosis with the T1 mapping. The data revealed that morphological and functions changes in the heart of patients with acromegaly may be less prevalent than have been reported.
Myocardial fibrosis and LVH have been considered common findings of the acromegaly cardiomyopathy according to a previous autopsy study (27). However, this study evaluated patients who died with severe acromegaly in a period when diagnosis and treatment of acromegaly and its comorbidities were limited. In addition, studies that evaluated LVH using echocardiography demonstrated a prevalence of LVH ranging from 25 to 85% in acromegaly (2–5).
Few studies used the gold standard CMRi for the evaluation of patients with acromegaly (5, 8, 11). The results of our study demonstrated a low frequency of LVH, being present in only 5% of patients with acromegaly and active disease. Ours results are in contrast with those of Bogazzi et al (5, 8), who, in a sample size of 14 patients, demonstrated a frequency of LVH of 72%. However, they used a different cutoff to define LVH (28). If Bogazzi et al had used the cutoff that we used in the present study, the frequency of LVH would have been 14%, which is close to the frequency found by our group (19, 20). We chose this cutoff because these values were obtained through CMRi in an asymptomatic Brazilian population (20) and are similar to the results described by Maceira et al (19) in an asymptomatic England population.
We found a lower frequency of LVH detected by CMRi (5%) compared with the results using echocardiography (31%) in the same cohort and also in comparison with a previous study from our group using echocardiography (57.5%) (2). Importantly, echocardiography in both studies was performed by the same experienced operator. Thus, the frequency of LVH in our current series by echocardiography is similar from that reported in the literature, indicating that our cohort may not be different from previous series in the literature (also reinforced by the similar proportion of arterial hypertension, DM, age, and disease duration) (3–5); therefore, the selection of a less severe acromegaly population is probably not the cause for the low frequency of LVH by CMRi. A possible explanation for this discrepancy is how LVH is evaluated by these two methods. CMRi is considered the gold standard for evaluating LVM because it has a high accuracy and reproducibility resulting from geometric assumption-free quantification (9). Therefore, LVM measurement by CMRi has been in excellent agreement with the assessment by autopsy (29). Indeed, echocardiography can overestimate or underestimate the measurement of the LVM, especially in patients with hypertension or cardiomyopathy (30, 31). LVM evaluation by echocardiography is based on the M-mode and is calculated by a cubing formula, assuming that the left ventricle is represented by a prolate ellipse (32). Thus, small errors are amplified to the third power (32). Therefore, these differences in the accuracy of the methods can explain the discrepancy between the frequencies of LVH with the two methods.
Mean LVM was not different in patients with or without arterial hypertension. This result is different from most of the studies that correlated LVH with arterial hypertension (2, 3). Notably, our group was comprised by well-controlled mildly to moderately hypertensive patients, which is the typical pattern of hypertension in acromegaly. In line with this, Bogazzi et al (5), using CMRi, did not find a difference in LVH between patients with or without arterial hypertension. However, it is important to emphasize that in our series, only two patients were classified as presenting with LVH by CMRi.
The results of our group demonstrated no alteration of systolic cardiac function. In fact, all patients had preserved ventricular systolic function. These data are in accordance with literature that describes acromegaly as a rare cause of congestive heart failure (1).
LGE was present in 13.5% of our patients, and 3.5% had ECV greater than 25 ± 5%, indicating the presence of myocardial fibrosis. CMRi with LGE is a technique that allows direct visualization of myocardial fibrosis (21). Moreover, myocardial T1 mapping and ECV are recent techniques in CMRi that permit the acquisition of quantitative measurement of myocardial and blood T1. Extracellular volume of the myocardium measures the volume fraction of heart tissue that is not taken by cells and reflects interstitial fibrosis or it can be filled by water, so both would potentially increase the ECV (33). CMRi T1 measurement has also been strongly correlated with myocardial fibrosis by histological assessment of collagen content (23). Also, some evidence suggests that total body water content is increased in acromegaly (34), but the fact we did not find any evidence of ECV expansion in our patients might be because the myocardial T1 mapping and ECV are not sensitive enough. We found a low frequency of myocardial fibrosis in acromegaly independently of the methodology applied. Our results are similar with those found in an epidemiology study in a multiethnic healthy population, which reported a visible myocardial LGE in 9.2% of patients (35). Additionally, Bogazzi et al (5) did not find myocardial fibrosis in patients with acromegaly using CMRi. However, our results are not in line with a study reported by the same group that demonstrated an increase in cardiac fibrosis in active acromegaly, with a prevalence of 53.7%, using ultrasonic cardiac tissue characterization (6).
Our patients were treated for 12 months with octreotide-LAR and; the end of the follow-up, 40% had controlled acromegaly, similar to other series in the literature (36). We did not find clinically relevant differences in morphological and functional cardiac variables evaluated after treatment. The most probably explanation for this is that our cohort exhibited hearts without major structural and function alterations at baseline.
Although we did not study mortality associated with acromegaly, our data demonstrating low major morphological and functional cardiac changes in patients with acromegaly corroborate recent studies in the literature, showing that cardiovascular disease is no longer the main cause of death in these patients (37, 38). This paradigm shift in the frequency of acromegaly cardiomyopathy and in the main cause of mortality are intriguing; we speculate that this shift could be a consequence of the advances in the treatment of acromegaly comorbidities because acromegaly is associated with a high prevalence of arterial hypertension and diabetes, and both are associated with cardiac disease. Probably the more strict criteria for the diagnosis of these comorbidities (39, 40), as well as the availability of better treatment options, affect the severity of cardiac involvement in patients with acromegaly who are recently diagnosed.
In conclusion, our results, obtained with CMRi, suggest a lower frequency of acromegaly cardiomyopathy than previously reported.
Acknowledgments
Disclosure Summary: L.K. has received lecture fee from Novartis and M.R.G. has received unrestricted research grants from Novartis and Pfizer, served as a principal investigator for Novartis and Ipsen clinical trials, served on advisory boards for Novartis, and received lecture fees from Novartis, Ipsen, and Pfizer. All other authors have nothing to disclosure.
Abbreviations
- BSA
body surface area
- CMRi
cardiac magnetic resonance imaging
- DM
diabetes mellitus
- ECV
extracellular volume
- i
index
- IVST
interventricular septum thickness
- LAR
- LV
left ventricular
- LVH
left ventricular hypertrophy
- LVMi
left ventricular mass index
- LVEDV
left ventricular end-diastolic volume
- LVESV
left ventricular end-systolic volume
- LVSV
left ventricular stroke volume
- LVEF
left ventricular ejection fraction
- LGE
- SSFP
steady-state free precession
- TI
inversion time.
