


Idiopathic reactive hypoglycemia (IRH) is characterized by recurrent episodes of symptomatic hypoglycemia occurring within 4 hours after meals. The underlying mechanisms remain obscure.
This study aimed to investigate the response of the glucoregulatory and gastrointestinal hormones to an oral glucose load (OGTT) in individuals with documented IRH.
This was a cross-sectional study composed of outpatients referred to “Federico II” University of Naples.
We enrolled subjects with IRH documented by a mixed meal under ordinary life conditions and healthy subjects as controls.
We measured plasma glucose, insulin, glucagon-like peptide 1 (GLP-1), GIP, and glucagon response to a 75-g OGTT in cases and controls.
Ten IRH and eight control subjects were enrolled. During the OGTT, mean plasma glucose tended to be lower in IRH than in control subjects, reaching a statistically significant difference at 240 minutes (T240) (43 ±1.6 vs 72 ± 0.3 mg/dL; P = .001). Accordingly, the insulin response was higher in IRH than in control subjects (P < .019) with a statistically significant difference (46%) at T90 (P = .045) and was associated with significantly lower glucagon levels in the late phase of the OGTT: at T120 (P = .031) and T180 (P = .048) in IRH than in control subjects. A greater GLP-1 response was found among IRH compared with control subjects (P = .005); GLP-1 peak was 2-fold higher in IRH individuals (9.77 ± 2.52 pmol/L) than in the control group (4.19 ± 0.53 pmol/L; P = .041). In the IRH group, GLP-1 peak inversely correlated with the nadir of plasma glucose (r = −0.66; P = .039). A multivariate analysis confirmed that GLP-1 peak independently predicted the plasma glucose nadir (β = −0.593; P = .026).
GLP-1 may play a significant role in the pathogenesis of idiopathic IRH.
Clinical hypoglycemia is a condition in which plasma glucose concentration is low enough to cause symptoms and/or signs (including impairment of brain function), usually occurring at a mean plasma glucose concentration of approximately 55 mg/dL (3.0 mmol/L) (1). From a pathophysiological point of view, hypoglycemia can result from an absolutely low rate of glucose production or from an imbalance between glucose production and glucose utilization (2, 3). Although hypoglycemia is a common complication in diabetic patients (4–7) it may also occur in nondiabetic patients and it may represent a diagnostic challenge for clinicians. In nondiabetic subjects, hypoglycemic disorders are classified as postabsorptive (fasting) hypoglycemia, or postprandial (reactive) hypoglycemia, which occurs within 4 hours after food ingestion (3). In the absence of any known cause, reactive hypoglycemia is classified as “idiopathic.”
Although several underlying mechanisms have been put forward, the pathogenesis of idiopathic reactive hypoglycemia (IRH) still remains quite obscure and widely challenged (8).
A previous case report in a woman with postprandial hypoglycemia evidenced a neuroendocrine tumor secreting glucagon-like peptide 1 (GLP-1), suggesting a role of this hormone in the pathogenesis of this condition (9).
The aim of our study is to investigate the response of the glucoregulatory and gastrointestinal hormones to an oral glucose tolerance test (OGTT) in individuals with documented IRH. In addition, we assessed insulin sensitivity by oral glucose insulin sensitivity (OGIS) index and its relation with the hormonal response to OGTT.
Materials and Methods
All patients referred to the Diabetes Unit of Federico II University of Naples for symptoms of reactive hypoglycemia (according to Endocrine Society Clinical Practice Guidelines) (10) from January 2012 to January 2014 were enrolled onto the study. The exclusion criteria were the following: age less than 18 years; history of diabetes mellitus; use of drugs known to cause hypoglycemia; active infections; adrenocortical failure; malignancy; unstable medical conditions; ongoing pregnancy; alcohol abuse; hepatic, kidney, or heart failure; or lack of informed consent signature. The clinical history was collected for each patient to exclude accidental or surreptitious hypoglycemia. After obtaining informed consent, all subjects underwent clinical, laboratory, and imaging examinations to exclude conditions associated with endogenous hyperinsulinism (insulinoma, nesidioblastosis, insulin autoimmune hypoglycemia). Reactive hypoglycemia was defined by the presence of hypoglycemic symptoms, signs, or both together with documented plasma glucose level less than 55 mg/dL (3.0 mmol/L) after a mixed meal using a meal similar to that which the patient reports has caused symptoms, according to current clinical reccomendations (10). Subjects fulfilling the criteria for IRH represented the cases group. Eight healthy control subjects were enrolled in parallel among the hospital staff. In the morning, all participants underwent a frequently sampled 75-g OGTT. After an overnight fast, blood samples were collected through an indwelling cannula for the measurement of plasma glucose and hormones. Blood samples were collected at 0, 30, 60, 90, 120, 180, 240, and 300 minutes in heparinized tubes for the determination of glucose and insulin and at 0, 15, 30, 45, 90, 120, 180, 240, and 300 minutes for the measurement of GLP-1, glucose-dependent insulinotropic peptide (GIP), and glucagon in chilled EDTA tubes containing 50 KIU of Aprotinin/mL of blood, immediately centrifuged at 4°C and stored at −70°C until assayed, as reported by Di Marino et al (11). In the case of a hypoglycemic event, the test had to be stopped and, therefore, measurements were performed only on blood samples collected before hypoglycemia occurred. Insulin sensitivity was evaluated by the oral glucose insulin sensitivity (OGIS) index, which has been demonstrated to correlate with measure of insulin sensitivity obtained from hyperinsulinemic glucose clamp (12). The present study protocol was approved by the Ethic Committee of Federico II University.
Laboratory assessment
Plasma glucose concentration was measured by the glucose oxidase method. Plasma insulin was determined by ELISA (DIAsource ImmunoAssays S.A.). Active GLP-1 was assayed by a nonradioactive, highly specific sandwich ELISA method (Merck Millipore) with 100% cross reactivity with 7–36 amide and 7–37 glycine extended, but no reactivity with 9–36 amide and 9–37 glycine-extended GLP-1 isoforms, GLP-2, or glucagon. Total GIP was assayed by a nonradioactive, highly specific sandwich ELISA method with (Merck Millipore) 100% cross reactivity to human GIP (1–42) and GIP (3–42). The limits of sensitivity were 2 pmol/L for GLP-1 and 10 pg/mL for GIP. The intra- and interassay coefficients of variation of the GLP-1 and GIP assays were respectively less than 5% and less than 10%. Plasma glucagon was assayed by competitive RIA using a rabbit antiserum against a glucagon-albumin conjugate (Euria-Glucagon, EuroDiagnostica). Glucagon in standards and samples compete with 125I labeled glucagon in binding to the antibodies in a two-step incubation. 125I-glucagon binds in a reverse proportion to the concentration of glucagon in standards and samples. Antibody-bound 125I-glucagon is separated from the unbound fraction using double antibody solid phase. The radioactivity of the bound fraction was measured in a gamma counter. The limit of sensitivity for the glucagon assays was 3 pmol/L. The intra- and interassay coefficient of variation was less than 10% .
Statistical analysis
Statistical analysis was performed with the SPSS 17 system (SPSS, Inc.). Continuous data were expressed as means ± SEM; categorical variables were expressed as percentages. To compare continuous variables, an independent sample t test was performed. Because of the skewed distribution of insulin and GLP-1, Mann-Whitney U test was used to compare means between IRH and control subjects. Pearsons's test was used to assess correlations among continuous variables. The χ2 test was used to analyze categorical data. When the minimum expected value was less than 5, the Fisher's exact test was used. The general linear model for repeated measures was used to compare the relationship between time and postchallenge profiles of glucose and hormones between the two groups after logarithmic transformation (Log10). To adjust for potential confounders and to make prediction, a linear regression analysis (stepwise method) was implemented in which plasma glucose level was the dependent variable and the major clinical, demographic, and laboratory parameters served as independent variables. All the results are presented as two-tailed values with statistical significance for P < .05.
Due to the preliminary nature of the study, it was not possible to calculate the sample size needed to obtain a power greater than 80% with an α error less than 5%.
Results
Cases and controls were comparable for the main clinical and demographic characteristics, as shown in Table 1. Fasting levels of the glucoregulatory and gut hormones were similar between cases and controls.
Clinical, Metabolic, and Hormonal Characteristics of IRH and Control Subjects
| Characteristics | IRH Subjects (n = 10) | Controls (n = 8) | P |
|---|---|---|---|
| Male sex, n (%) | 0 (0) | 2 (25) | .183 |
| Age, y | 29 ± 2.8 | 36 ± 5.6 | .280 |
| BMI, kg/m2 | 23 ± 1.3 | 27 ± 2.1 | .206 |
| SBP, mm Hg | 112 ± 3.8 | 108 ± 4.6 | .762 |
| DBP, mm Hg | 63 ± 0.9 | 55 ± 1.8 | .082 |
| Total cholesterol, mg/dL | 171 ± 8.8 | 182 ± 14.8 | .524 |
| Triglycerides, mg/dL | 87 ± 14.5 | 89 ± 26.5 | .934 |
| HDL-C, mg/dL | 59 ± 3.79 | 62 ± 6.7 | .735 |
| LDL-C, mg/dL | 94 ± 7.9 | 102 ± 14.1 | .619 |
| AST, mg/dL | 16 ± 0.9 | 16 ± 1.4 | .735 |
| ALT, mg/dL | 14 ± 0.9 | 12 ± 1.1 | .232 |
| Fasting plasma glucose, mg/dL | 70 ± 3.79 | 70 ± 2.1 | 1.000 |
| Fasting plasma insulin, μU/mLa | 7 ± 1.9 | 4 ± 0.7 | .215 |
| TSH, μU/mL | 1.9 ± 0.2 | 2 ± 0.1 | .895 |
| Glucagon, pmol/L | 37 ± 2.2 | 37 ± 2.5 | .998 |
| GLP-1, pmol/La | 3.4 ± 0.6 | 2.9 ± 0.2 | .417 |
| GIP, pmol/L | 53.8 ± 9.4 | 47.8 ± 14.6 | .181 |
Abbreviations: AST, aspartate transaminase; ALT, alanine transaminase; BMI, body mass index; DBP, diastolic blood pressure; HDL-C, high-density lipoprotein cholesterol; LDL-C, low-density lipoprotein cholesterol; SBP, systolic blood pressure.
Test performed by using the Mann-Whitney U test.
During the OGTT, all IRH participants had to stop the test before completion (T300) due to the onset of symptoms and/or signs of hypoglycemia (blood glucose < 55 mg/dL), which was resolved by iv 10% glucose infusion. Plasma glucose levels were consistent with signs and/or symptoms (κ for concordance = 1.000). Six patients reached glucose levels less than or equal to 55 mg/dL at T240, whereas the remaining four patients reached the hypoglycemic target at T60, at T90, at T120, and at T180, respectively. None of the control group reported signs and/or symptoms suggestive of hypoglycemia during the OGTT. As shown in Figure 1A, mean plasma glucose levels were lower in IRH than in control subjects, reaching a statistically significant difference at T240 (43 ± 1.6 vs 72 ± 0.3 mg/dL; P for t test = .001). Insulin response was higher in IRH than in control subjects as shown according to the general linear model for repeated measures (F = 2.52; P = .019). In particular, as shown in Figure 1B, the difference in insulin levels was statistically significant with percent change of 46% at T90 (87 ± 16.8 vs 47 ± 8.5 μU/mL in IRH and controls, respectively; P for Mann-Whitney U test = .045) and was paralleled by a more than double insulin/glucose ratio (1.18 ± 0.28 vs 0.50 ± 0.06 in IRH vs controls; P for t test = .046).
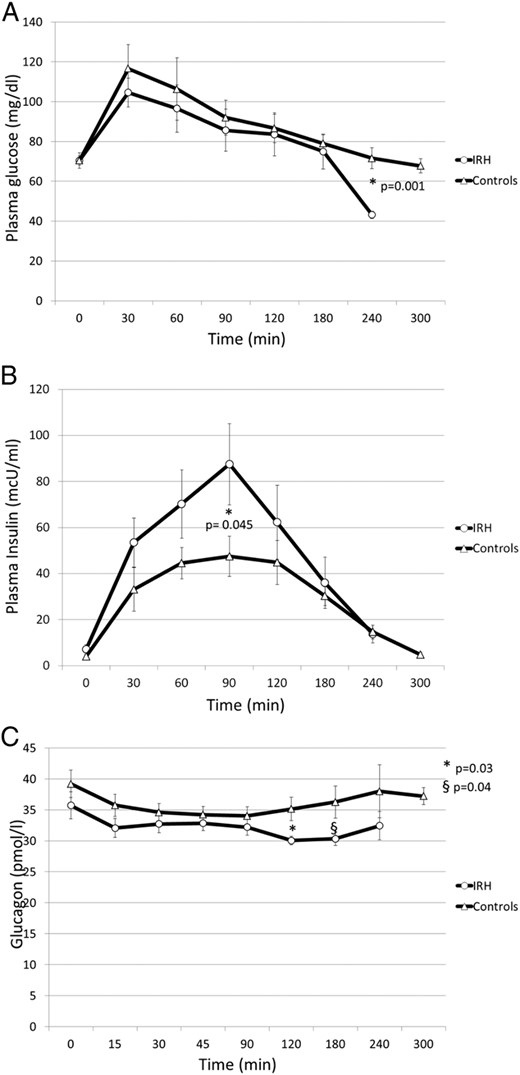
Plasma glucose (A), insulin (B), and glucagon (C) response to OGTT in patients with IRH and in control subjects.
Data are expressed as mean ± SEM. Comparisons for plasma glucose and glucagon levels were performed by using t test. Plasma insulin levels were compared with Mann Mann-Whitney U test.
Plasma glucagon levels were lower in IRH than in control subjects, reaching a statistically significant difference in the late phase of the OGTT: at T120 (30.8 ± 0.6 vs 35.1 ± 1.9 pmol/L, P for t test = .031) and at T180 (30.1 ± 0.9 vs 36.2 ± 2.6 pmol/L, P for t test = .048) (Figure 1C).
The general linear model for repeated measures showed a significantly greater response in GLP-1 among IRH compared with control subjects (F = 2.93; P = .005). As shown in Figure 2A, GLP-1 peaked to 9.77 ± 2.52 in IRH vs 4.19 ± 0.53 pmol/L in controls; P for Mann Mann-Whitney U test = .041) with a percent increase of 188 ± 26.9% in IRH and 43 ± 4.9% in control subjects (P for t test = .046). In contrast, no significant difference was found in the GIP response to OGTT between the two groups (Figure 2B). In the IRH group, GLP-1 peak inversely correlated with the nadir of plasma glucose (r = −0.66; P = .039) (Figure 3).
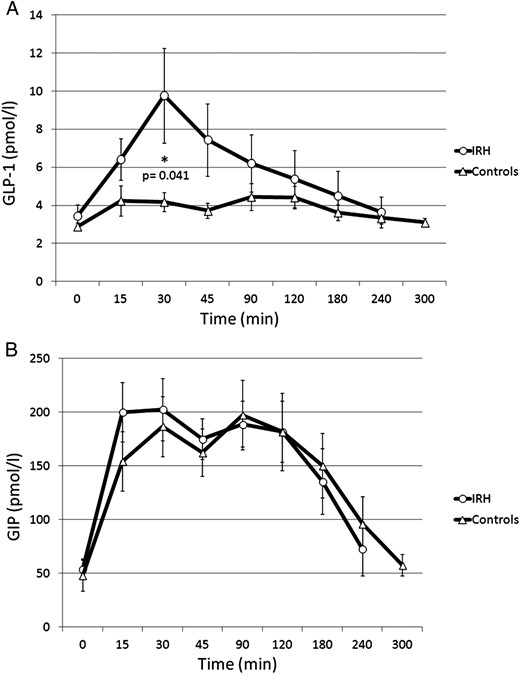
GLP-1 (A) and GIP (B) response to OGTT in patients with IRH and in control subjects.
Data are expressed as mean ± SEM. Comparisons for GLP-1levels were performed by using Mann Mann-Whitney U test. GIP levels were compared with t test.
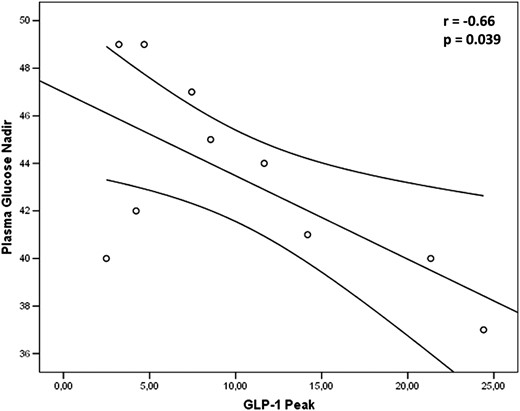
Correlation between plasma glucose nadir and GLP-1 peak in patients with IRH.
At multivariate analysis, adjusted for clinical and demographic characteristics, GLP-1 peak independently predicted the plasma glucose nadir (β = −0.593; P = .026).
Insulin sensitivity, evaluated by the OGIS index, was similar in the two groups (513.0 ± 18.5 and 516.5 ± 22.9 mL·min−1·m−2; P = .909, in IRH and control subjects, respectively). No correlation was found between insulin sensitivity and the hormonal response to OGTT.
Discussion
To the best of our knowledge, this is the first study demonstrating a role of GLP-1 in the pathogenesis of IRH. In individuals with IRH, OGTT-induced hypoglycemia was accompanied by higher insulin and GLP-1 and lower glucagon levels than in control subjects. A major role of GLP-1 clearly emerges from the linear regression analysis showing that the changes in GLP-1 levels predicted the plasma glucose nadir independently of all other variables. Overall, these data support the novel finding that IRH may be accounted for by exaggerated postmeal GLP-1 secretion.
Our finding is in line with previous evidence obtained in different clinical settings. Indeed, increased GLP-1 levels and a significantly greater insulinotropic GLP-1 action have been observed in patients who have undergone Roux-en-Y gastric bypass (13). Moreover, patients with postbypass hypoglycemia have a significantly greater insulin and GLP-1 response to meal or glucose ingestion than nonhypoglycemic patients or control subjects (14–16). These findings suggest that an excessive secretion of gut hormones (17–19) stimulated by the rapid entry of nutrients into the intestine, might be responsible for hyperinsulinemia with consequent decrease in blood glucose.
A relationship between GLP-1 and reactive hypoglycemia has been found also in the absence of altered gastrointestinal anatomy, as evidenced in a case of postprandial hypoglycemia that resolved after removal of a GLP-1-secreting neuroendocrine tumor (9), or in islet transplant recipients who experienced postprandial hypoglycemia following GLP-1 mimetic (exenatide) therapy (20). There is also evidence that the administration of high doses of GLP-1 in the presence of a normal islet β-cell mass (21, 22) can induce reactive hypoglycemia.
It is worth considering that all these studies were performed in patients with specific pathological conditions (neuroendocrine cancer or malabsorption after bariatric surgery) or in people receiving abnormally high GLP-1 infusion in the frame of experimental protocols (21, 22). In contrast, our study is the first one demonstrating an increased postprandial GLP-1 response in apparently healthy individuals with IRH.
In our IRH subjects, we found significantly lower glucagon levels compared with controls. This result is in line with previous studies suggesting that GLP-1 infusion can induce hypoglycemia through an excessive insulin secretion together with suppression of glucagon and an increased insulin-to-glucagon molar ratio (21, 22). Therefore, it could be hypothesized that the GLP-1 inhibitory effect on glucagon secretion does prevail on the stimulatory effect exerted by hypoglycemia. In particular, reactive hypoglycemia does occur when insulin is inappropriately elevated in relation to prevailing plasma glucose concentration and/or glucagon secretion is not fully activated.
The time-course of the hormonal response to OGTT deserves a comment. The first event was the early (30 min) increase in GLP-1, followed by the increase in insulin at 90 minutes while glucagon suppression occurred at 120–180 minutes and blood glucose decreased at 240 minutes. Although insulin-mediated suppression of glucagon could be expected at an earlier stage due to a paracrine effect, the concomitant decrease in glucose levels might have delayed the decrease in glucagon levels. Indeed, a similar pattern in glucagon time course has been reported in patients with postbypass hypoglycemia (23).
The mechanism responsible for the excessive GLP-1 response to OGTT in our subjects with IRH is unclear. One possibility could be an accelerated gastric emptying. This hypothesis is based on a case report by Middleton et al (24), who documented an accelerated gastric emptying associated with postprandial nausea, bloating, and abdominal discomfort in adults with reactive hypoglycemia.
Further addressing the pathophysiological mechanisms of IRH, in our sample we evaluated insulin sensitivity in the light of previous studies demonstrating an increased peripheral glucose uptake in individuals with reactive hypoglycemia (25). We found normal insulin sensitivity, which supports the view that IRH is due in large part to exaggerated postprandial insulin and GLP-1 response. The finding that IRH subjects present normal insulin sensitivity does not contradict the general belief that these subjects are at higher risk of developing diabetes. Actually, the exposure to recurrent, high insulin levels may deteriorate insulin sensitivity. Moreover an excessive stimulation of the β-cells can eventually lead to an impairment of their function that facilitate the development of type 2 diabetes (26).
Some limitations of the present study must be discussed. Based on the available recommendations, IRH should be induced by a mixed meal similar to that causing symptoms under everyday life conditions (10). Indeed, the glucose load is an unphysiological stimulus, rarely encountered outside clinical research setting (27, 28). However, no standardized test meals are currently available and, in most cases, they have been used for diagnostic purposes and not within the frame of research protocols. Therefore, although the OGTT is not the most suitable test for the diagnosis of reactive hypoglycemia, it still remains the most widely employed procedure in an experimental setting (8, 10) to investigate glucose tolerance, the relationships between symptoms and blood glucose levels, the entero- and the counterregulatory hormone response once the diagnosis of reactive hypoglycemia has been posed (29). Accordingly, we used an individualized mixed test meal to confirm the diagnosis of reactive hypoglycemia and tried to get insight into the underlying mechanisms by means of the OGTT. The present study has been designed as a pilot study and, given the limited number of subjects studied, further ad hoc designed studies are needed to validate our results. Thus, the present results will enable us to calculate the appropriate sample size of a full scale research study.
In conclusion, this is the first study showing that IRH is associated with postchallenge increased insulin and GLP-1 and lower glucagon levels compared with control subjects. The increase in GLP-1 correlated with insulin changes and predicted the plasma glucose nadir. These findings point to a role for GLP-1 in the pathophysiology of IRH and prompt for further investigations on the mechanisms underlying increased GLP-1 secretion in apparently healthy individuals.
Acknowledgments
The authors thank Dr Stefano Signorini (Laboratory Medicine, Desio Hospital, Università Milano Bicocca, Milan, Italy) for the glucagon assay.
Author Contributions: R.L. conceived and designed the study, performed statistical analysis, interpreted results, and drafted the manuscript; M.C., E.G., G.N., acquired clinical data and drafted the manuscript; G.R. and B.C. designed the study, interpreted results, and performed critical revision of the manuscript. All authors read and approved the final manuscript.
Disclosure Summary: The authors have nothing to disclose.
Abbreviations
- GIP
glucose-dependent insulinotropic peptide
- GLP-1
glucagon-like peptide-1
- IRH
Idiopathic reactive hypoglycemia
- OGIS
oral glucose insulin sensitivity
- OGTT
oral glucose tolerance test.
